Wall Street’s Rising Wedges


The Wall Street Bear is back! Or is he? Starting as far back as 2009, Wall Street has exhibited amazing resilience whenever it ran into headwinds of various kinds. 2009 was a big one; yet the rebound took off and did not falter, except for minor and brief hesitations. Then a second big drop happened when Covid-19 hit in March, 2020. The recovery was as sudden and steep as in 2009. Now we have the sell-off on Friday and the question whether it will be a repeat of 2009 and 2020 – or has the Bear awoken?
It so happens that it is not The Bear – except perhaps in disguise! – but a BogeyBear out of South Africa that has spooked the stock market! Omicron, a new and “heavily mutated’ variant of Covid-19 out of South Africa, again, that the media reported as ‘500% more virulent than delta.” The “Always something new out of Africa” syndrome that the old Romans quoted has apparently resurfaced to surprise the world.
However, the MSM in their pursuit of shocking news – more so if related to Covid – are again wrong. What apparently really happened is that four visitors from Botswana, all four doubly vaccinated, had to undergo routine tests on entering South Africa. All four were positive. After decades of rampant HIV and TB, etc, South Africa’s medical scientists are capable and they soon sequenced the genome of the virus the visitors carried. Omicron was discovered in South Africa, but it was then found to be already present in other countries in southern Asia and perhaps wider afield.
The four visitors were asymptomatic and it was found that infections with Omicron appeared to be quite light in all people and less virulent than delta, or so the health Minister has reported. South Africa finds itself again isolated and the markets faltered on the panicky MSM reports, which is the norm as far as Covid is concerned. At least it takes inflation off the main headlines, for which Powell must be happy now that he is remaining at the tiller of the Fed while the financial currents are taking the US closer to a rocky shore.
So, is Friday’s dip on Wall Street all about a new virus variant, or is there something else lurking in the background – hiding behind the new virus – that warns the time is right for a correction? There is a widely accepted technical feature that most analysts would regard as a signal that a long running bull market is making a top. This is the rising wedge formation – and extension of the bull market that has a relatively broad base and narrows as the price keeps on increasing.
Rising wedges can be quite broad and shallow, or narrow and steep, with the latter often seen as a blow-off formation. As with all narrowing formations, the price in most instances breaks from the chart pattern after having completed 5 ‘legs’ from one side to the other. The first leg begins as a minor correction on which the other legs build until the break lower at the end of leg 5. When the ‘legs’ increase to 7, as often seem to happen in currency pairs, my interpretation has been that the market was being manipulated to keep the trend intact. More than 7 legs are rare in my experience and only postpones the inevitable; which means that a well-defined rising wedge generally is really bad news for a market.
The chart below is of the daily S&P500 and represents the latter part of the usual DJIA chart later in the report. The master line, M – from which all the other trend lines are derived - stretches from 1987 to 2009 and is a flat line near the bottom of the second chart below. This meant the master gradient had to be increased multiple times by the Fibonacci ratio to result in the much steeper derived lines of which the two red lines define the rising wedge. The Covid correction in March of 2020 forms the base line of the steep and narrow wedge, XF. The legs of the wedge are marked 1 to 7.
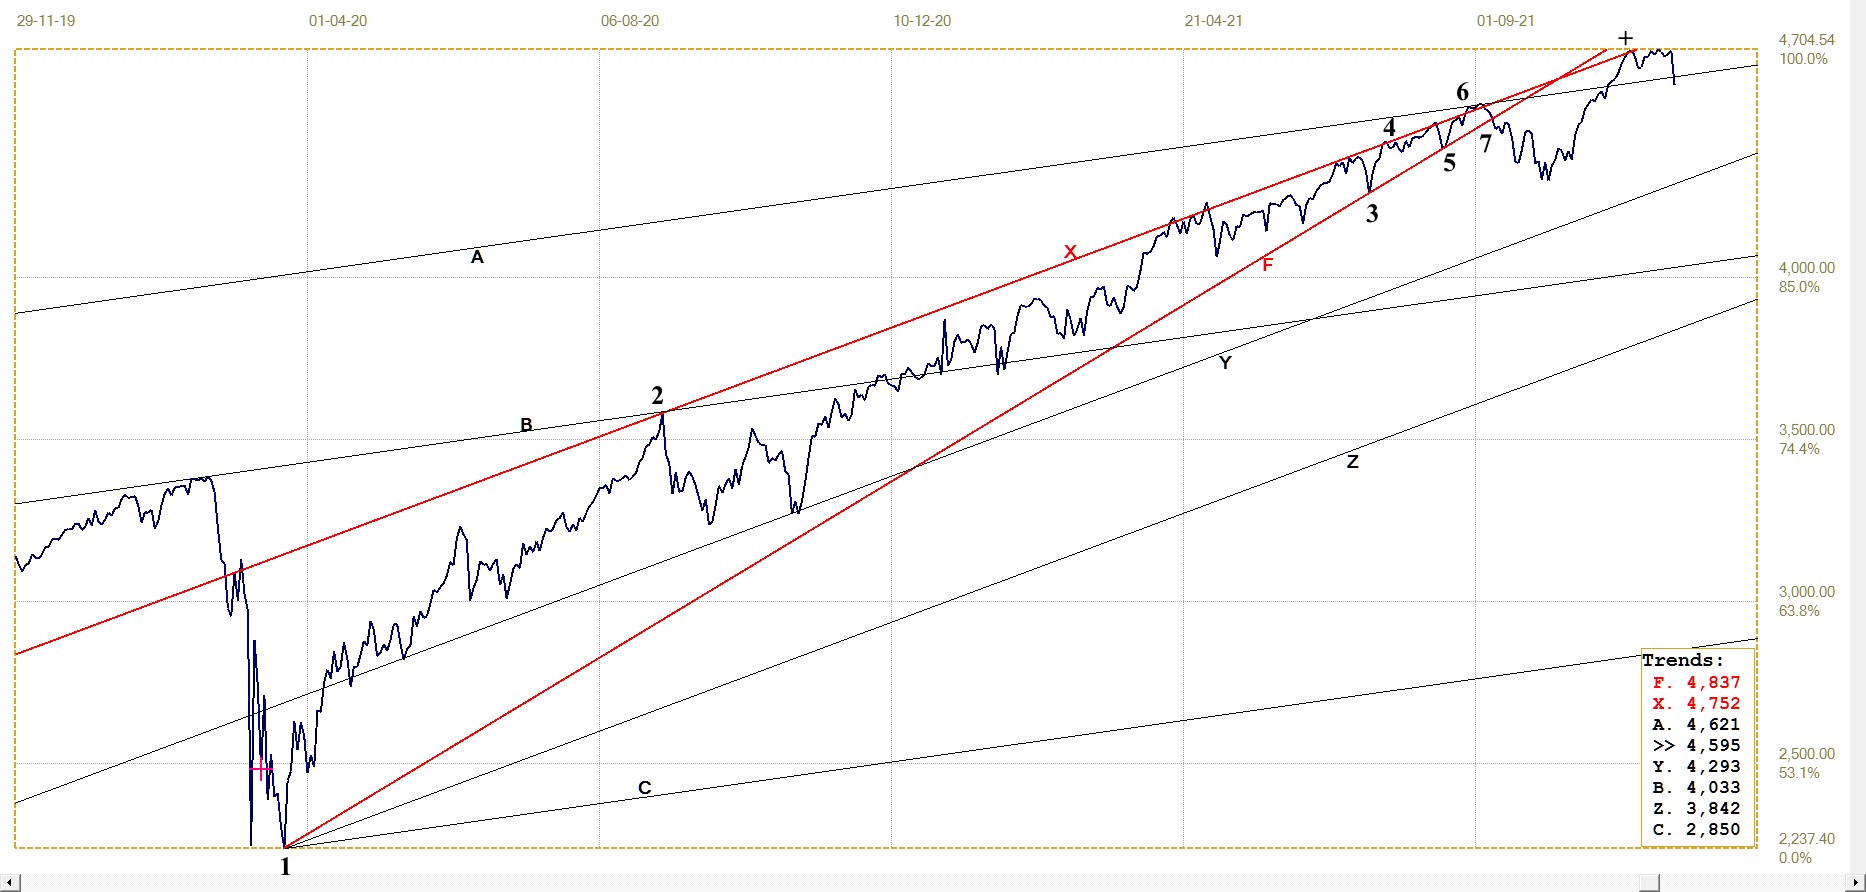
S&P500 daily. Last = 4594.62
It is interesting how well the chart fits the steep derived trend lines. The break out of the wedge did not begin a bear market, but reversed to touch line X again before the slight sideways move into the dip on Friday. It happens often that a price returns to retest a major pattern or significant support/resistance line after a break, an action termed a “goodbye kiss” (+ sign). Technically, this is a final attempt to recover the initial trend, which fails and thus becomes a prelude to the start of the new trend, a bearish one in this case.
However, with Powell knowing that his position is safe for another term, he will not be in the least bit hesitant to open the money spigots wide open, should it be necessary to halt a panic sell-off – as was done in 2009, in December 2018 and again in March 2020. The chart below, showing more of the S&P history, could be a ‘map’ to what the medium to longer term future holds.
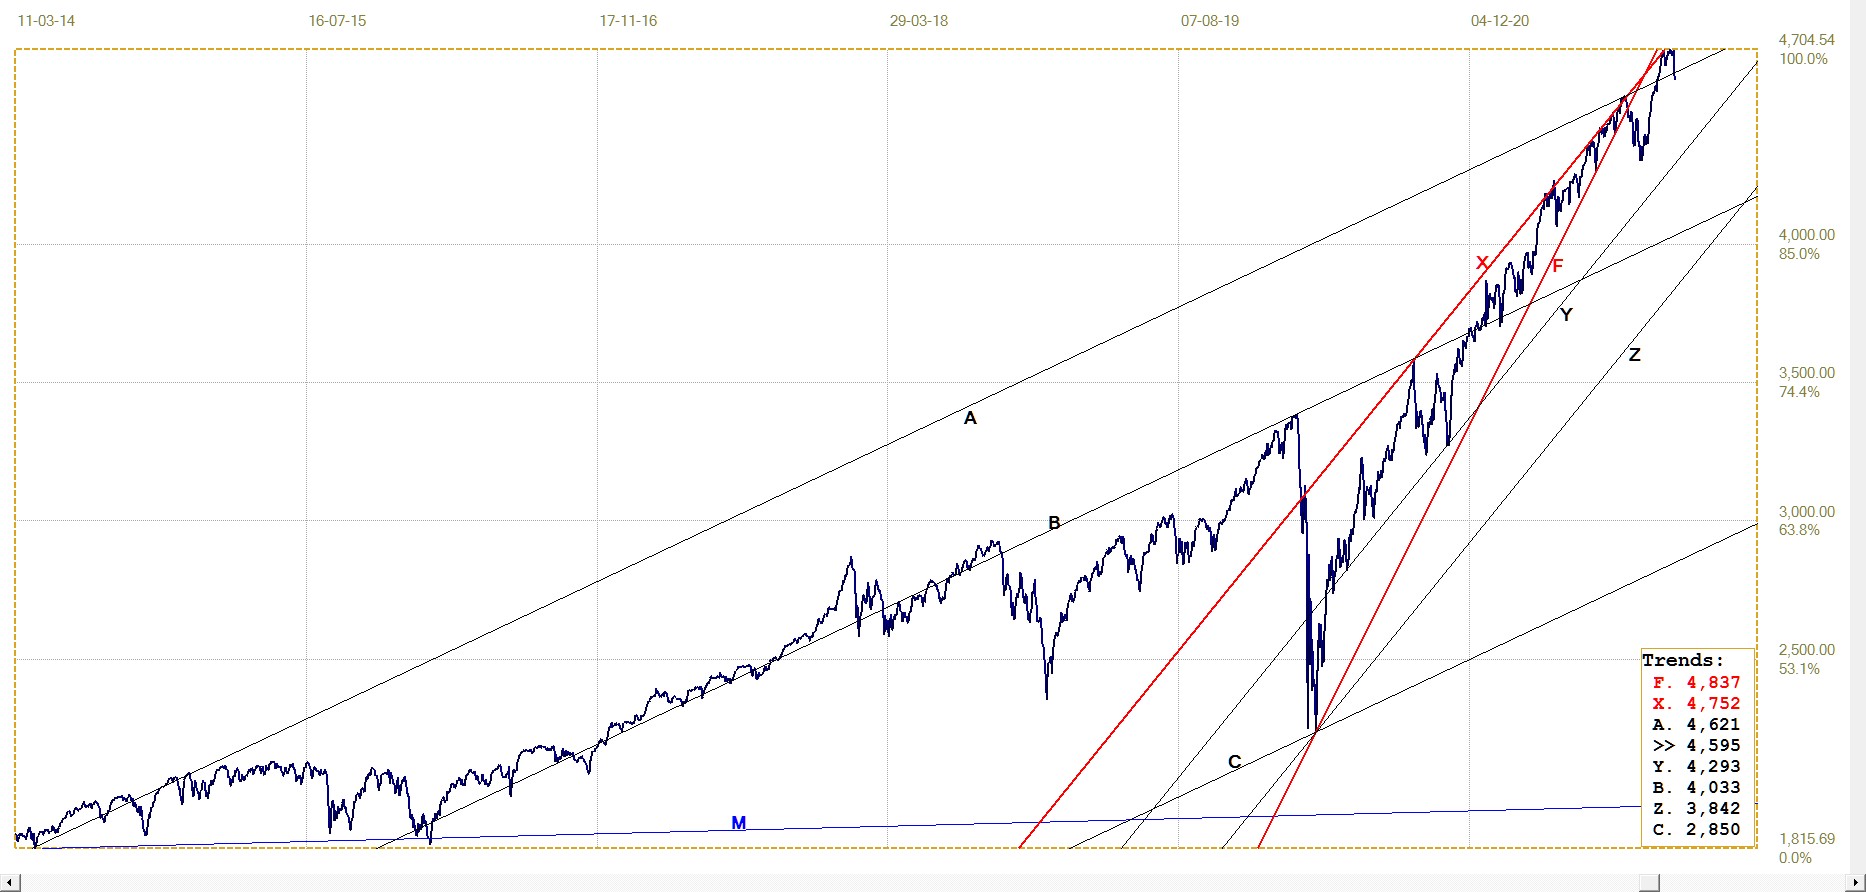
S&P500 daily. Last = 4594.62
It shows a much larger and broader rising wedge, AZ, of which only leg 2 has been completed. In principle, this implies that the S&P is to move sideways and lower, remaining in bull channel XYZ, until a reversal higher off line Z with leg 3 having been completed. Should leg 4 then proceed as high as the top of the wedge at line A, there would later be another series of all-time highs.
However, experience has learned that when leg 4 in a rising or falling wedge kicks off only to fail to extend far enough to be completed before reversing trend and breaking from the pattern – a premature break – the resulting move is steep and sustained. In this chart, line C at the bottom of bull channel ABC would be a likely target and, if it should happen to hold, thereby sustain the long term bull market.
The next chart, of the dollar index and similar to the one used a week ago, shows that the index reached the resistance line M – bottom of bull channel PQRM – before again reversing trend. This “goodbye kiss’ on the bull channel hints that the dollar rally is now over and should weaken for the near to perhaps medium term. It is tempting to suggest that with Powell at the Fed, should Wall Street come under bear attack with the dollar also turning softer, these would imply that lots and lots of dollars stand ready to be printed to come to Wall Street’s rescue!
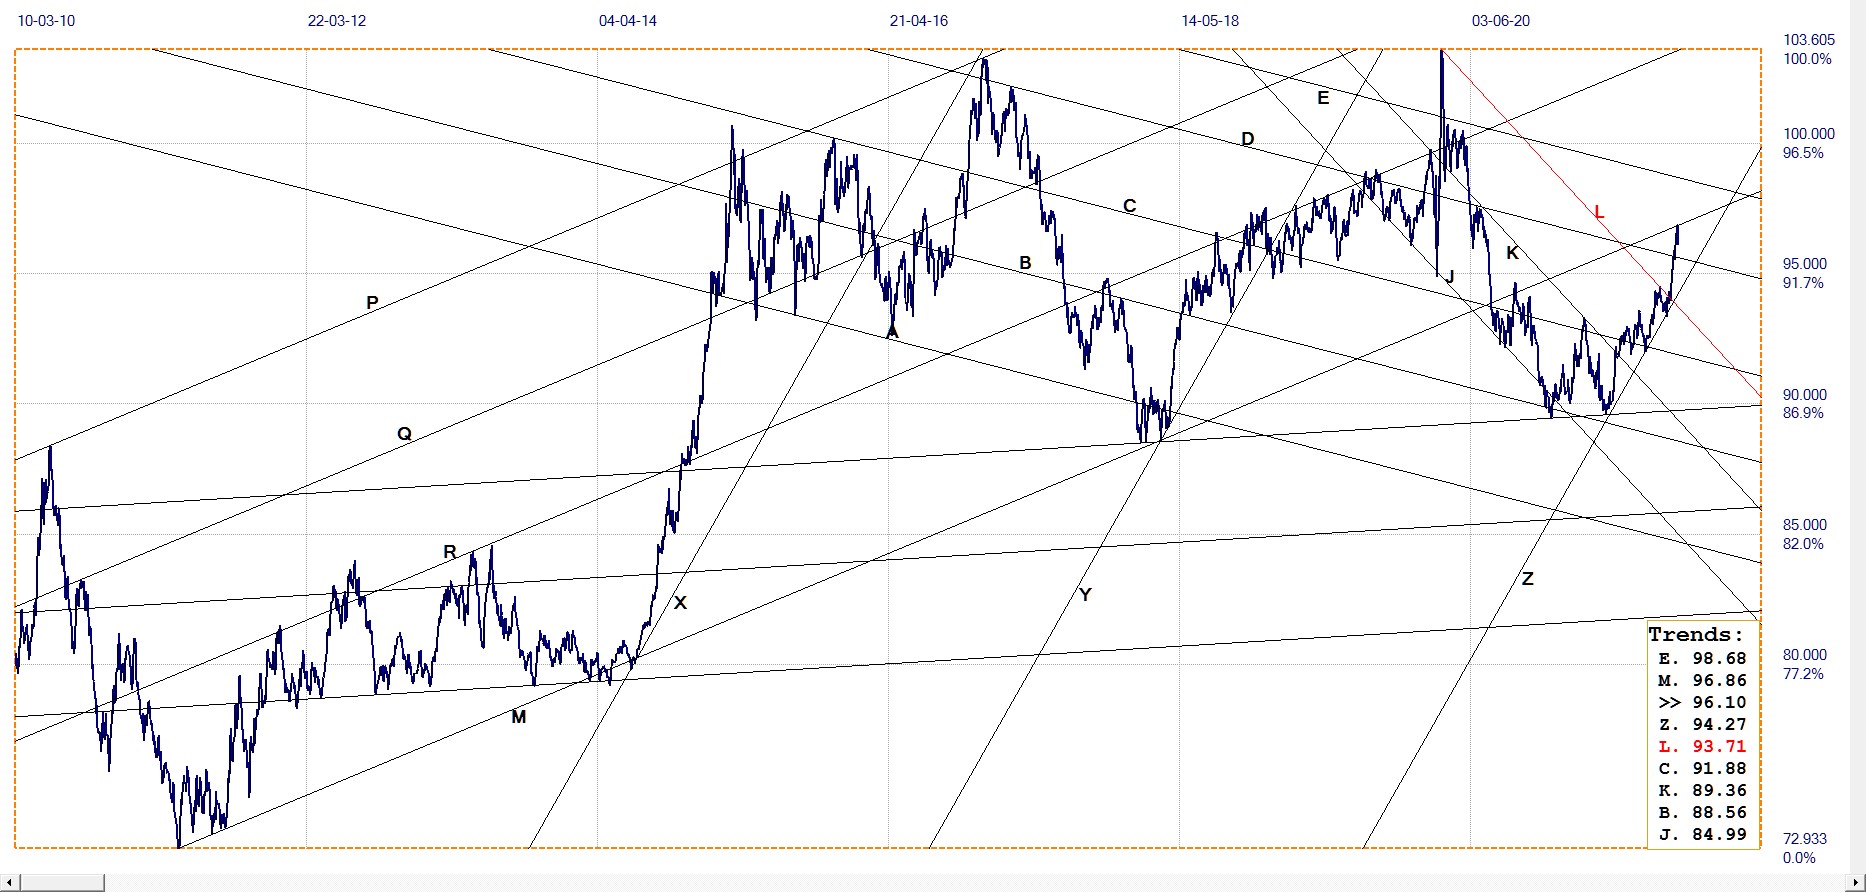
Dollar Index. Last = 96.10
The situation for gold and silver is basically unchanged, with month end on us and we all know what is likely to happen. Perhaps 2022 will be a more happy year when Basel lll kicks in?
Some new information about the vaccines is here and here for interested readers.
Euro–Dollar
The sudden reversal in the dollar late last week also boosted the euro a little; after hitting support that was shown last week – and now seen as really strong support in this slightly modified analysis – it has rebounded. The two channel systems, PQRS and WXYZ show that the euro (and by implication the US dollar) is under opposing forces with the broad mainly euro bull channel ABCDEM.
Technically this analysis supports the view that the dollar is due to resume its medium term bear trend as also visible on the earlier chart.
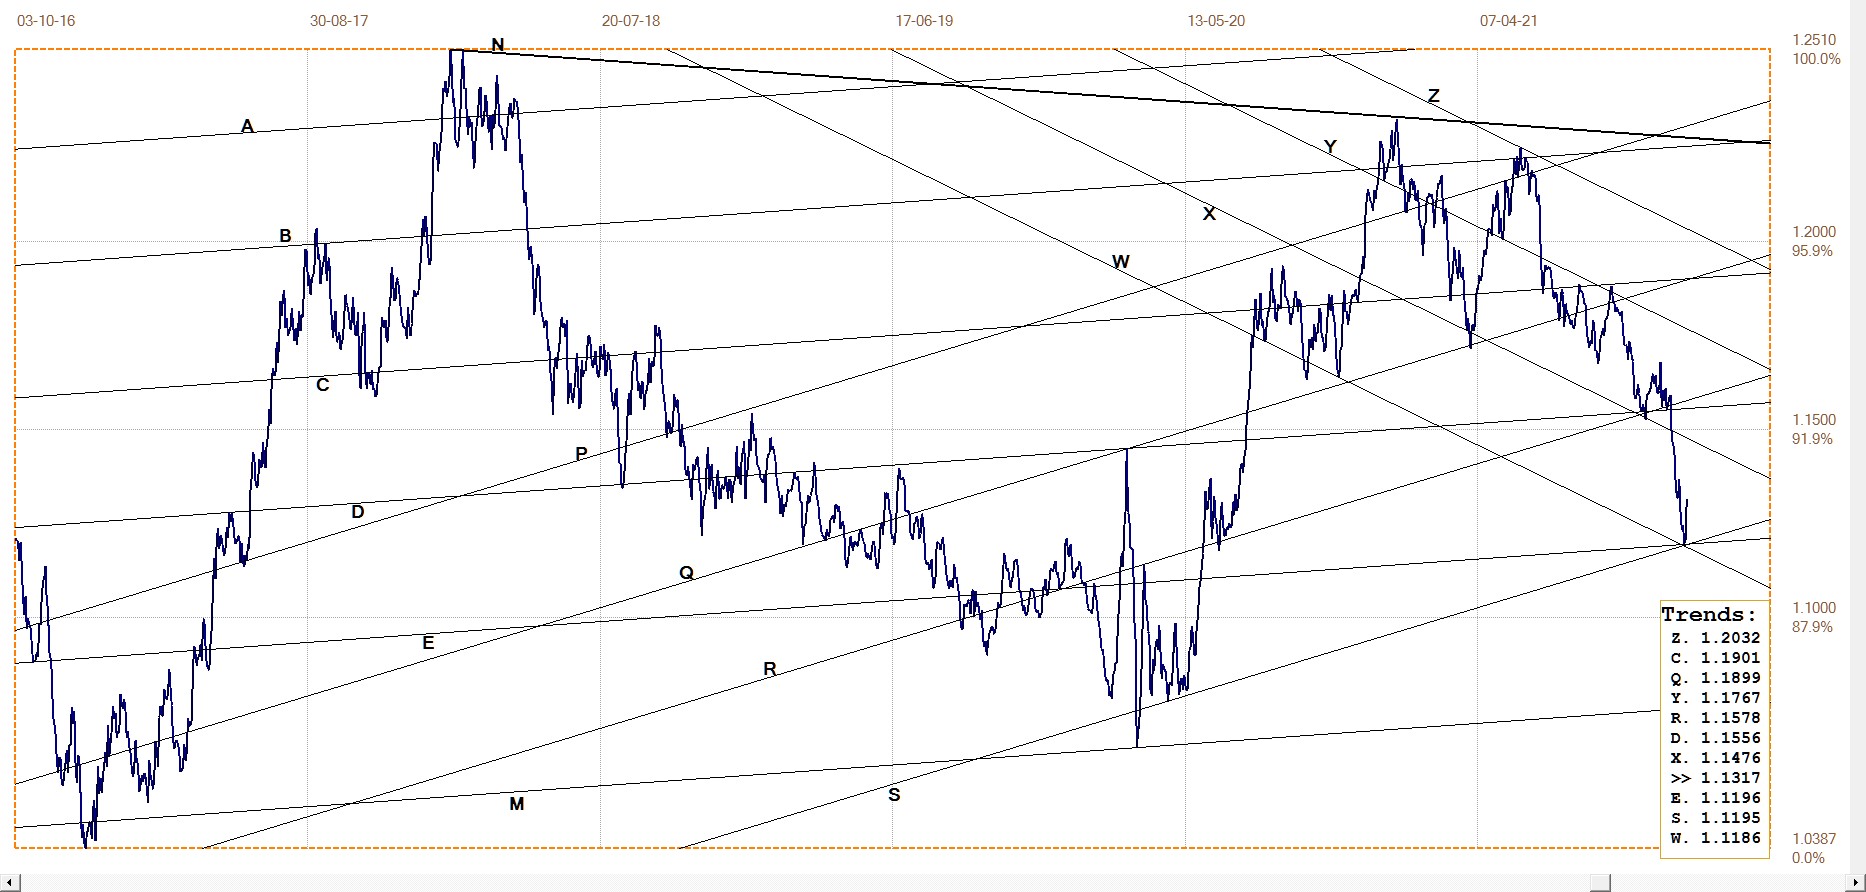
Euro–dollar, last = $1.1317 (www.investing.com)
DJIA daily close
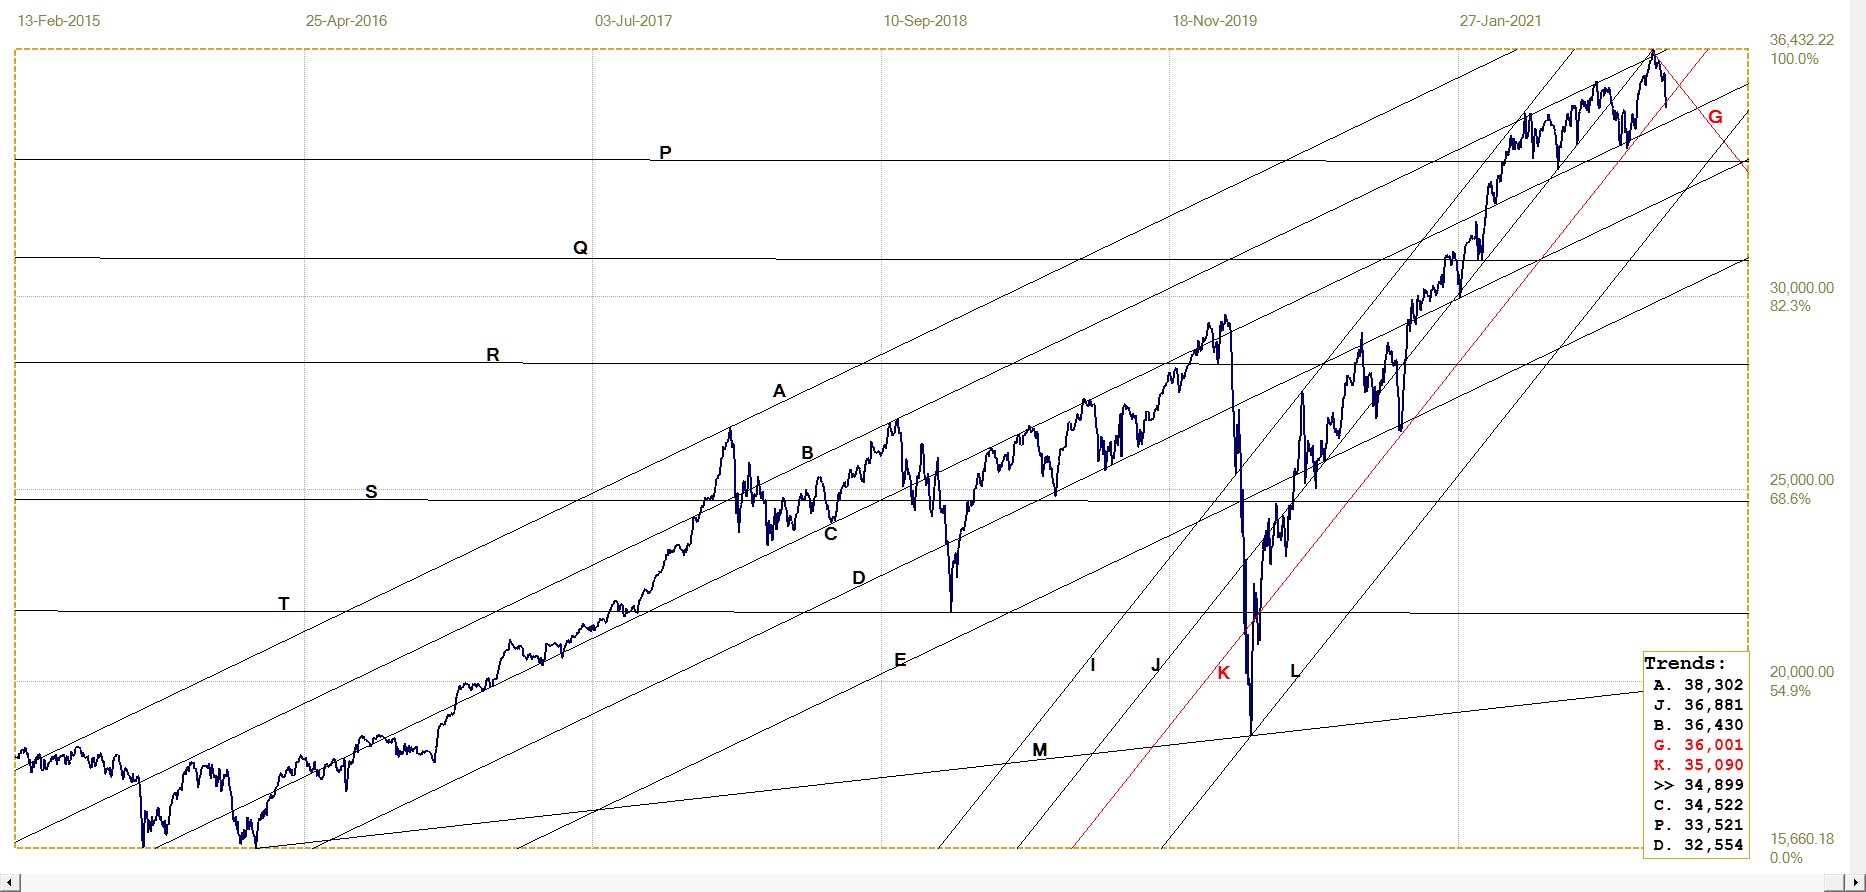
DJIA. last = 34899.34 (money.cnn.com)
Wall Street has already been discussed. The above chart of the DJIA is showing a minor break below channel IJK, which has contained the main thrust of the recent post March 2020 bull market very well indeed. Interesting that while the earlier S&P500 chart shows a resurgence after the initial top, the DJIA has failed to do so. It remains in bearish mode as long as the resistance along line G holds.
Should it be that the new Omicron variant was the main cause of the steep fall on Friday and news begins to filter through that, as reported in South Africa, it results in rather mild infections, Wall Street should rebound quickly.
On the other hand , if it were an opportunity grabbed by the Bears to hit the stock market over the Thanksgiving weekend, life could become more interesting during the next few days. It all depends on how big a fright investors that took the weekend off and only found out later what had happened suffered. We can be pretty certain that the Fed will try and reverse the trend again his week.
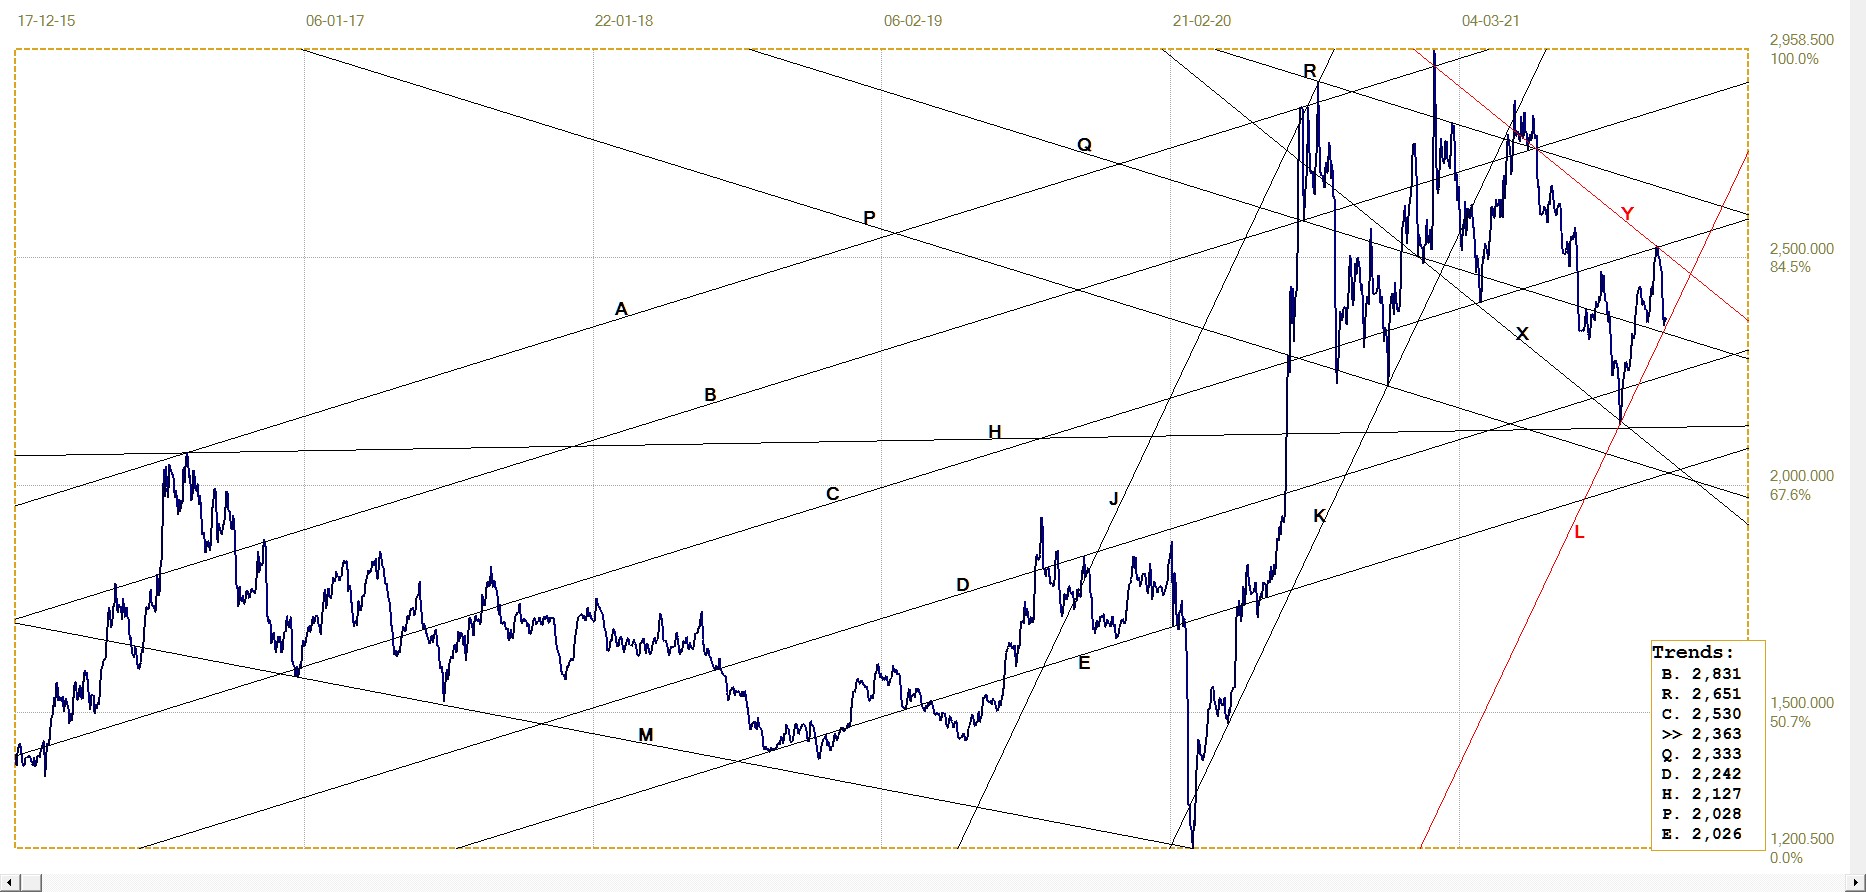
Gold London PM fix – Dollars
Gold price – London PM fix, last = $1800.80 (www.kitco.com)
As the chart shows, the improvement in the price of gold that managed to break clear of resistance at line Y failed to last into the end of the month and Comex expirations. This and the fact that $1800 is again a bridge too far come as no surprise.
Technically, it now all depends on whether bull channel RST will hold intact through the last few days of November and then past the NFP announcement. Should it hold, we could expect some improvement during December.
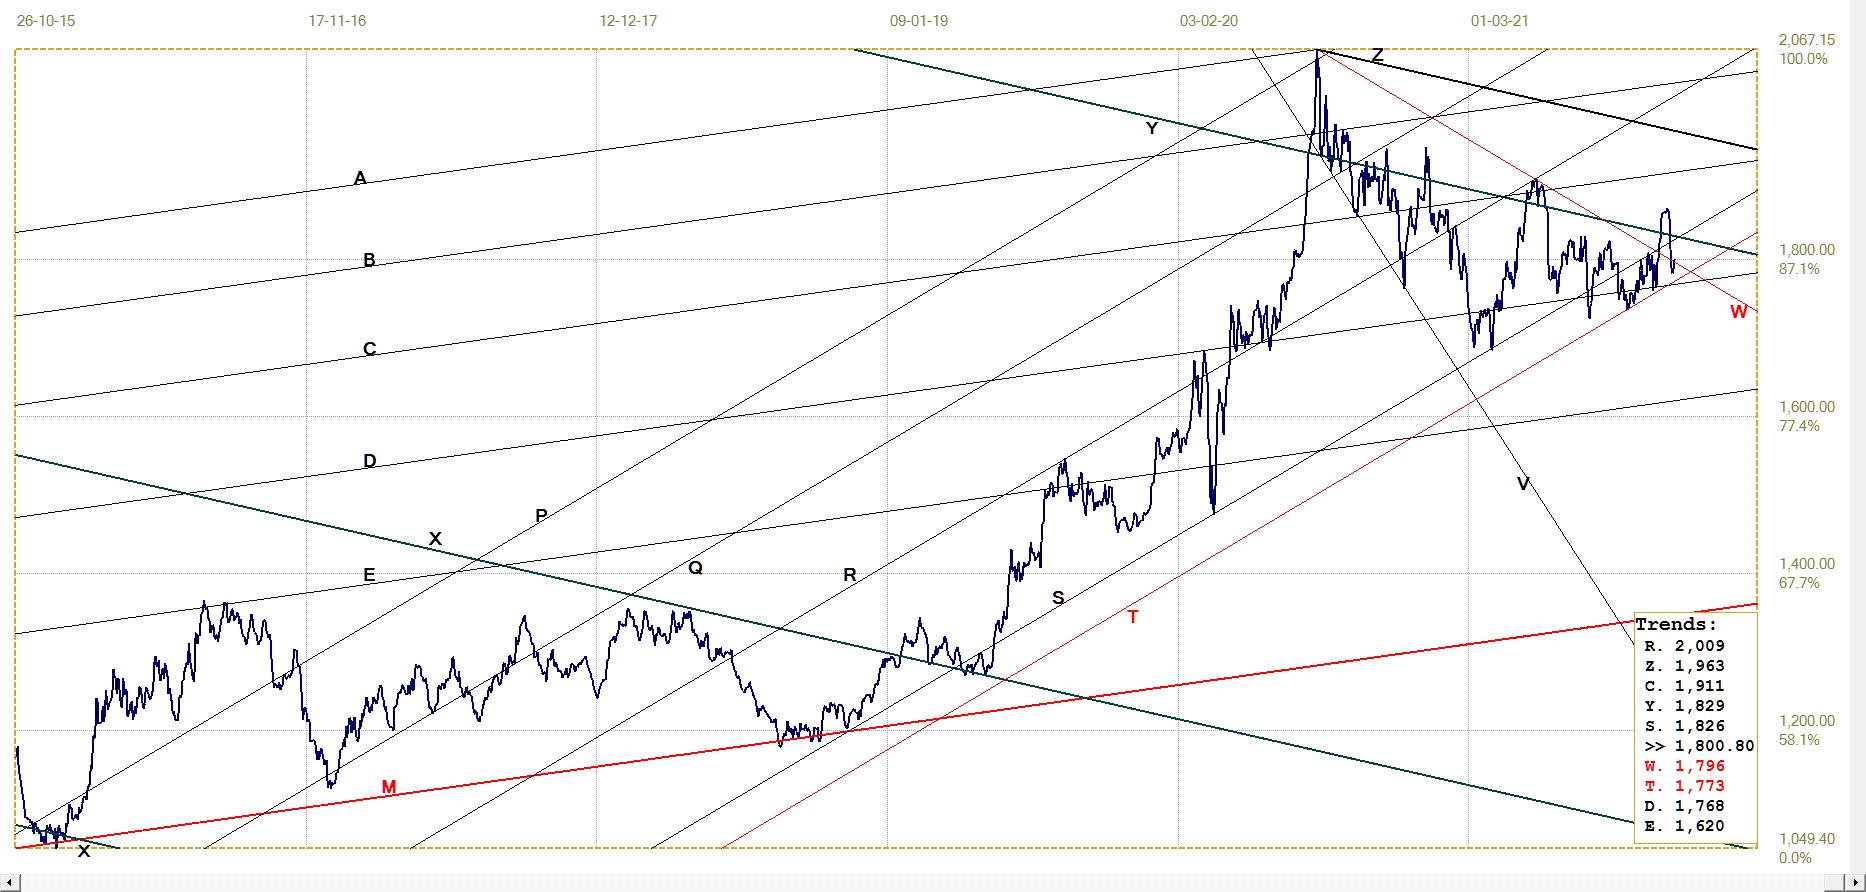
Euro–gold PM fix
The rally in the euro price of gold came to an abrupt end with the steep reversal in the dollar price of gold, combined with a new firmer trend in the euro. It is important from a technical perspective that bull channel PQR is intact and not under any immediate threat, while the break higher above lines G and Y is still holding – at least so far.
As for dollar gold, one can only wait until month end and NFP is past as far as the dollar price of gold is concerned, while the weaker trend in the dollar – if that were to continue – is really bearish for the euro price of gold.
Euro gold price – PM fix in Euro. Last = €1594.97 (www.kitco.com)
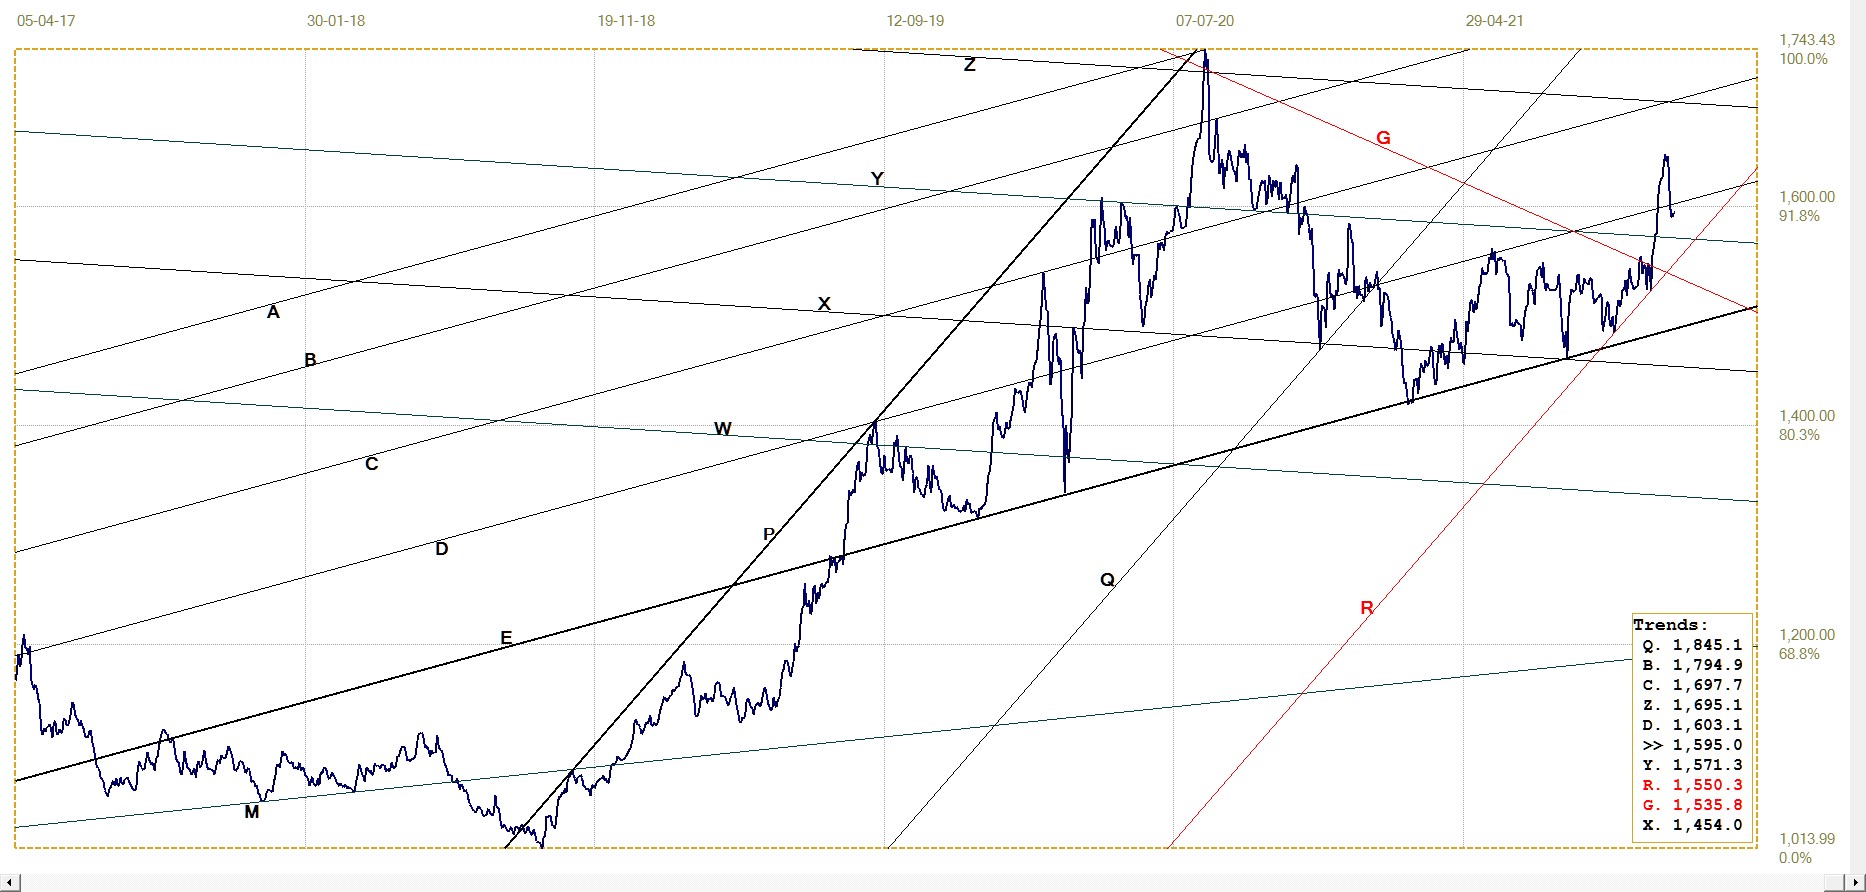
Silver Daily London Fix
The rebound in the price of silver from close to line H and off lines X and L progressed to reach resistance at lines C and Y, moving the exact width of channel XY before the reversal lower happened and the price was compelled to return to the bottom of bull channel KL. Both lines K and L of the channel in the past offered good support to bear spikes and now there is another test. Again, it all depends on what happens during the last two days of November and the first few days of December until NFP is history.
Silver daily London fix, last = $23.63 (www.kitco.com)
U.S. 10–year Treasury Note
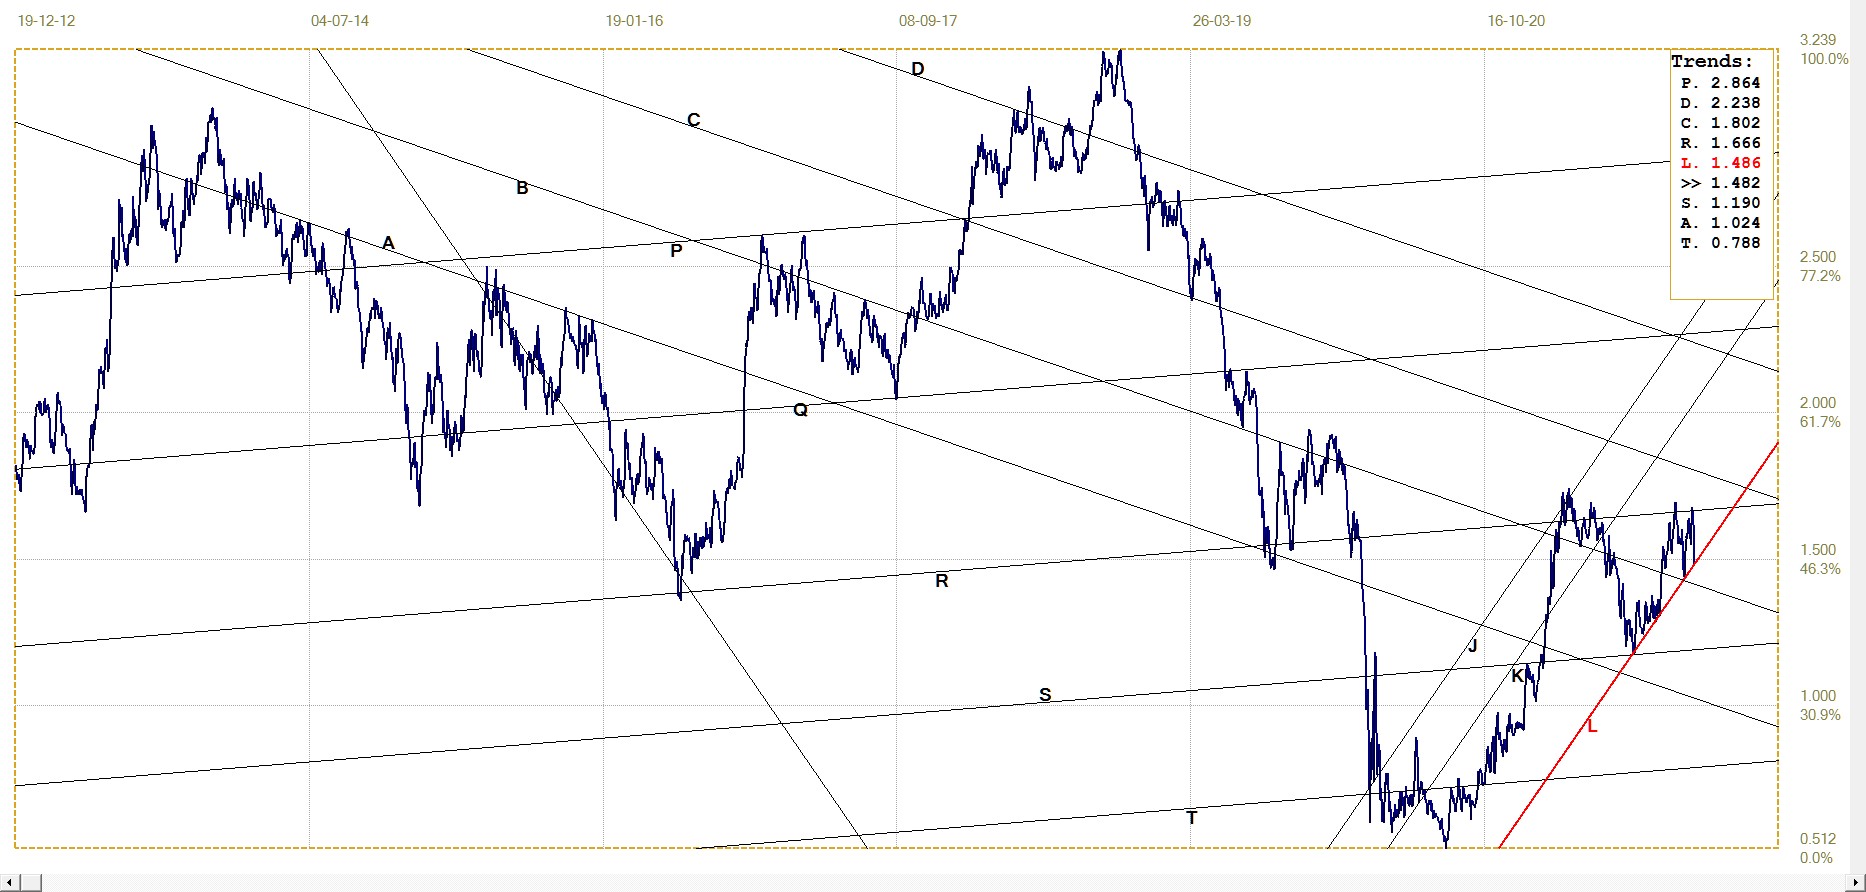
10–year Treasury note, last = 1.482% (Investing.com )
This is yet another example of a price reversing right at a long existing trend line only to return to another trend line for support. Even if the support should fail to hold, the fact that the price ended the week right on an existing trend line illustrates the presence of an accurate structure in market prices, something that is still denied as being impossible in a world of “A random walk” in market prices.
Technically, many analysts would view the recent pattern as a flat topped triangle that could be anticipated to break higher above the flat top. That would fit the “inflation is not transitory” scenario.
West Texas Intermediate crude. Daily close
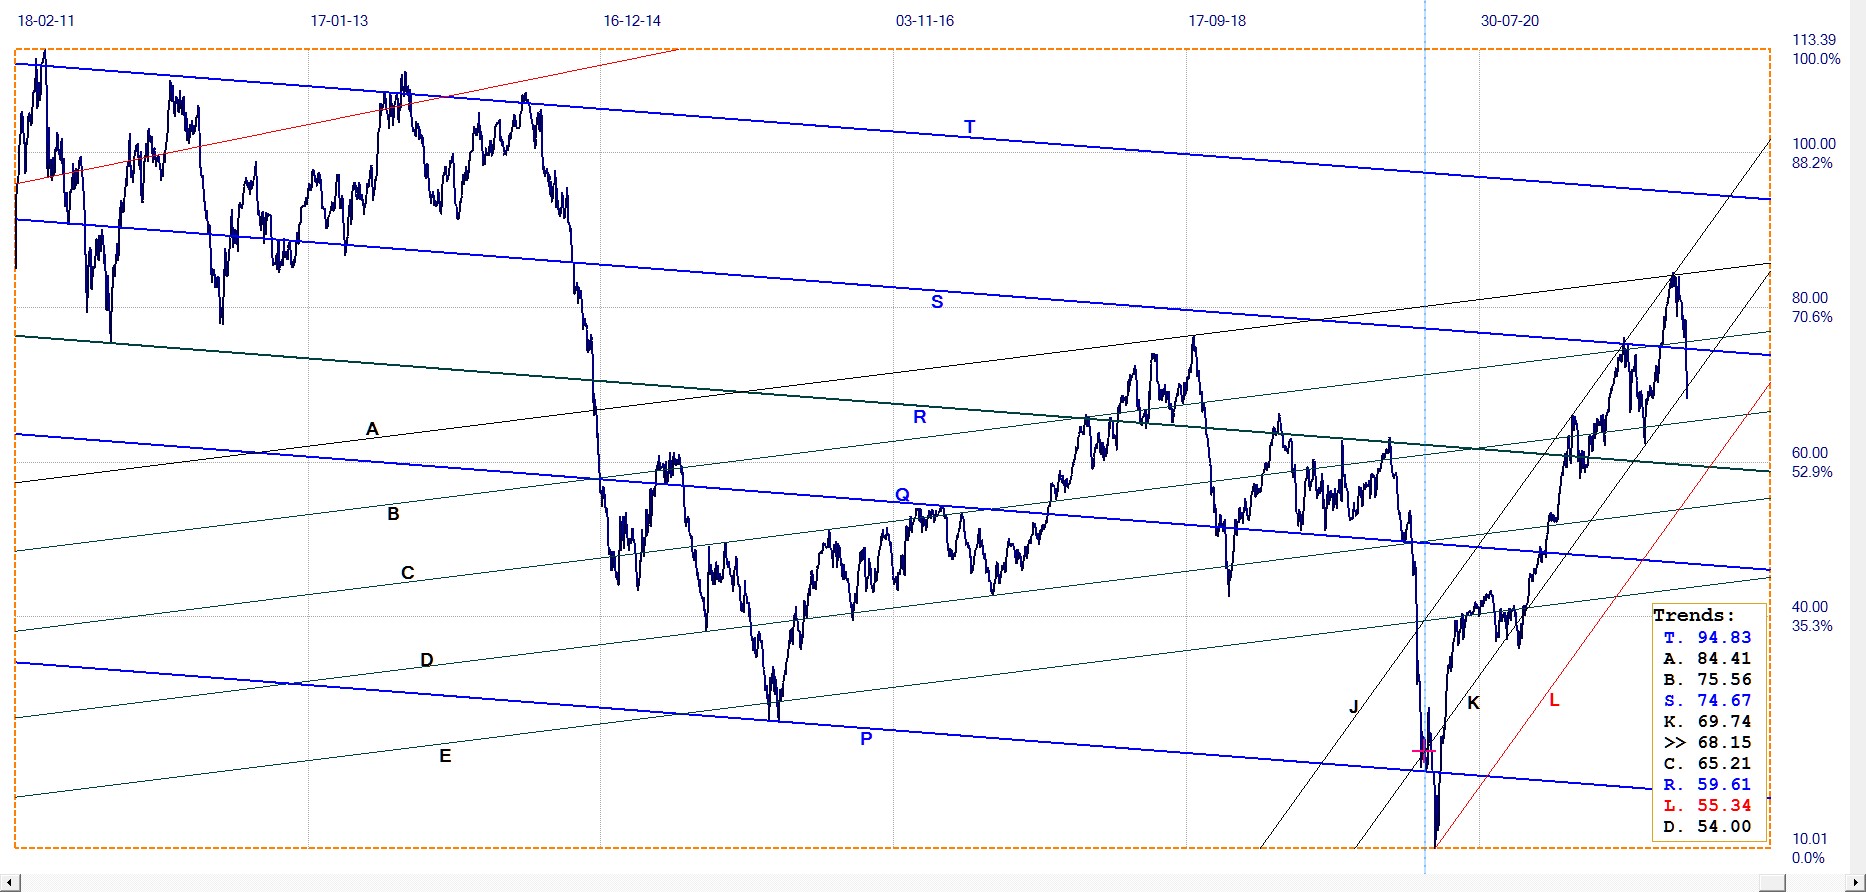
WTI crude – Daily close, last = $68.15 (www.investing.com)
Last week was a bad one for the energy sector. Not only did the stock market suffer a pretty poor half day on Friday, but Biden had previously announced that he was carrying the battle against inflation a step further by freeing up the national energy reserve to lower the price of energy. How wise that is, might be discovered later. Seeing that the US fossil fuel production is in decline with many wells no longer producing as before, and the number of new wells restricted by regulations imposed by the new administration, it is certain that the US will become more reliant on imports.
At the moment international relations are pretty good – everyone is focused on Covid and now a new variant – but in a sense Biden, by reducing the available reserves puts the US in a more vulnerable geopolitical.
The decline still has some way to go before a break below the bull channel signals that the bull trend is over.
© 2021 daan joubert.
********


