Western Interest In Gold Continues To Decline


Gold has managed to avoid a complete chart breakdown thus far, but that is due more to buying in the physical market out of the Far-East rather than any wholesale interest among the high-powered, deep-pocketed, Western-investment crowd. As noted many times here at this site, it is my firm opinion that while buying out of China and India can hold the price and form a floor in the gold market, it CANNOT drive the price sharply higher as so many rabid gold bugs have their hearts set on happening. That requires the momentum-based crowd which chases prices higher due to chart signals and could care less about what any perceived “value” area might be for gold, or for that matter, any other market that they ply their computers in.
Take a look at two different charts indicating the lackluster Western-based demand for the metal at the current time.
The first is the chart we regular feature here, namely, that of the reported gold holdings out of the largest gold ETF, GLD.
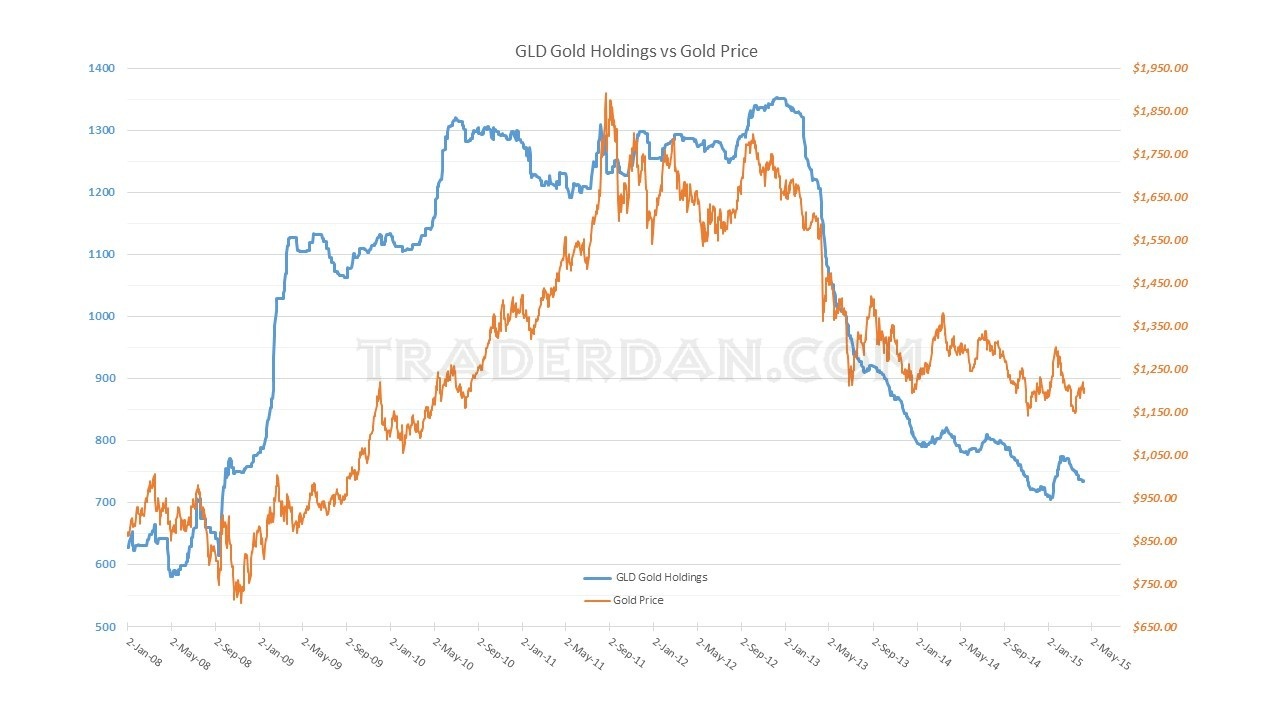
For the week, GLD lost 3 tons of gold dropping the total holdings down to 734 tons. Thus far this year, the ETF has added a mere 25 tons of gold, far off the torrid pace that looked as if it might mark a change in sentiment back in February when it had already managed to add a significant 64 tons. The bloom appears to already be off the rose as far as this investment vehicle is concerned.
Confirming this trend away from gold and into equities, especially European equities, is this most recent chart of the Commitment of Traders report. One can see the general decline from left to right of the line representing TOTAL OPEN INTEREST in gold futures.
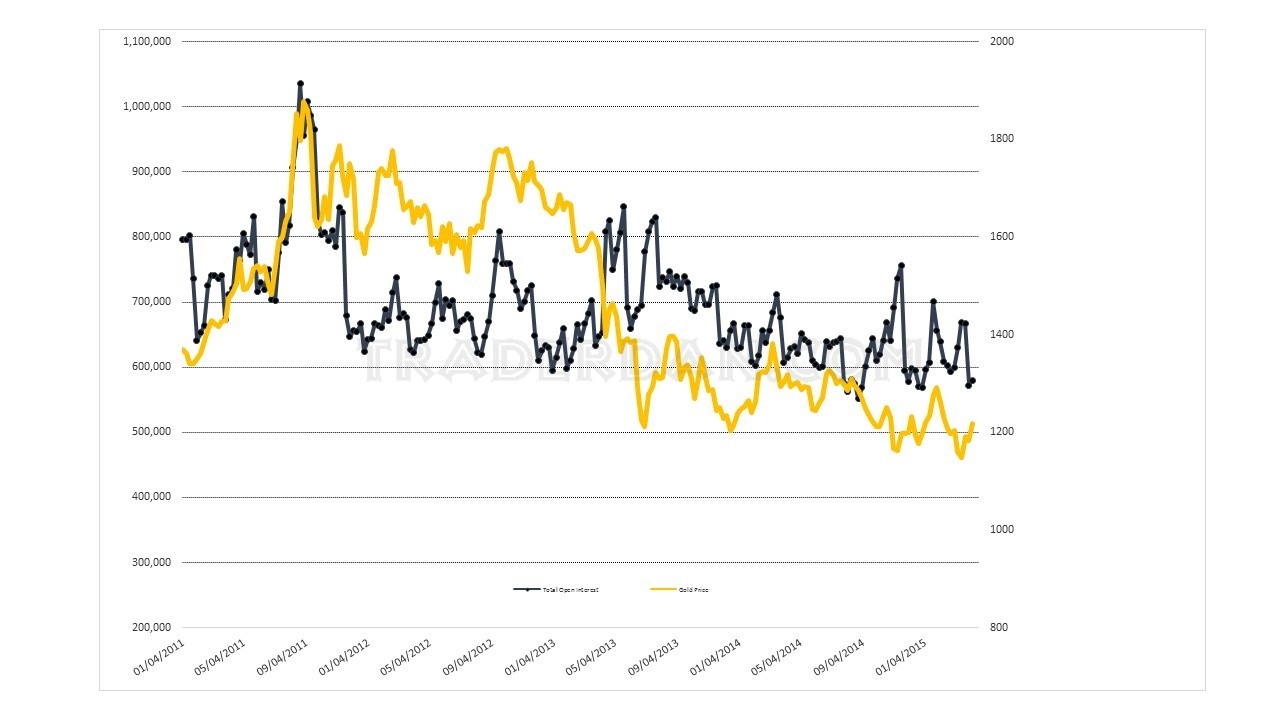
Notice how the gold price tends to rise and fall with each rise and fall in the total open interest line. This serves to illustrate my view that it is large speculative interests ( “open interest”) that drive our markets. Without that speculative interest in the market, there is no driver, no thrust to push prices significantly higher. Instead, what one gets is a grinding type of choppy, often random and meaningless, back and forth, up and down, sort of price action without any sort of clearly defined trend. In almost every case in which I see this pattern of lackluster speculative interest, the result is a gradual decline in price over time. We are currently seeing that exhibited in gold.
Look at the weekly price chart of the metal and you can see what I am referring to. This is the kind of price action that bores most trader half to death. The ADX line continues to decline revealing the lack of any clear trend while the RSI is stuck in no-man’s land, moving sideways in exactly the same fashion as does the price.
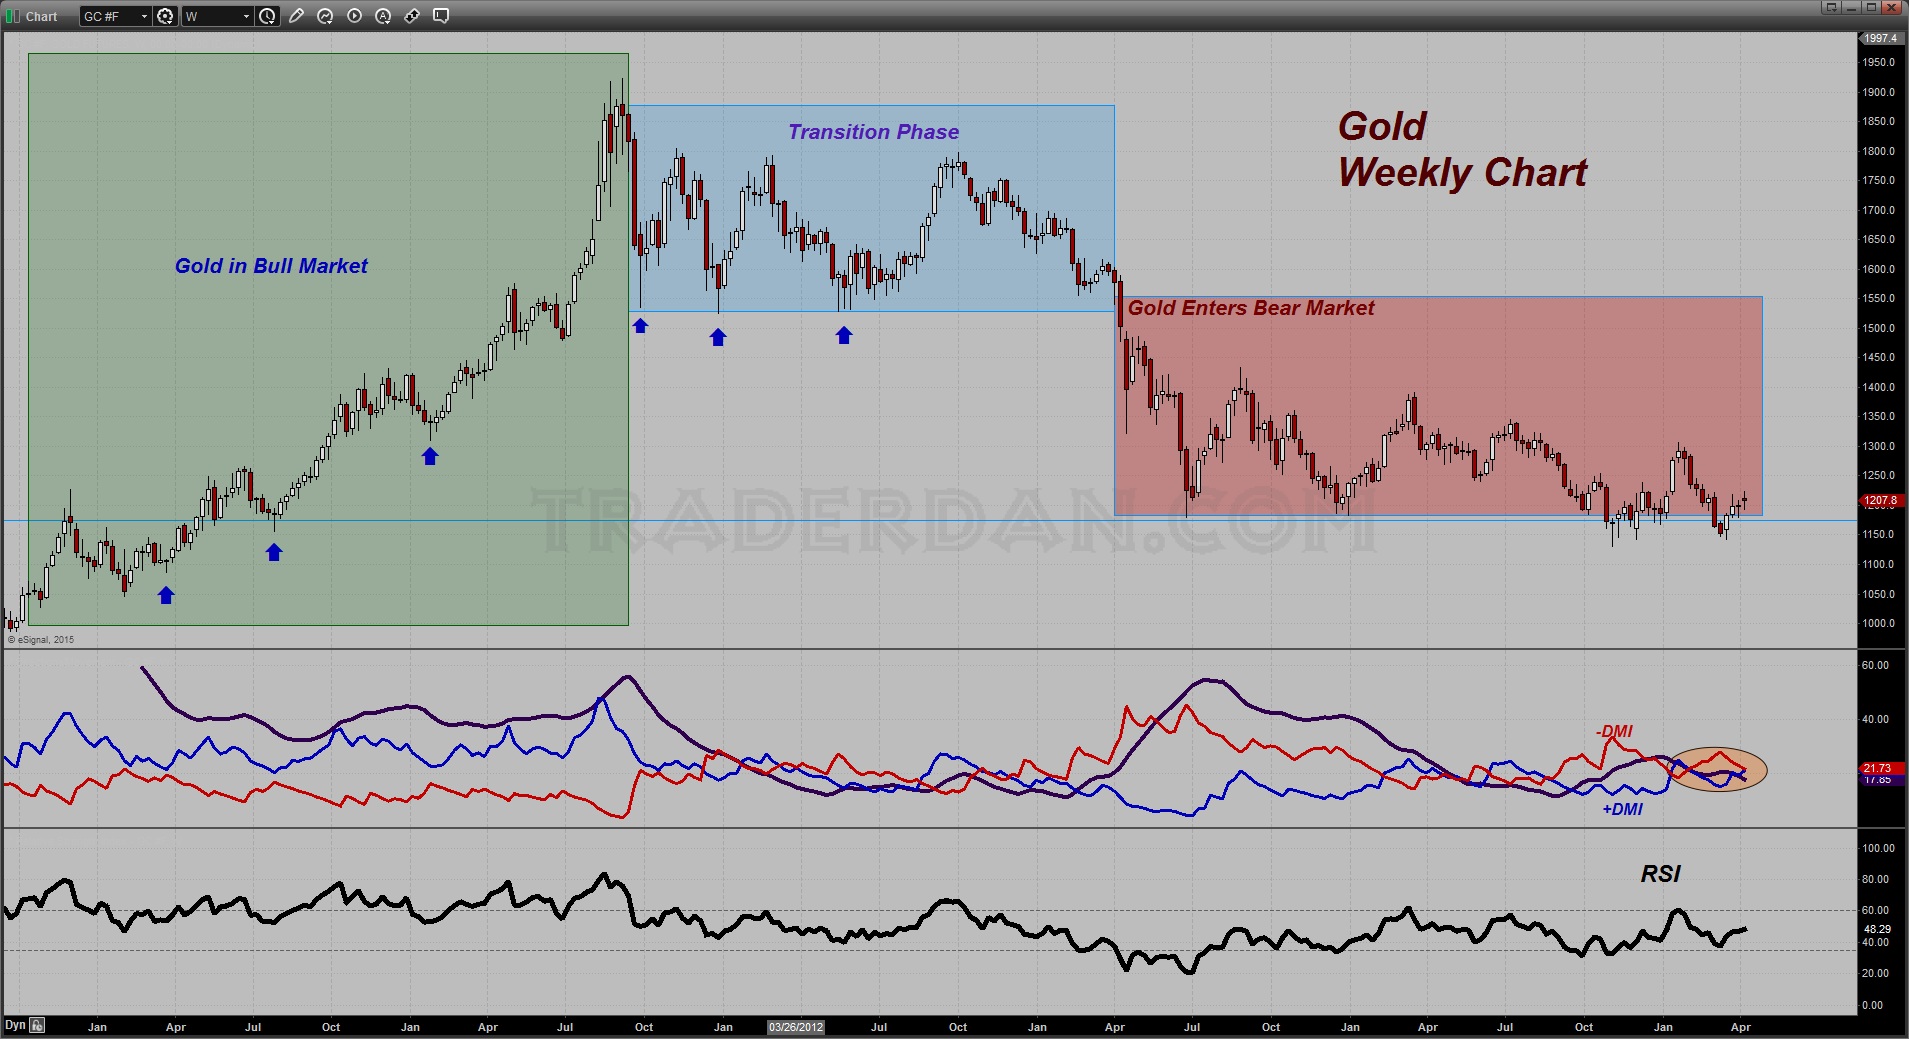
If you look more closely at the Directional Movement Indicator lines, you can see them crossing back and forth above each other as each side, the bulls or the bears, gains a temporary, but short-lived advantage over the other. Contrast that movement in the directional lines with their action during the strong trending phases.
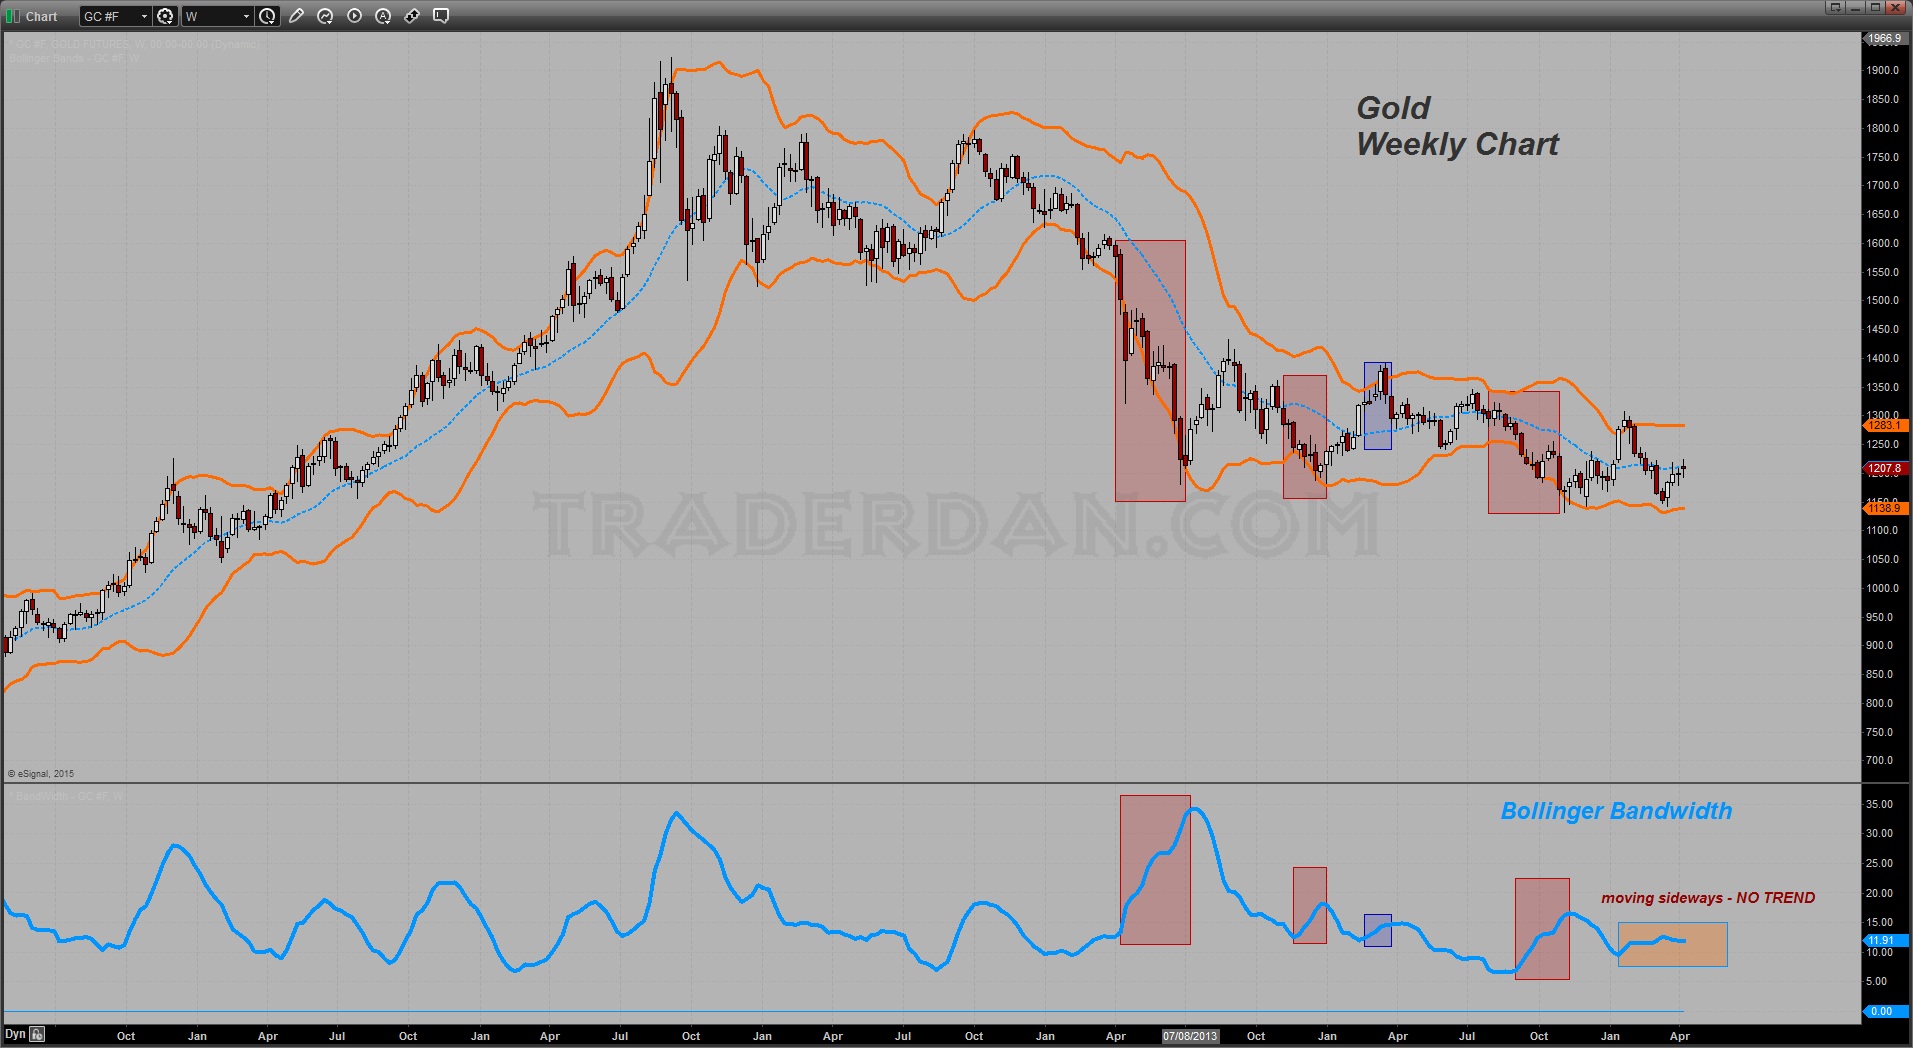
Taking a look at the same weekly chart but this time using the Bollinger Bands to get some insight into the price action one is struck by the relatively flatlining of the Bandwidth indicator for most of the year 2015 thus far. The bands are essentially moving parallel to each other which confirms the ADX reading. In other words, the market is going nowhere fast.
Bulls cannot get a single thing going to the upside of any duration while bears, able to forge a series of LOWER HIGHS, cannot seem to break it down below support which emerges near $1150. ( note – no doubt that support is due to buying out of India and China).

However, one thing to note- – since gold broke down in April of 2013 and entered its bear market, 3 out of 4 upward turns in the Bollinger Bandwidth indicator have all occurred during DOWNWARD TRENDING MOVES. Those are highlighted in red rectangles. There was one brief-lived move higher that turned the bandwidth indicator higher as well back in early 2014 when gold managed to mount an early year rally ( much as it did this year) before falling apart after hitting solid resistance at the $1400 level.
What this tells us is that moves higher in gold are short-lived and are COUNTER to the longer term trend currently in place which is DOWN. They have most recently tended to consist MAINLY of SHORT COVERING which then burns itself out rather quickly.
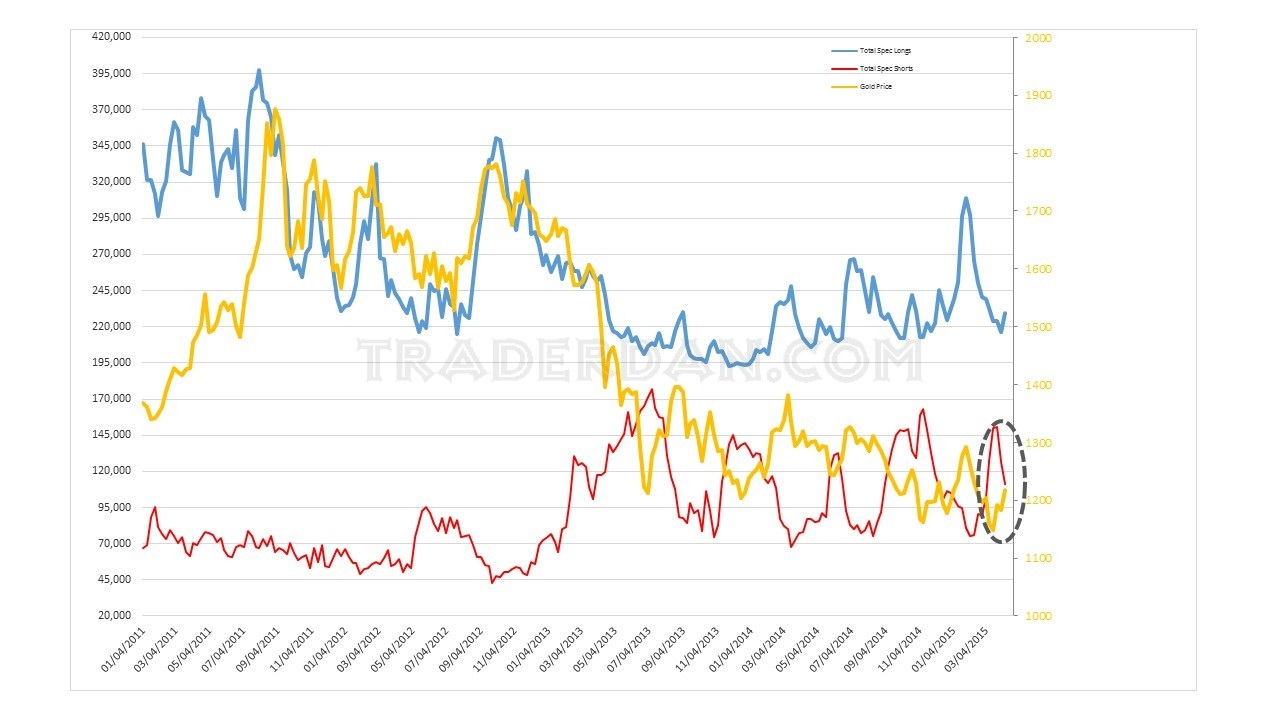
You can see this from this chart noting the total speculative long and short positions in gold (note – these are outright positions, not net positions). Look at the area within the ellipse on the chart and you can see the sharp drop in outright short positions among the speculators. Specs have covered a whopping 40K short positions over the last two reporting weeks with a corresponding $60 rise in the gold price. If you look at the number of speculative long positions higher up on the chart, you can see that it barely moved higher over that same time frame. Only 5000 new long positions have been added in the same speculative category!
********
Courtesy of Trader Dan http://traderdan.com/
More from Gold-Eagle


