What’s Up With Gold’s Decline?


In previous articles several months ago, we showed that gold was going to explode higher from a Bullish Cup and Handle pattern, from 1,269 toward 1,600ish. Most of that rise has occurred. This past week saw a sharp decline. Let’s explore why gold fell, and where gold is headed next.
Gold completed its small degree corrective wave 2-down move of a larger degree wave 3-up rising trend when it finished its Cup and Handle pattern on May 21st, 2019 at 1,269. Since then, small degree wave 3-up has catapulted gold nearly 300 points in three and a half months.
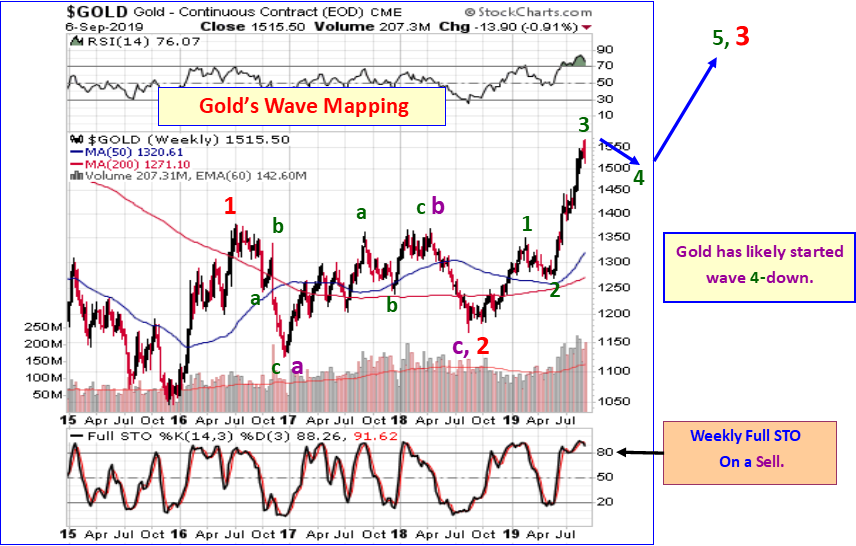
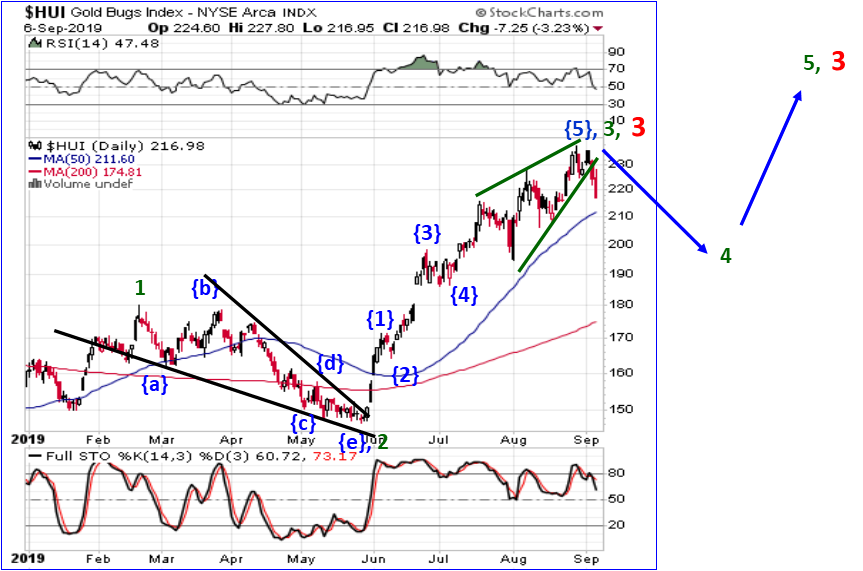
Gold exhausted that wave 3-up move, and this past week started wave 4 down, correcting the recent almost 25 percent rally.

Wave fives tend to be the most dramatic, the most impulsive moves for precious metals and Mining stocks, whereas for stocks, the most impulsive are wave threes. What this tells us is Gold Bugs have something to look forward to once wave 4-down completes. The next rally leg, 5-up of 3-up should be exciting.
We did get an early warning from our HUI Mining stock 10 day average Advance/Decline Line Indicator that wave 3-up was approaching its top.
This next chart is something we monitor regularly at www.technicalindicatorindex.com as it is terrific for giving early warnings of significant trend turns long before they happen. It compares the HUI price Index with its 10 day average Advance/Decline Line Indicator.
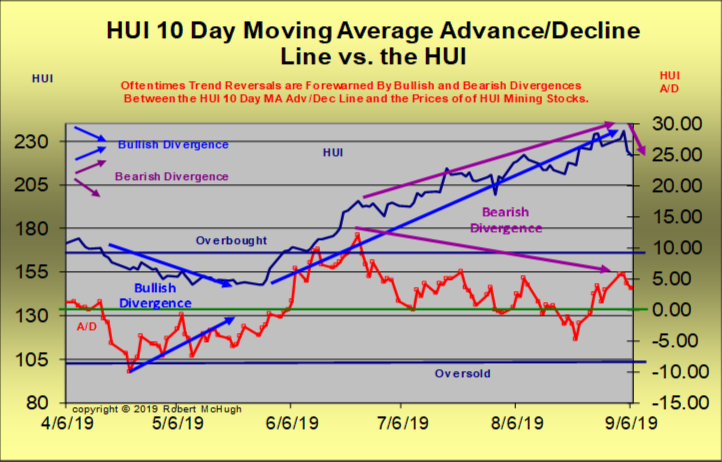
When the divergence gets wide, and has been growing for several weeks, we know a trend turn is approaching and we need to prepare for a reversal.
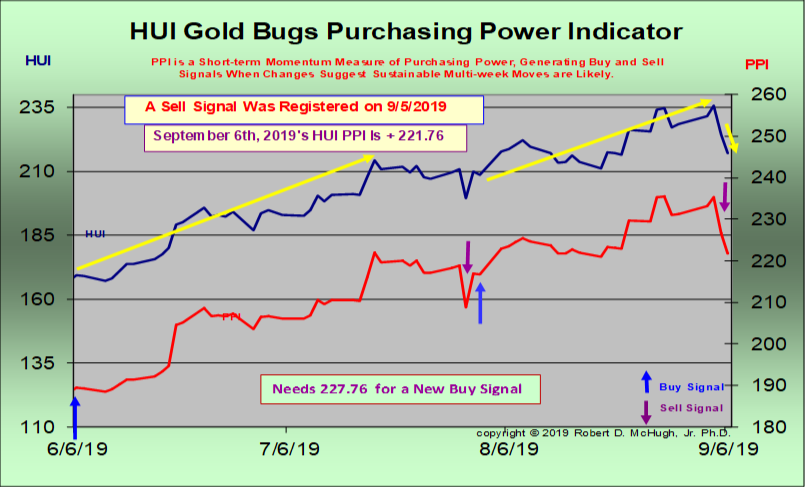
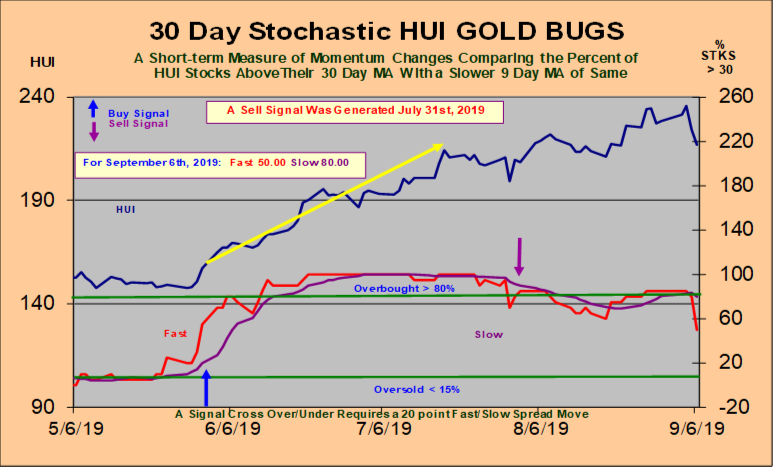
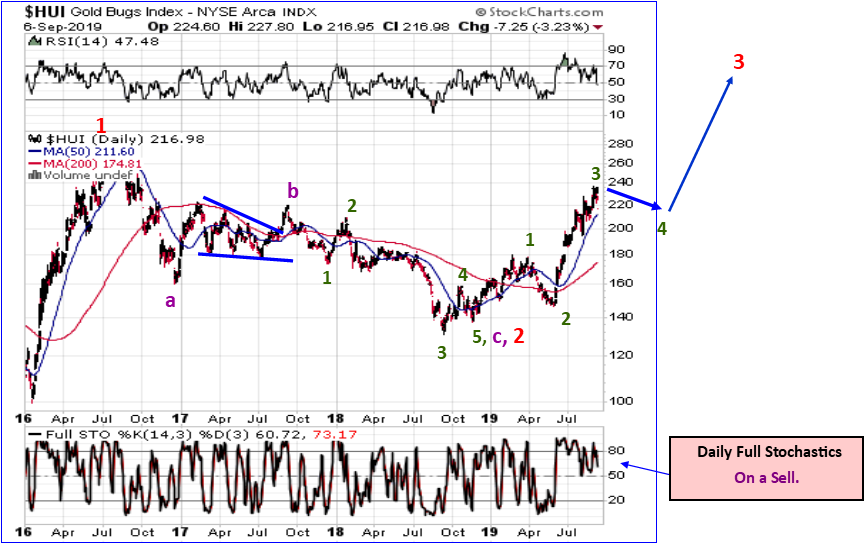
Confirmation that the reversal has occurred comes when we get new Sell signals in our HUI 30 day Stochastic and our HUI Purchasing Power Indicator. Below are charts for these indicators.
Our HUI key trend-finder indicators moved to a Sell signal Thursday, September 6th, as the HUI Purchasing Power Indicator joined the HUI 30 day Stochastic on a Sell signal, confirming the trend turn is legit.
Mining stocks and gold rose sharply after the previous Buy signal to both indicators on May 31st.
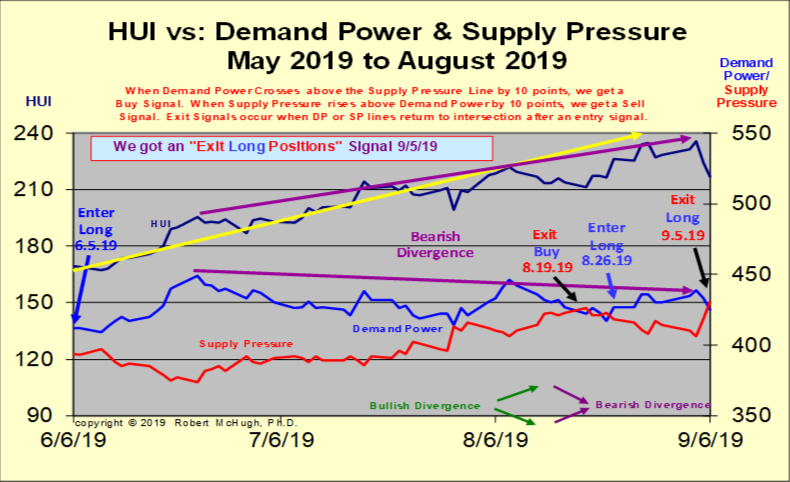
We also have an HUI Demand Power / Supply Pressure Indicator that is helpful in identifying when trend turns are approaching. When we see these measures converging, we get a heads up that a trend turn is not far off.
But we also monitor if Demand Power is diverging with HUI prices. A divergence gives us another early warning of a coming trend turn. Then, this indicator eventually confirms that the trend turn has started with signals to either exit a long position, or enter a short position after a lengthy rally phase. The reverse is true after declining trends.
As far as Mining stocks are concerned, they also are tracking a similar Elliott Wave mapping scenario as gold is, which is often the case. Mining stocks are now starting their subwave 4-down correction of the recent sharp wave 3-up rise. Once complete, a powerful wave 5-up of 3-up will follow. We will be watching for early warnings from the above key indicators to be prepared to take full advantage of this future wave 5-up rally, which should be powerful.
At McHugh’s www.technicalindicatorindex.com we have developed several proprietary indicators that help us identify when the next significant move is starting for Mining stocks, and in which direction the move will develop, which are also helpful to forecast moves in gold and Silver. We publish these indicators in every Daily Newsletter to subscribers.
*********


