What Does The FED Mean By “Transitory Inflation” And Why Is It Important To Understand?


As the markets react to the somewhat shocking CPI and Inflation data while Q2:2021 earnings continue to roll across the news wires, we wanted to take a minute to explore the recent Fed comments related to “Transitory Inflation” and what that really means.
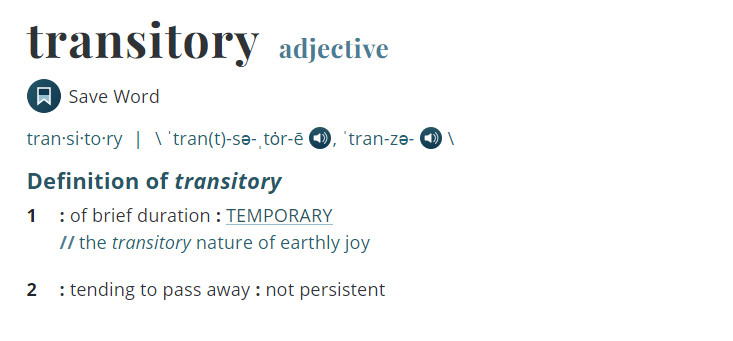
For those of you not familiar with the word ‘transitory’ (in conjunction with inflation) according to the Merriam-Webster Dictionary, Transitory means:
The Covid-19 Cycle Phase Setup
The COVID-19 market collapse happened at a time when the general US stock market was continuing to transition into stronger upward price trending and where consumers were engaging in the economy at fairly strong levels. Initial Jobless Claims in November and December 2019 averaged near 221k per week. Real Consumer Spending averaged more than 2.80% throughout all of 2019. The Consumer Price Index (a measure of price inflation) averaged only 0.18% throughout all of 2019. One could say jobs were strong, consumers were spending moderately robustly and inflation concerns were relatively mild or non-existent.
All of that changed in 2020 as news of the COVID-19 virus started spreading across the globe. By mid-February, we were starting to see COVID cases through many areas of the world with little information about how dangerous this virus was or what types of risks we were facing.
Sign up for my free trading newsletter so you don’t miss the next opportunity!
President Trump, and other world leaders, acted to try to stop the spread of the virus first by shutting down international travel to and from some countries. Next, the States started locking down business and other aspects of society and suddenly, weekly jobless claims jumped to more than 3 million by March 26, 2020, alone. By the following week, the jobless claims jumped to over 6.6 million. Real Consumer Spending dropped from +1.8 in January 2020 to -34.6 in June 2020. CPI stayed relatively flat for the first 5+ months of the COVID virus event. This suggests that inflation was not a real concern at that time.
By April 2020, the US Government and many foreign nations had a real problem on their hands. A spreading COVID-19 virus, millions of people out of work, economies shutting down and a real lack of infrastructure to deal with this problem. The US Federal reserve and the US Congress jumped into help US citizens (and others) with the first round of stimulus and new Executive Orders to help prevent collateral damage to the most at-risk people. But the time these support systems start reaching Americans, the country had lost more than 40 million jobs and Real Consumer spending fell to -34.6%. From an Economist view, this spells real trouble. From a Month-over-Month or Year-over-Year perspective, it looks pretty dang ugly.
And that leads us to the reason why the US Federal Reserve is expecting Transitory Inflation over the next few months – it’s all in the cycle phases and what’s to come. What they are not telling you is that over the next 12+ months, we are likely to go through a series of highs and lows while the cycle phase reverts back to more normalized levels. We all need to get ready for the potential of some really big swings in the US major indexes, major sectors, asset values, and the global markets over the next 12 to 24+ months. We are not even close to the end of this new cycle rotation at this stage.
Cycle Components: Amplitude And Wavelength
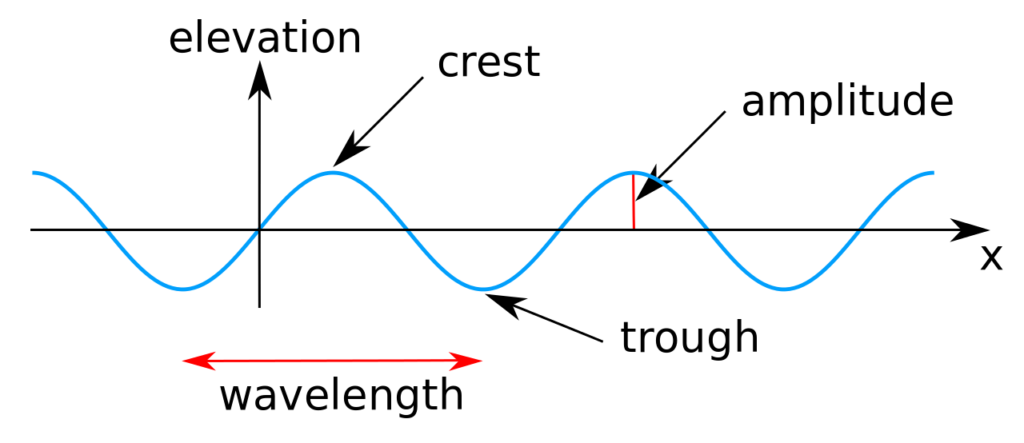
All Sine Waves function on two core components, Amplitude and Wavelength. Amplitude is measured as the crest or trough value furthest away from a centerline. Wavelength is measured by the amount of time it takes for two consecutive crests or troughs to complete. Wavelength can also be considered as “time”.
Elevation is the total range measurement from trough to crest along the Amplitude scale.
A Dampening Sine Wave Structure – The Cause Of Transitory Inflation & Other Issues
The way I like to explain a Dampening Sine Wave Structure to people is to think of a very calm pond or small body of water and what happens on the surface when you toss in a fairly large rock. First, the rock impacts the surface and displaces the water creating a trough and the initial “impulse wave”. This disruption of the fluid dynamics of water then creates a Dampening Sine Wave process of reverting back to normal water levels/activity – such as we see in the example below.
The example, below, also aligns with the COVID market collapse and the subsequent recovery/reversion process that is likely to continue to play out over the next few months and years. Allow me to explain.
When COVID-19 disrupted the global economy, it was just like a big rock landing in a fairly small pond – it disrupted the normal economic activity by a fairly large degree. Then the US Federal Reserve and other Global Central Banks jumped in with liquidity and other efforts to attempt to minimize the damage to the global economy. In a way, this activity actually amplifies the Amplitude range of the subsequent cycle phases – not the initial downside cycle phase. It does this by over-leveraging and hyper-inflating certain sectors/assets with new/easy money policies.
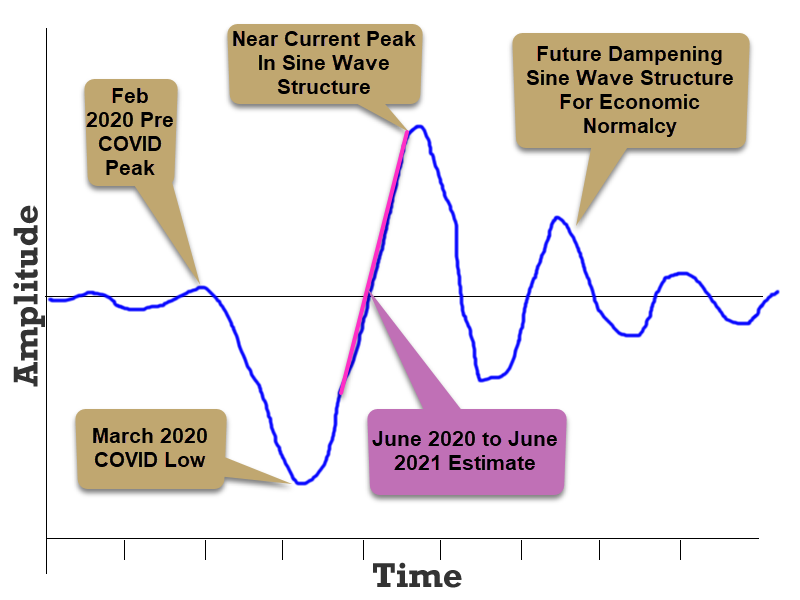
I believe the recovery from the March 2020 lows has been amplified by the continued efforts of the US Federal Reserve and Global Central Banks to prompt a very large recovery phase (upward crest), indicated on the chart below as “New Current Peak in Sine Wave Structure”.
After this crest peaks and rolls over, we’ll start a move that will likely attempt to bottom well below normal economic levels (possibly 10% to 20% below normalized historical levels) and may result in a deleveraging/price exploration event that many traders/investors are not prepared for. In fact, over the next few years, we may see multiple various forms of this repeating cycle phase continue to roil the markets until we settle back into more normalized market trending.
So, by definition, I believe the Transitory Inflation suggestion by the US Federal Reserve relates to these Dampening Sine Wave cycle phases (above) and is why traders may not be prepared for what the Federal Reserve expects.
If I’m right, the US Federal Reserve and the Global Central Banks may still have quite a bit of work ahead to continue to navigate these cycle phases and the risks associated with each event cycle. We may watch asset values peak and revalue over and over again throughout the next 7+ years as these phases continue to play out. If another COVID variant hits the globe again, which may further amplify these cycle phases, we may start a new secondary Dampening Sine Wave cycle that will further complicate the recovery process going forward.
No matter how it plays out, these cycle phases suggest the markets are going to be full of big trends, various appreciation and depreciation phases, and the US Fed and Global Central Banks will be trying to navigate some very difficult times ahead. Traders and Investors should look forward to some incredible setups and trends over the next 2 to 5+ years and get ready for the current crest to peak before the end of 2021. Just like that first big climb of a roller-coaster – when you reach the peak, the real fun is just getting started.
Want to know how our BAN strategy is identifying and ranking various sectors and ETFs for the best possible opportunities for future profits? Please take a minute to learn about my BAN Trader Pro newsletter service and how it can help you identify and trade better sector setups. My team and I have built this strategy to help us identify the strongest and best trade setups in any market sector. Every day, we deliver these setups to our subscribers along with the BAN Trader Pro system trades. You owe it to yourself to see how simple it is to trade 30% to 40% of the time to generate incredible results.
From all my decades of experience, I can tell you that unless you have a solid foundation related to knowing when and where opportunities exist in market trends, you are likely churning your money in and out of failed trades. I will be presenting the second of my two favorite strategies at the July Wealth365 Summit on July 16th at 12 pm. The Summit is free to attend and offers unparalleled opportunities for learning…plus a potential prize or two!
Have a great day!
Chris Vermeulen
Chief Market Strategist
www.TheTechnicalTraders.com
********

Chris Vermeulen has been involved in the markets since 1997 and is the founder of Technical Traders Ltd. He is an internationally recognized technical analyst, trader, and is the author of the book: 7 Steps to Win With Logic
Through years of research, trading and helping individual traders around the world. He learned that many traders have great trading ideas, but they lack one thing, they struggle to execute trades in a systematic way for consistent results. Chris helps educate traders with a three-hour video course that can change your trading results for the better.
His mission is to help his clients boost their trading performance while reducing market exposure and portfolio volatility.
He is a regular speaker on HoweStreet.com, and the FinancialSurvivorNetwork radio shows. Chris was also featured on the cover of AmalgaTrader Magazine, and contributes articles to several financial hubs like MoneyShow.com.


