What The Strong Dollar Does To Yellow & Black Gold…And Why We’re Seeing Green


The United States is doing better than it has in years. Jobs growth is up, unemployment is down, our manufacturing sector carries the rest of the world on its shoulders like a wounded soldier and the World Economic Forum named the U.S. the third-most competitive nation, our highest ranking since before the recession.
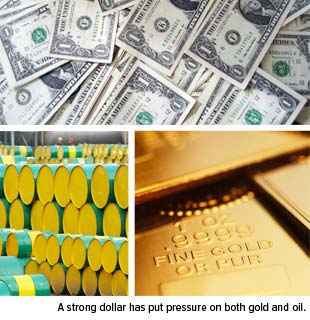
As heretical as it sounds, there’s a downside to America’s success, and that’s a stronger dollar. Although our currency has softened recently, it has put pressure on two commodities that we consider our lifeblood at U.S. Global Investors: gold and oil.
 It’s worth noting that we’ve been here before. In October 2011, a similar correction occurred in energy, commodities and resources stocks based on European and Chinese growth fears. But international economic stimulus measures helped raise market confidence, and many of the companies we now own within these sectors benefited. Between October 2011 and January 2012, Anadarko Petroleum rose 58 percent; Canadian Natural Resources, 20 percent; Devon Energy, 15 percent; Cimarex Energy, 15 percent; Peyto Exploration & Development, 15 percent; and Suncor Energy, 10 percent.
Granted, we face new challenges this year that have caused market jitters—Ebola and ISIS, just to name a couple. But we’re confident that once the dollar begins to revert back to the mean, a rally in energy and resources stocks might soon follow. Brian Hicks, portfolio manager of our Global Resources Fund (PSPFX), notes that he’s been nibbling on cheap stocks ahead of a potential rally, one that, he hopes, mimics what we saw in late 2011 and early 2012.
A repeat of last year’s abnormally frigid winter, though unpleasant, might help heat up some of the sectors and companies that have underperformed lately.
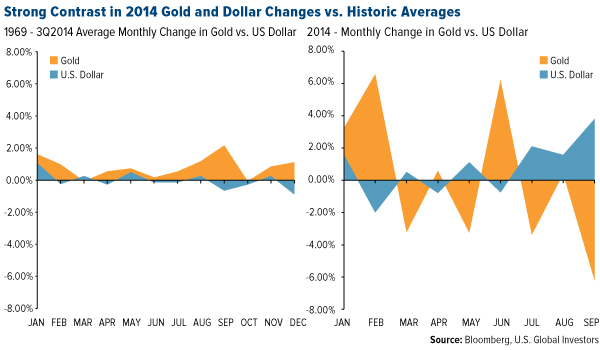
September Was the Cruelest Month
On the left side of the chart below, you can see 45 years’ worth of data that show fairly subdued fluctuations in gold prices in relation to the dollar. On the right side, by contrast, you can see that the strong dollar pushed bullion prices down 6 percent in September, historically gold’s strongest month. This move is unusual also because gold has had a monthly standard deviation of ±5.5 percent based on the last 10 years’ worth of data.
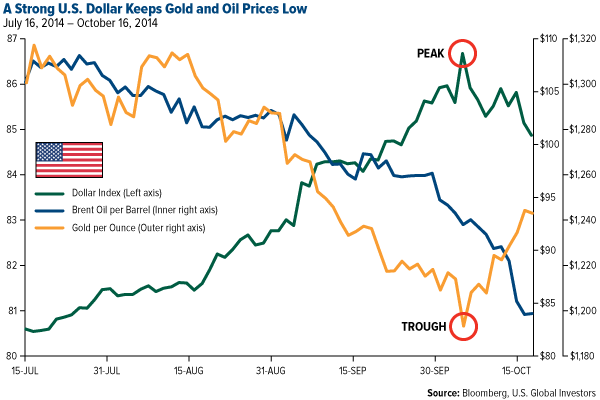
Here’s another way of looking at it. On October 3, bullion fell below $1,200 to prices we haven’t seen since 2010, but they quickly rebounded to the $1,240 range as the dollar index receded from its peak the same day.
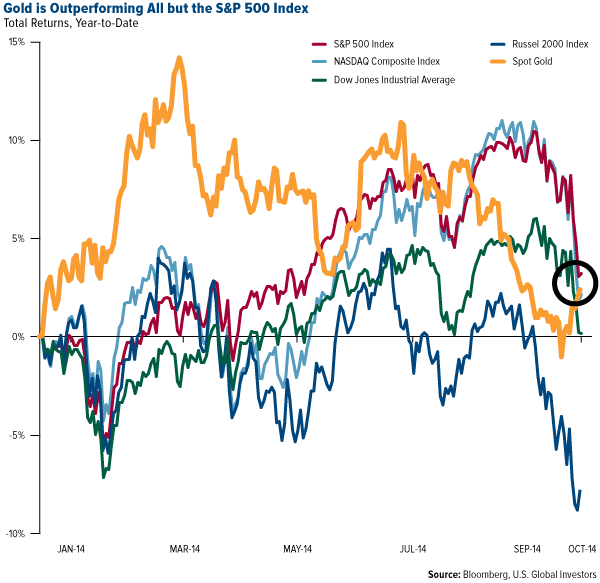
There’s no need to worry just yet. This isn’t 2013, when the metal gave back 28 percent. And despite the correction, would it surprise you to learn that gold has actually outperformed several of the major stock indices this year?
As for gold stocks, there’s no denying the facts: With few exceptions, they’ve been taken to the woodshed. September was demonstrably cruel. Based on the last five years’ worth of data, the NYSE Arca Gold BUGS Index has had a monthly standard deviation of ±9.4, but last month it plunged 20 percent. We haven’t seen such a one-month dip since April 2013. This volatility exemplifies why we always advocate for no more than a 10 percent combined allocation to gold and gold stocks in investor portfolios.
Oil’s slump is a little more complicated to explain.
Since the end of World War II, black gold has been priced in U.S. greenbacks. This means that when our currency fluctuates as dramatically as it has recently, it affects every other nation’s consumption of crude. Oil, then, has become much more expensive lately for the slowing European and Asian markets. Weaker purchasing power equals less overseas oil demand equals even lower prices.
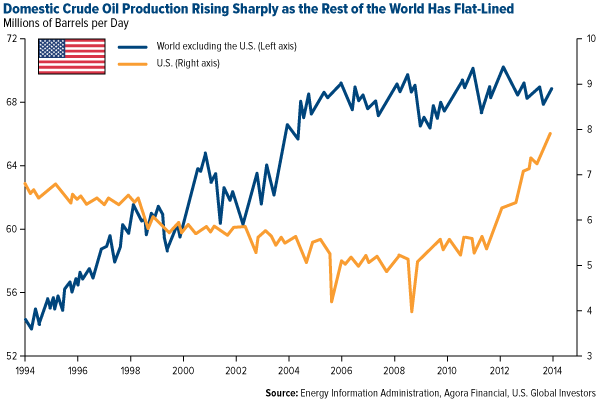
What some people are calling the American energy renaissance has also led to lower oil prices. Spurred by more efficient extraction techniques such as fracking, the U.S. has been producing over 8.5 million barrels a day, the highest domestic production level since 1986. We’re awash in the stuff, with supply outpacing demand. Whereas the rest of the world has flat-lined in terms of oil production, the U.S. has zoomed to 30-year highs.
In a way, American shale oil has become a victim of its own success.
At the end of next month, members of the Organization of the Petroleum Exporting Countries (OPEC) are scheduled to meet in Vienna. As Brian speculated during our most recent webcast, it would be surprising if we didn’t see another production cut. With Brent oil for November delivery at $83 a barrel—a four-year low—many oil-rich countries, including Iran, Iraq and Venezuela and Saudi Arabia, will have a hard time balancing their books. Venezuela, in fact, has been clamoring for an emergency meeting ahead of November to make a plea for production cuts.
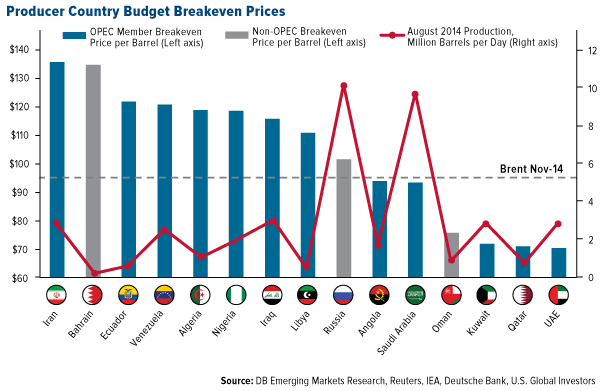
Although not an OPEC member, Russia, once the world’s largest producer of crude, is being squeezed by plunging oil prices on the left, international sanctions on the right. This might prompt President Vladimir Putin to scale back the country’s presence in Ukraine and delay a multibillion-dollar revamp of its armed forces. When the upgrade was approved in 2011, GDP growth was expected to hold at 6 percent. But now as a result of the sanctions and dropping oil prices, Russia faces a dismally flat 0.5 percent.
Volatility Has Returned
The current all-in sustaining cost to produce one ounce of gold is hovering between $1,000 and $1,200. With the price of bullion where it is, many miners can barely break even. Production has been down 10 percent because it’s become costlier to excavate. As I told Kitco News’ Daniela Cambone, we will probably start seeing supply shrinkage in North and South America and Africa.
The same could happen to oil production. Extraction of shale oil here in the U.S. costs companies between $50 and $100 a barrel, with producers able to break even at around $80 to $85. If prices slide even further, drillers might be forced to trim their capital budgets or even shelve new projects.
Michael Levi of the Council on Foreign Relations told NPR’s Audie Cornish that a decrease in drilling could hurt certain commodities:
“[I]f prices fall far enough for long enough, you’ll see a pullback in drilling. And shale drilling uses a lot of manufactured goods—20 percent of what people spend on a well is steel, 10 percent is cement, so less drilling means less manufacturing in those sectors.”
At the same time, Levi places oil prices in a long-term context, reminding listeners that we’ve become accustomed to unusually high prices for the last three years.
“People were starting to believe that this was permanent, and they were wrong,” he said. “So the big news is that volatility is back.”
On this note, be sure to visit our interactive and perennially popular Periodic Table of Commodities, which you can modify to view gold and oil’s performance going back ten years.
A Penny Saved Is a Billion Dollars To Spend and Invest
With fresh volatility in oil production comes the fear that the most price-sensitive states will be hurt the most. Exceptionally vulnerable states include Oklahoma, Wyoming and North Dakota. Texas, the nation’s leading oil producer—one of the world’s top producers, in fact—is diversified well enough to not feel the pain as much.
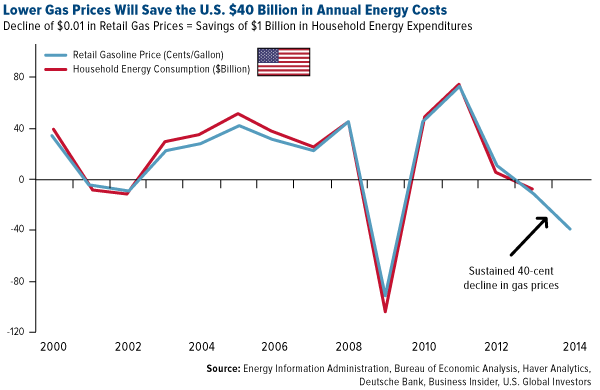
What’s bad for oil producers, though, turns out to be good for American consumers, who are already benefiting from lower gasoline prices. As of this writing, the national average for a gallon of gas is $3.10, down from $3.35 a year ago, according to AAA’s Daily Fuel Gauge Report.
As a result, American consumers are looking at huge savings—$40 billion this year alone. According to Deutsche Bank’s Joe LaVogna, every penny that’s saved at the pump equates to a billion dollars in household energy consumption that can be put back into the economy in other ways.
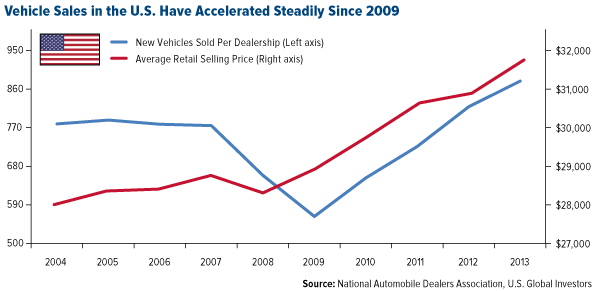
I like to think of this as an unexpected and very welcome tax break. Automobile sales are already up from 2009. Lower gas prices might encourage some families to spring for that Suburban instead of a Prius.
Klondex Turning Heads and Profits
As I said earlier, gold stocks have been hurting lately. One mining company that’s managed to not only survive in this uncertain climate but actually thrive is Klondex Mines, our largest holding in both our Gold and Precious Metals Fund (USERX) and World Precious Minerals Fund (UNWPX), with additional exposure in our Global Resources Fund (PSPFX). Headquartered in Vancouver, Klondex has complete ownership and control of the Fire Creek Project and Midas Mine, both in Nevada.
The chart below, based on our own research, shows Klondex’s relative strength to its peers and why we find the company so attractive in the long term. The y-axis indicates profit margin, the x-axis, enterprise value. The size of the spheres represents the amount of revenue generated by each one of these companies in the second quarter of 2014, Klondex’s first quarter of full commercial production.
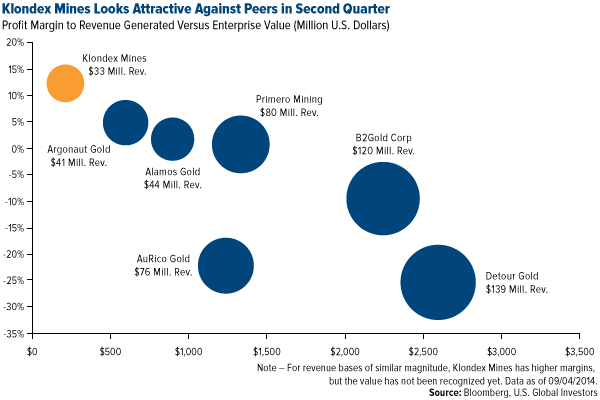
What the chart conveys is that, in relation to its peers, Klondex has a significantly higher profit margin than companies with a market cap two to three times its size.
“This is going to be very positive for Klondex shareholders as we go into the year-end,” portfolio manager Ralph Aldis said during our webcast. “The third quarter should be another great quarter, and that’s when people will say, ‘Hey, that second quarter report wasn’t a fluke.’ They’re going to start buying the stock and get it moving.”
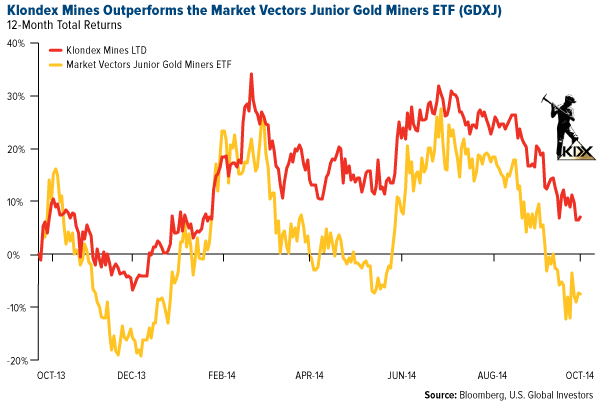
Indeed, Klondex has managed to stay above the Market Vectors Junior Gold Miners ETF for the 12-month period, delivering a positive return of 7 percent versus the index’s -7.5 percent.
On numerous occasions I’ve written about our research on the typical lifecycle of a mine, most recently in my whitepaper “Managing Expectations: Anticipate Before You Participate in the Market.” Below you can see the relationship between a mine’s lifecycle and the company’s share price.
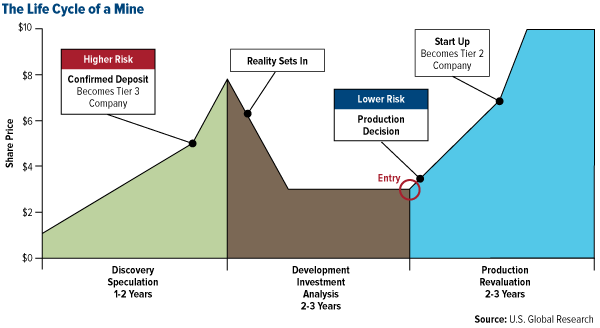
As experts in mining stocks, it’s imperative for us to know which production stage the mine is in to manage our exposure to the company.
In the case of Klondex, its price action mimics the movements in share price based on the chart above, confirming our research.
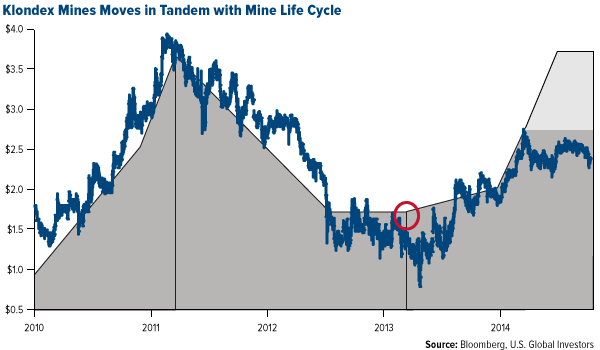
It also supports the benefits of active management.
“When you buy an indexed fund, you’re basically just buying the market capitalization of those companies,” Ralph said. “You’re not getting the benefit of active management where we go out, meet the company’s management team and know its history. We’re familiar with the lifecycle of the mine in question, the money, the burn rate and the minerals the company is involved in.”
I couldn’t have said it better myself.
Speaking of Active Management…
Last week I expressed my concerns disapproval of how the European Union is handling (or not handling) its fiscal and monetary mess. Because the EU is such an important region for the global economy, investors have become impatient with the bickering that’s stalled any clear solution to its slowdown.
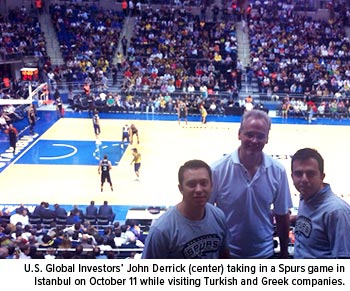 Last week I was in Italy meeting with other global business leaders, while U.S. Global’s Director of Research John Derrick was visiting and assessing Greek and Turkish companies such as Tsakos Energy Navigation, JUMBO, Türk Telekom and Turkcell.
Watch for our firsthand accounts of and insights on the European situation this week.
Please consider carefully a fund’s investment objectives, risks, charges and expenses. For this and other important information, obtain a fund prospectus by visiting www.usfunds.com or by calling 1-800-US-FUNDS (1-800-873-8637). Read it carefully before investing. Distributed by U.S. Global Brokerage, Inc.
Foreign and emerging market investing involves special risks such as currency fluctuation and less public disclosure, as well as economic and political risk. Gold, precious metals, and precious minerals funds may be susceptible to adverse economic, political or regulatory developments due to concentrating in a single theme. The prices of gold, precious metals, and precious minerals are subject to substantial price fluctuations over short periods of time and may be affected by unpredicted international monetary and political policies. We suggest investing no more than 5% to 10% of your portfolio in these sectors. Because the Global Resources Fund concentrates its investments in specific industries, the fund may be subject to greater risks and fluctuations than a portfolio representing a broader range of industries.
The S&P 500 Stock Index is a widely recognized capitalization-weighted index of 500 common stock prices in U.S. companies. The Nasdaq Composite Index is a capitalization-weighted index of all Nasdaq National Market and SmallCap stocks. The Dow Jones Industrial Average is a price-weighted average of 30 blue chip stocks that are generally leaders in their industry. The Russell 2000 Index is a U.S. equity index measuring the performance of the 2,000 smallest companies in the Russell 3000. The Russell 3000 Index consists of the 3,000 largest U.S. companies as determined by total market capitalization. The Market Vectors Junior Gold Miners Index is a market-capitalization-weighted index. It covers the largest and most liquid companies that derive at least 50 percent from gold or silver mining or have properties to do so. The NYSE Arca Gold BUGS (Basket of Unhedged Gold Stocks) Index (HUI) is a modified equal dollar weighted index of companies involved in gold mining. The HUI Index was designed to provide significant exposure to near term movements in gold prices by including companies that do not hedge their gold production beyond 1.5 years.
Fund portfolios are actively managed, and holdings may change daily. Holdings are reported as of the most recent quarter-end. Holdings in the funds mentioned as a percentage of net assets as of 09/04/2014: Alamos Gold, Inc. (0.04% World Precious Minerals Fund); Anadarko Petroleum Corp. (2.11% Global Resources Fund); Argonaut Gold (0.00%); AuRico Gold, Inc. (1.85% in Gold and Precious Metals Fund, 0.41% World Precious Minerals Fund); B2Gold Corp. (0.00%); Canadian Natural Resources, Ltd. (1.59% Global Resources Fund); Cimarex Energy Co. (1.80% Global Resources Fund); Detour Gold Corp. (0.00%); Deutsche Bank (0.00%); Devon Energy Corp. (1.82% Global Resources Fund); JUMBO S.A. (0.00%); Klondex Mines, Ltd. (7.76% Gold and Precious Metals Fund, 7.51% World Precious Minerals Fund, 1.22% Global Resources Fund); Market Vectors Junior Gold Miners ETF (0.16% Gold and Precious Metals Fund, 0.17% World Precious Minerals Fund); Peyto Exploration & Development Corp. (1.31% Global Resources Fund); Primero Mining Corp. (0.05% Gold and Precious Metals Fund, 0.02% World Precious Minerals Fund); Suncor Energy, Inc. (2.13% Global Resources Fund); Tsakos Energy Navigation, Ltd. (0.00%); Türk Telekom (0.00%); Turkcell İletişim Hizmetleri A.Ş. (0.00%).
The Consumer Price Index (CPI) is one of the most widely recognized price measures for tracking the price of a market basket of goods and services purchased by individuals. The weights of components are based on consumer spending patterns.
Standard deviation is a measure of the dispersion of a set of data from its mean. The more spread apart the data, the higher the deviation. Standard deviation is also known as historical volatility.
********
All opinions expressed and data provided are subject to change without notice. Some of these opinions may not be appropriate to every investor. By clicking the link(s) above, you will be directed to a third-party website(s). U.S. Global Investors does not endorse all information supplied by this/these website(s) and is not responsible for its/their content. Past performance does not guarantee future results.
 Frank Holmes is the CEO and Chief Investment Officer of U.S. Global Investors. Mr. Holmes purchased a controlling interest in U.S. Global Investors in 1989 and became the firm’s chief investment officer in 1999. Under his guidance, the company’s funds have received numerous awards and honors including more than two dozen Lipper Fund Awards and certificates. In 2006, Mr. Holmes was selected mining fund manager of the year by the Mining Journal. He is also the co-author of “The Goldwatcher: Demystifying Gold Investing.” Mr. Holmes is engaged in a number of international philanthropies. He is a member of the President’s Circle and on the investment committee of the International Crisis Group, which works to resolve conflict around the world. He is also an advisor to the William J. Clinton Foundation on sustainable development in countries with resource-based economies. Mr. Holmes is a native of Toronto and is a graduate of the University of Western Ontario with a bachelor’s degree in economics. He is a former president and chairman of the Toronto Society of the Investment Dealers Association. Mr. Holmes is a much-sought-after keynote speaker at national and international investment conferences. He is also a regular commentator on the financial television networks CNBC, Bloomberg and Fox Business, and has been profiled by Fortune, Barron’s, The Financial Times and other publications. Visit the U.S. Global Investors website at http://www.usfunds.com. You can contact Frank at: [email protected].


