What A Week In The Markets!


This week ended with the Mr Bear tipping over the portfolio valuation of professional money managers, and individual investors, alike. He's after garbage, and there is no shortage of that in the world's financial markets. But don't blame him for the decline of gold and silver. The corrupt ways of central bankers and government regulators are responsible for that. It's now official "policy" that when financial assets are under pressure, so too must gold, silver and precious metals miners.
Why would government officials do something like that? Because so much rests on the stock and bond markets remaining a viable asset class, if not in fact, then in the eyes of a gullible, and aging public that staked their future retirement with investments in paper assets. Rising gold and silver prices during a time of deflating financial assets would at some point cause trillions-of-dollars currently held in stocks and bonds to shift into precious metals and real assets. The social-economic effects of this rebalancing of assets will be horrendous, as financial assets currently held in the public's IRAs and 401k plans begin to deflate back to prices not seen since the 1970s, with the proceeds payable in worthless federal-reserve notes. Need I say that gold and silver will increase in price far beyond most "experts" expectations in the coming flight-for-life from financial assets?
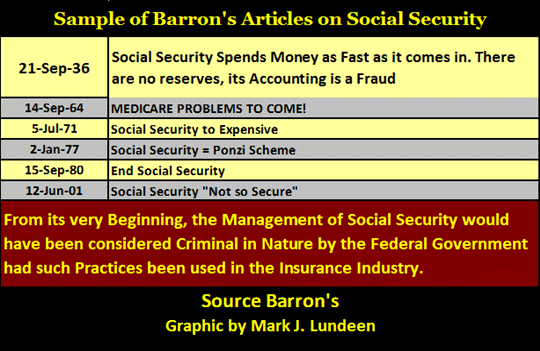
"Social Security" is the depression era oxymoron that Washington has continually plundered since President Johnson first embezzled funds from it to finance his "Great Society" in the 1960s. In the 1970s, the "policy makers" legislated into existence tax-deferred retirement accounts to cover up the well-known shortfalls in the Social Security System. In fact, doubts of the long term viability of Social Security, and Medicare can be found in Barron's magazine as far back as 1936. The table below contains only a few of the Barron's articles of Washington's fraud, waste and abuse of the public's trust with Social Security.
The theory was, even if Washington was robbing the taxpayers blind, certainly Wall Street's government-regulated markets would not. Well, that was the theory, and it sounded pretty good until January 2000, when Doctor Greenspan's high-tech bubble popped. Since then, the "best and the brightest" in high finance and social engineering have compounded their inflationary errors with bubbles in housing, and now the bond markets.
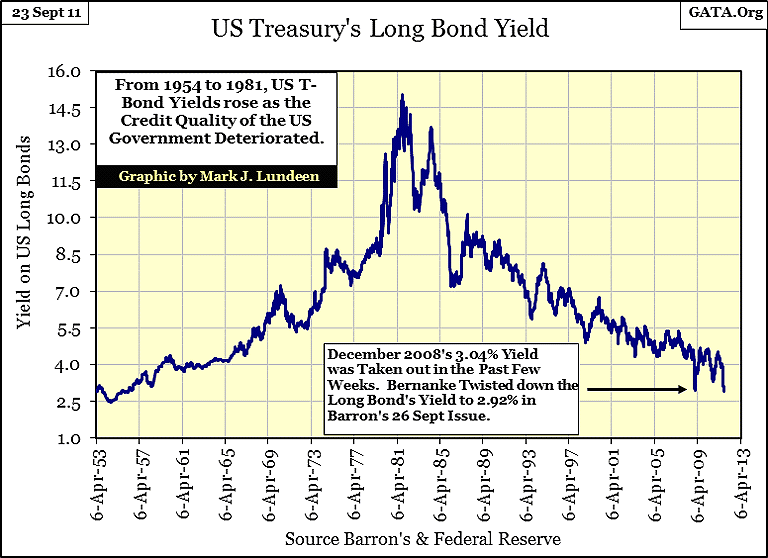
In the chart above, we see the December 2008, 3.04% yield was the result of panic during the credit crisis. But in September 2011, it took a cold-blooded mediocrity from Princeton to "twist" down long bond yields. Exactly what positive effects this "twisting" will have on financial markets no one really knows. The Fed pumps inflation into the economy - that's all they know how to do. So why not pump some "liquidity" into US Treasury long bonds as well and inflate the banking system's T-bond reserves? Yes, the loss of yield income will impose hardship on insurance companies, pension funds and retirees, but screw them, the Fed must serve its masters; the "policy makers" and their banking system. Flattening the yield curve will also squeeze the profitability out of the bankers' carry trade, (borrowing at the fed funds rate and buying treasury bonds to capture the spread), which is a little more puzzling. But the Fedknows that this squeeze is only temporary, and there is always TARP 2, if necessary, to bail out the too big to fail banks at the taxpayer's expense.
I see this "Operation Twist" as a short-term desperation measure by the Fed to raise money for their nefarious purposes, to perpetuate their Ponzi scheme for another day until there is blood running in the streets and the politicians are begging for QE3, which currently lacks sufficient political will.
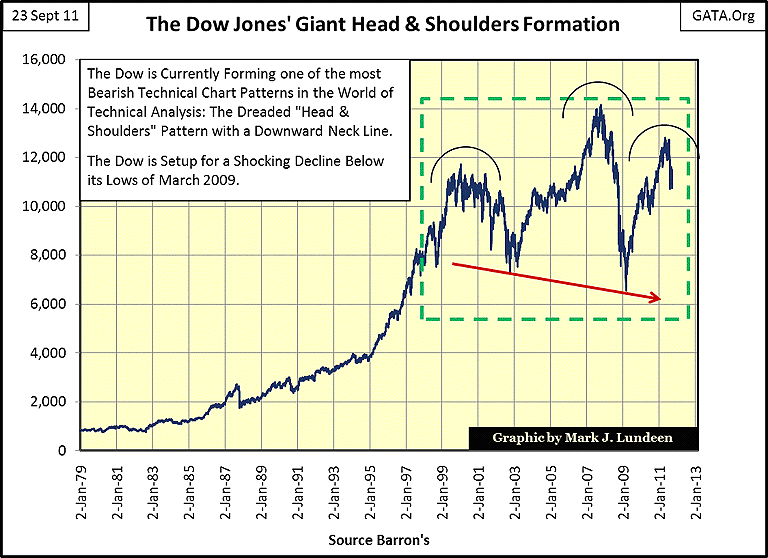
Here is the scariest chart, the one that turns the "policy makers'" blood cold. The Dow Jones' head-and-shoulders formation is about to see its right shoulder collapse down toward its neck line. Washington and Wall Street are willing to hazard every dollar of your life savings, plus turn a fire-hose of "liquidity" on Mr Bear to prevent that from happening!
But their best efforts will prove to be futile, because in a world drowning in unserviceable debt, more credit creation will only make the situation worse. One only has to observe the NYSE's 52Wk High- 52Wk Low ratio to see the stock market's prospects crumbling.
On Thursday this week, the NYSE 52Wk high - 52Wk low ratio saw its second down-spike in our current phase of the 2007-11 (2000-2011?) bear market. I saw this coming, but what exactly is "this"? Look at the dashed red box below enclosing the 2007-09 bear market for a clue of what is happening, and what is to come.
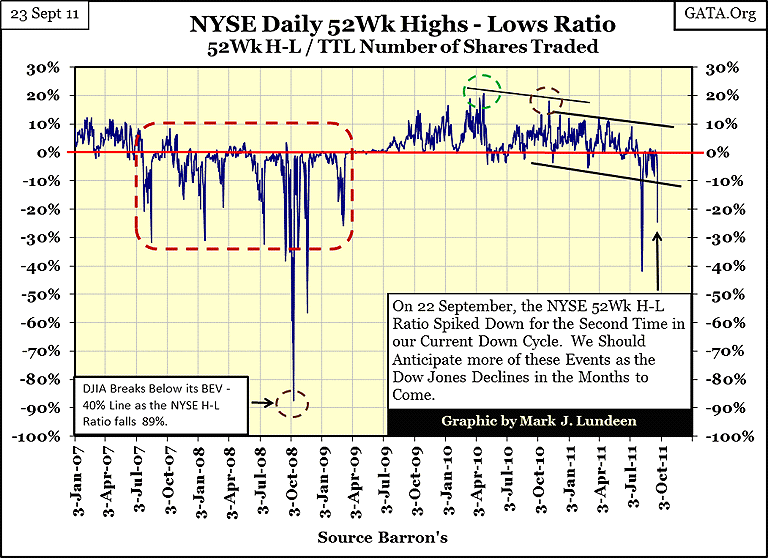
From January-July 2007, the NYSE 52Wk H-L Ratio was positive, but its peaks were losing their intensity as the ratio came ever nearer to flipping over to the dark side of the market. Strangely, this first 25%-down spike in 2007 (in the red box above) happened two months * BEFORE * the Dow's October 2007 last all-time high in the Dow Jones - how did that happen? No matter, it was the first of eight -25% down spikes that occurred during the next two years, during which the Dow Jones not only saw a new all-time high, but also descended to its second deepest bear bottom since 1885.
Well, all significant credit crises play havoc on the stock market's valuation, as investors discovered in 1929 as well as in 2008-09. The scary thing about our market is, unlike the hard bottom in July 1932 when the debt and credit excesses of the 1920s were purged from the financial system, none of the trillions-of-dollars worth of underlying junk mortgage assets or hundreds of trillions in derivatives from the 2007-2009's credit crisis were written off. Instead, long-trains pulled thousands of freight cars to the Federal Reserves' Level IV, "LIQUIDITY FACILITIES" in New York and Washington, where Wall Street's toxic waste was "MONETIZED" by skilled economists.

Doctor Bernanke then took this "LIQUIDITY" and "INJECTED" it back into the financial system to "RE-LIQUIFY" his banks. Yuck!
But let's return to the NYSE 52Wk H-L ratio above. In the red box, the ratio saw a few 25% down spikes long before the public, and the financial media understood that the stock market was sinking in quicksand. The third down spike in the red box occurred on 15 July 2008, with the Dow Jones only 23% below its October 2007 highs. My point is that the climatic bottom in March 2009 didn't just happen; the NYSE's breadth data gave ample warning, with multiple days of Extreme Breadth and Volatility. So far in the current phase of the bear market, the NYSE 52Wk H-L ratio has twice flipping over to the dark side, confirming that the smart money is exiting the stock market. If the historical trends in the 52Wk H-L ratio continues (and we should assume it will), we will see more and deeper down spikes in the ratio as more investors exit the stock market before the selling climax at the bottom of the bear market. That may be a long time, and many 52Wk ratio down spikes from now, as Mr Bear has no intension of leaving lower Manhattan until HE, not the "policy makers", is happy with the hygiene in the financial markets.
The severity of the coming declines in the stock market is evidenced by the fact that the global banking system's reserves are insolvent. Every day it's becoming more apparent that major banks in the US and Europe can no longer raise operating cash by selling their assets, like Greek debt, in the open market, and a failed secondary offering of shares would be a major embarrassment. Their doors stay open only as long as they receive ever larger "liquidity injections" from their central banks. But in 2011, unlike 2008, it's not just the United States that has a septic financial system; Europe's banking reserves too have become sewage.
The global financial system is in deep trouble, because skilled economists have been monetizing toxic waste for too many decades. Personally, I don't expect the lows of March 2009 to hold. If I'm correct, we cannot rule out the possibility of the Dow Jones exceeding its 89% declines of July 1932.
Let's take a look at exactly what it means when a stock, or in the case below, the Dow Jones, sees new 52Wk Highs or Lows. Over time, the Dow moves between its highs and lows of the past 52 weeks. 52Wk Highs and Lows are not fixed; they can be pushed by price movement, or changed (timed out) 52 weeks after they occur.
Below we see the Dow Jones, and its 52Wk Highs and Lows from 1920 - 40. Note how during the 1920s, the Dow Jones was pushing its 52Wk Highs upward, as its 52Wk Lows were timed out. The reverse in this pattern is evident from 1929 - 1932.

The chart below shows the Dow Jones and its 52Wk Highs and Lows from 1991 - 2011. Note how the Dow Jones appears to have stopped pushing its 52Wk Highs higher (Oops!), and has now descended to levels where it can once again push down its 52Wk Lows.
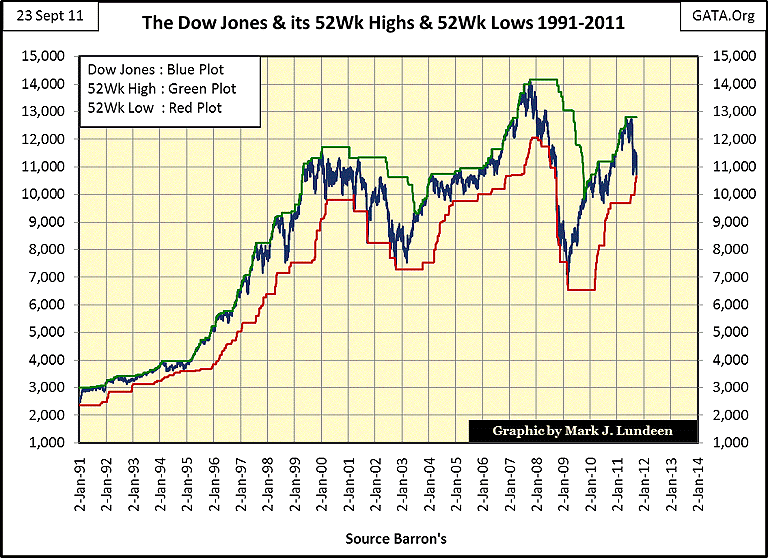
Historically, when the Dow Jones has crossed the gap from one 52Wk extreme to the other, it doesn't bounce off, but continues to move in the new direction for a considerable period of time, making new 52Wk extremes in the process. There have been exceptions to this pattern, but not many. Currently the Dow Jones has yet to fully cross the gap from its 52Wk highs to its 52Wk lows. But as we see in the chart above, and table below (52Wk Low Gap column), the Dow came very close in pushing down its 52Wk low last week for the first time since March 2009.
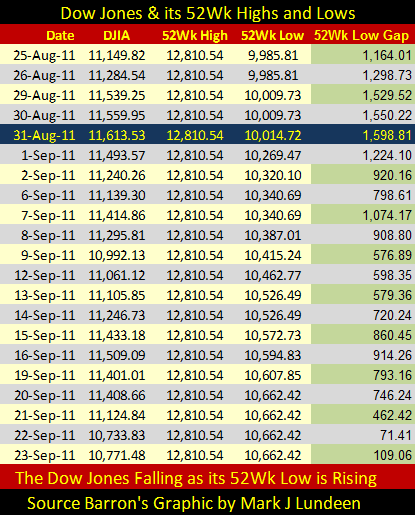
On Thursday, 22 Sept the Dow Jones closed only 71.41 points from closing the gap and pushing down a new 52Wk low. As you can see in the forty years of history displayed in the two charts above, once the Dow Jones begins to push down its 52Wk lows, it continues to do so for a considerable period of time as the Dow Jones descends to its ultimate bear market bottom. Don't be surprised if the Dow drops far below its lows of March 2009.
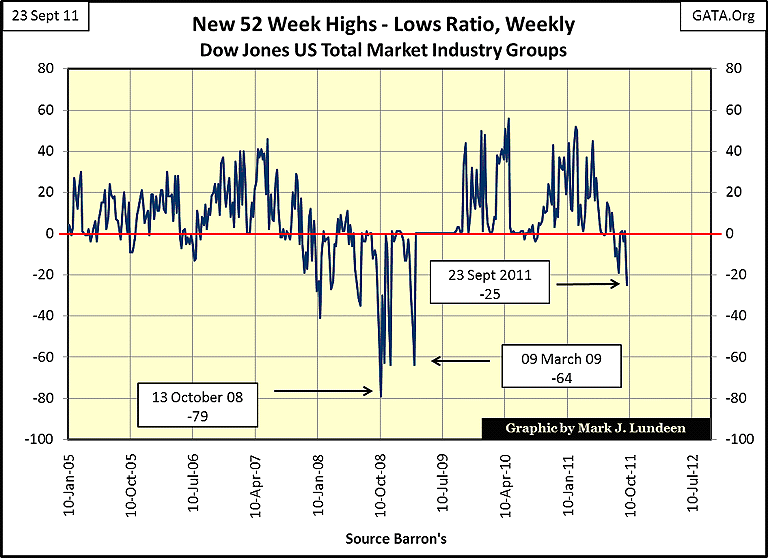
Next is the 52Wk H-L ratio for the Dow Jones Total Market Group. This is weekly data for stock groups, not individual stocks trading at the NYSE. This week, the DJTMG data saw its second plunge into the dark-side of the market. Note how the DJTMG exceeded its August's down-spike.
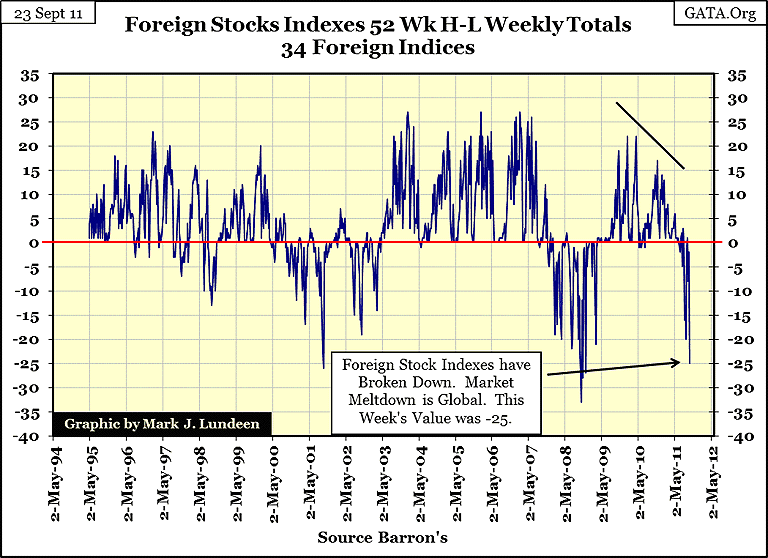
The 52Wk High-Low ratio for the 34 foreign stock indexes is the worst looking of the three charts. Only nine of the thirty four foreign stock indexes I follow didn't make a new 52 Wk Low this week.
The global financial markets are nowhere near their bottoms, but as we can see in the historical pattern of these markets' 52Wk H-L ratios, we should expect some strong days and weeks ahead of us. Count on that! But rallies in BEAR MARKETS ought to be sold, not bought!
It was a bad week for gold and silver, but that is to be expected in our current "regulated markets" where so much is at stake; since gold and silver are true money, and serve as a thermometer to reveal the health of currencies and sovereign debt, the precious metals markets must be kept cool at all costs. But since the precious metals markets are extremely small in size compared to currencies and financial assets, their temperature is extremely easy to "regulate." At least they have been so far, but this will change.
Price declines in a bull market are deceiving! In the chart below, silver since April has seen its largest price decline since 2001. But price action is the perspective of "financial market experts" and it is misleading. Why is that? Because a dollar decline in the price of silver in 2001 was a huge loss of 25%. This week, silver's decline was 266% of the price of silver ten years ago, yet silver is still above $30.
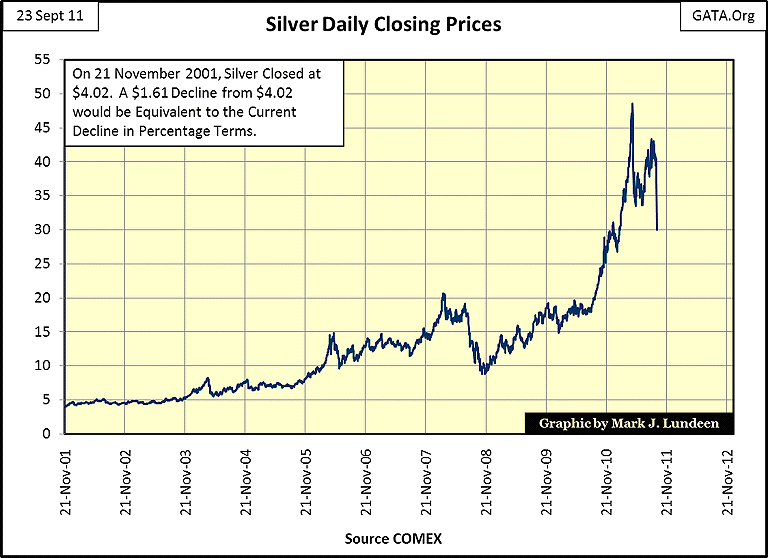
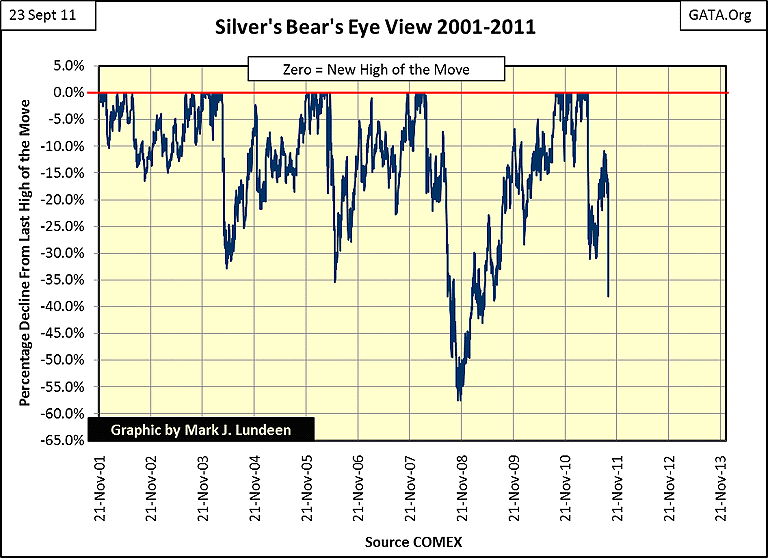
But the Bear's Eye View of silver, using the same price data above, focuses only on new-highs of the move, and the PERCENTAGE DECLINES from those highs tells the real story. This correction in silver is big, but since November 2001 when silver could be purchased for $4.03, silver has seen bigger percentage declines.
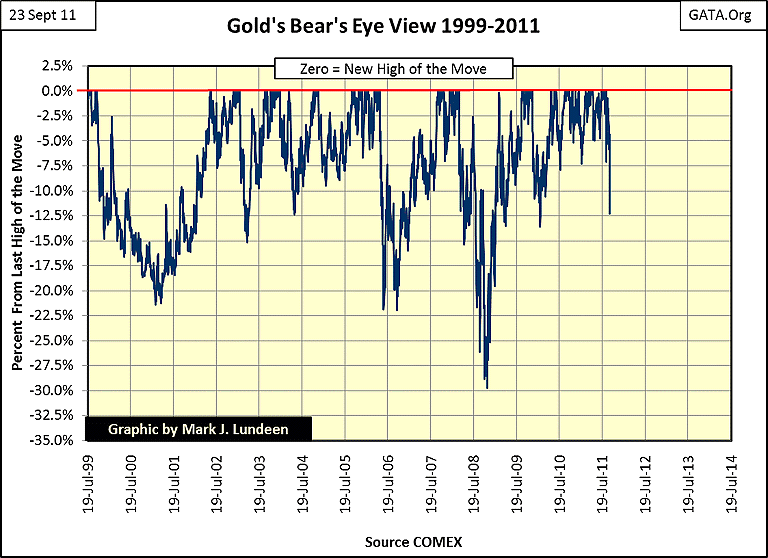
Gold, as is VERY EVIDENT in its BEV plot, has been very resilient to the predations of the "policy makers". The Dow Jones' BEV plot ended the week with the Dow Jones 24% below its last all-time high in October 2007. Seeing gold only off 12.5% from its highs of last April after a week like this is indeed an impressive performance. As is typical of CNBC, their "experts" this week overlook the shortcomings of the stock market, and focus on the woes in precious metals. But don't be deceived; even with all the machinations of the US Government and the Euro "authorities", gold is outperforming the global stock markets by a significant margin!
All in all, with the exception of Doctor Bernanke doing the twist, nothing except the prices in the markets changed this week: the financial markets are still being supported by the highest authority in government, while the precious metals are still being suppressed by The-Powers-That-Be in North America and Europe. In 2011, the only evidence of intelligent life on planet Earth can be found in Asia, where real gold and silver is patiently accumulate at artificial low prices.
But Western "policy makers" have been playing their nasty little games of diminishing returns for decades now. Just remember, the "policy makers" are growing weak, as Mr Bear is growing strong. With the big NY banks short-side activities in the metals' futures market, where banks make paper promises to deliver in the future, thousands of tons of fictional metal only for the purpose of punishing investments in precious metals, I have to say that Mr Bear is the biggest gold and silver bull in the market. He has these same banks on the top of his list of the doomed. Don't be surprised to see a force majeure in the New York and London gold and silver pits in the next 12 months.
Mark J. Lundeen
[email protected]
[email protected]


