What's Driving Gold And Silver…And What's Next?


Gold's retreated from a record high above $2,000, and silver's off its own seven-year highs near $30.
Is that cause for concern? I doubt it.
These have been dramatic surges to new levels, brought on by a combination of low interest rates, historic money-printing raising the specter of inflation, a softer U.S. dollar, and of course a global pandemic.
But that doesn't mean gold and silver have to continue higher in a straight line.
Instead, these gains have been so strong that a period of retracement and consolidation are not only expected, they're crucial to the continued health of this precious metals bull market.
There are several fundamental drivers that will help keep gold and silver pushing higher, which I'm going to detail for you below.
Then we'll look at these metals' prices from a technical perspective to gauge what to expect next over the near term.
Gold's Fundamental Drivers
Mining gold has never been more expensive. It's possible that costs will drop for 2020 as demand for oil has retreated, but all kinds of related goods and services that go into gold production have gone up with pandemic surcharges.
Via the Wall Street Journal:
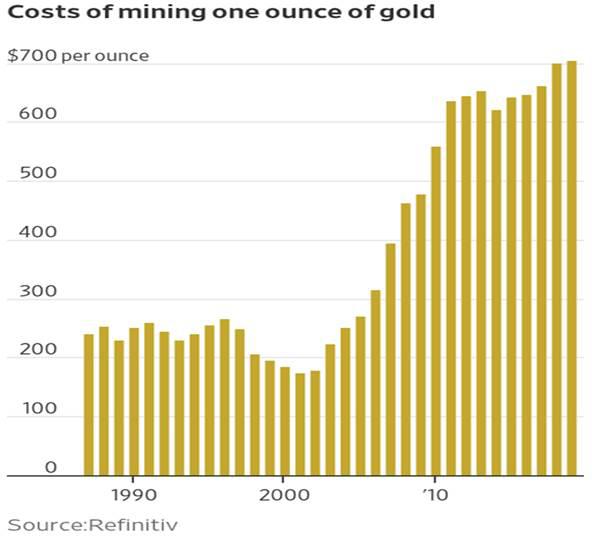
A higher cost of production will push gold prices higher. The metal is not likely to ever be produced at a loss and, if it is, it won't be for very long.
Gold exploration budgets continue to shrink on a global basis, as gold miners suffer from recency bias. They need to see gold at its current high price for an extended period before committing more funds to find more gold.
That also pressures junior gold explorers. They've only started to enjoy a more buoyant market to raise money in the past year as gold prices have come back to life.
S&P Global Market Intelligence recently reported the industry has suffered a decade of underperformance for gold discoveries.
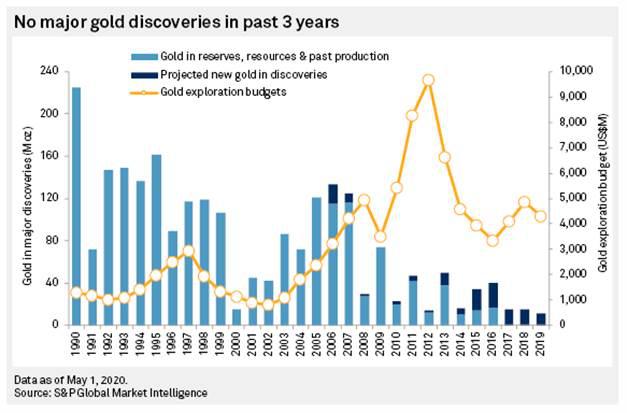
Major gold mines are being depleted, and there is a dearth of new discoveries being made to replace mined ounces. Those being found are lower in grade, meaning more effort is required to extract an ounce of gold.
This is all pushing explorers and miners into increasingly risky jurisdictions, which ultimately is likely to translate into higher costs as well.
While these factors all point to higher long-term precious metals prices, we still need to understand their recent action to gauge what to expect in the shorter-term.
Precious Metals' Technical Picture
We can see from the gold price chart that the correction which started in August after gold peaked near $2,070 is NOT likely over.
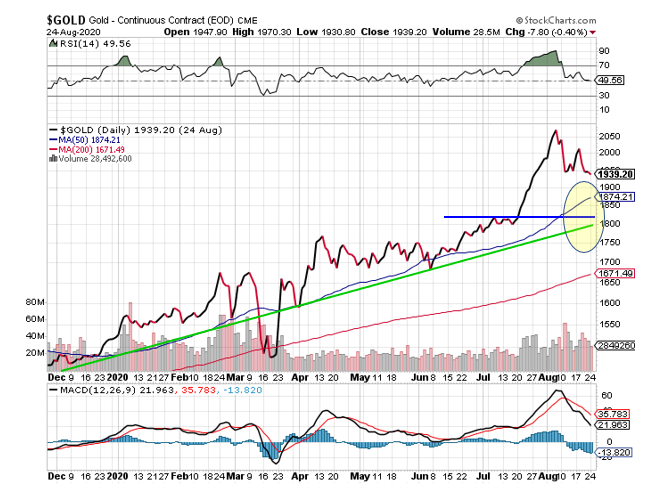
Gold's RSI and MACD momentum indicators confirm the current downward trend. Initial support is likely to be around the 50-day moving average near $1,875. After that we're looking at the $1,800-$1,825 level, which is where the overhead resistance in early July meets with the rising support (green) line.
Meanwhile, GDX as a proxy for gold stocks shows a similar correction, with its RSI and MACD both confirming the ongoing correction.
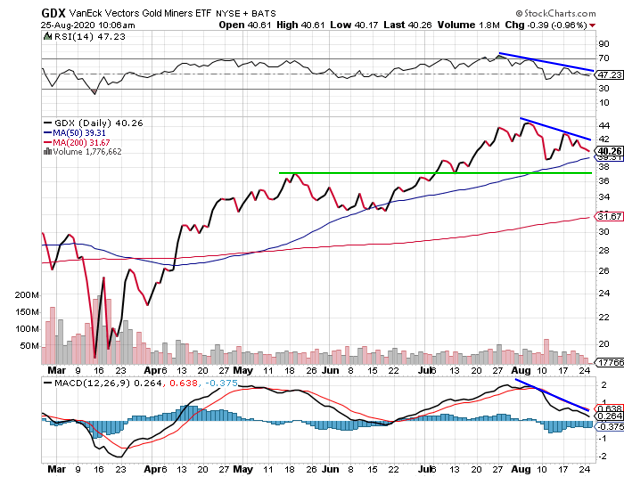
For GDX, initial support is likely around the 50-day moving average near $39, then $37 which was support in mid-July and overhead resistance in mid-May.
As well, the Gold Miners Bullish Percent Index remains at an elevated level.
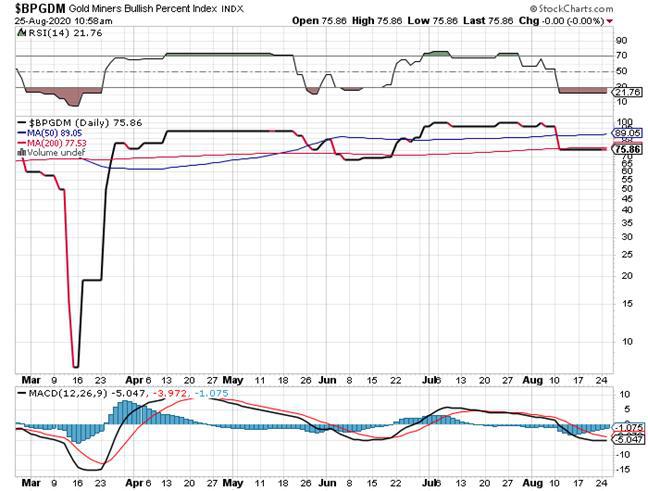
This indicator typically needs to get below 30, then turn upward to get a bullish signal for gold stocks. That's clearly a ways lower from the current level of 75. It suggests we need to see a considerable drop in sentiment for gold stocks before we see a Buy signal.
The technical picture for silver is similar to gold's.
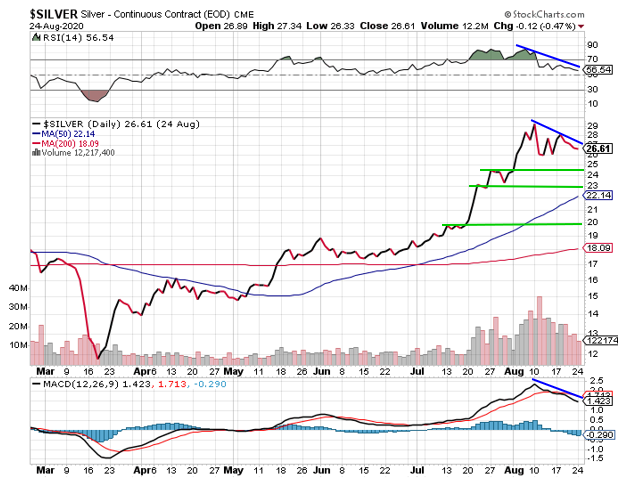
Silver's downside targets are previous resistance at $24.50, $23, then $20.
Comparing the performance of silver stocks versus silver, using SIL and SLV, reveals some interesting insight.

In early August, when silver peaked, the silver stocks only moved marginally higher. That was a strong indication that silver was likely putting in a near-term peak.
Silver stocks, like gold stocks, are in a correction phase.

If SIL breaks down below $45, first support is likely to be at the 50-day moving average of $42.75, followed by $40 then $37.5.
In my view, near-term action for precious metals is likely to remain weighed down. I also think we could see some strength in the U.S. dollar.
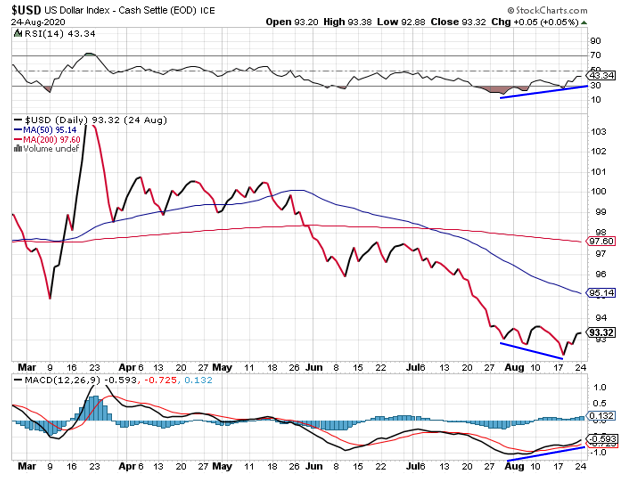
The U.S. Dollar Index trended further downward from late July. Yet that's when the RSI and MACD started showing positive divergence they've been trending upwards since.
Meanwhile, the "smart money" Commercial Hedgers appear to be betting the U.S. dollar has little downside, and probably some reasonable upside ahead.
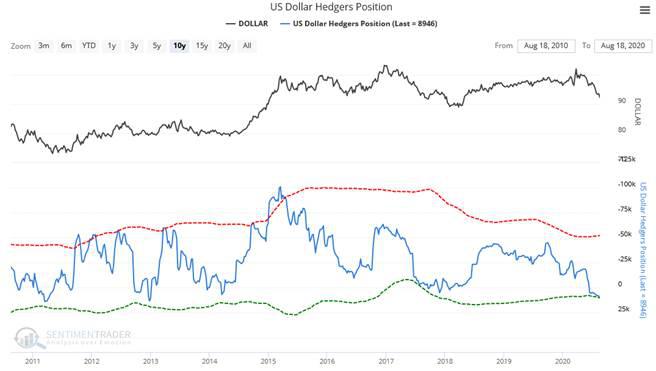
Source: sentimentrader.com
To recap, the longer-term view for precious metals remains bright. The lack of sizeable gold discoveries, coupled with rising costs and lower grades bodes for much higher prices.
But the near-term technical picture continues to point to lower prices or, at best, a consolidation near current levels.
I still see gold reaching for $2,200 this year and silver to edge towards $34.
Stay tuned as I continue to track technical and fundamental developments for what to expect in precious metals.
Peter Krauth
*********


