When “Does” Gold Rise…And When “Will” Gold Rise Again?


The Only Time Gold Rises In A Sustained Generational Bull Market:
Gold only “really” rises “materially” when the “after tax” returns of both the bond and equity markets are, or are expected to be, less than inflation for a considerable time. Such periods of “Negative Real Returns” (NRR) give rise to generational bull markets, which only happen when the following two conditions are met simultaneously:
- Equities are not offering positive “Real” returns, which typically happens during major stock market crashes and/or significant / protracted corrections. During such crashes or corrections, there is usually a flight to the safety of bonds and gold. However, more recently, bond yields have been extremely and artificially low, which made Gold attractive – more about this later;
- Interest rates are not offering positive “Real” returns, because either:
- Interest rates are nominally negative as they currently are in the EU and Japan, or negative nett of inflation and tax, as we currently see in the USA and UK; or
- Inflation is rising rapidly, and lagging interest rates are playing catch up, as we saw during the 1970-1980 Gold boom.
Therefore, we only need to determine when these two conditions will be met if we wish to invest in Gold. NB! Any spikes in the price of Gold arising from sporadic events such as political conflict, acts of terror, trade wars or regional wars, tend to be short lived.
Gold’s action these past 18 years interpreted from the above “NRR” rates perspective
Due to continued deficit spending and consequent rising sovereign debt levels, Governments had a vested interest in keeping rates artificially low, to suppress debt service costs. Below we see the 36-year decline in 10-year UST rates below the declining red resistance line, which bottomed in Jan 2016, followed by a pop up over that line. Technical Analysis suggests that yields should soon drop to retest the red line, near or below record lows, before resuming a cyclical upside breakout. However, one is betting against the Fed and other central banks, so it is difficult to anticipate just how long they will continue to manipulate interest rates to the downside. Such a drop would typically occur in the event equity markets crash, which could be in the trusted Sept/Oct 2019 or Sept/Oct 2020 periods, or any time in between. Regardless of the reason, the longer rates remain super low, at or below inflation, the better it is for Gold.
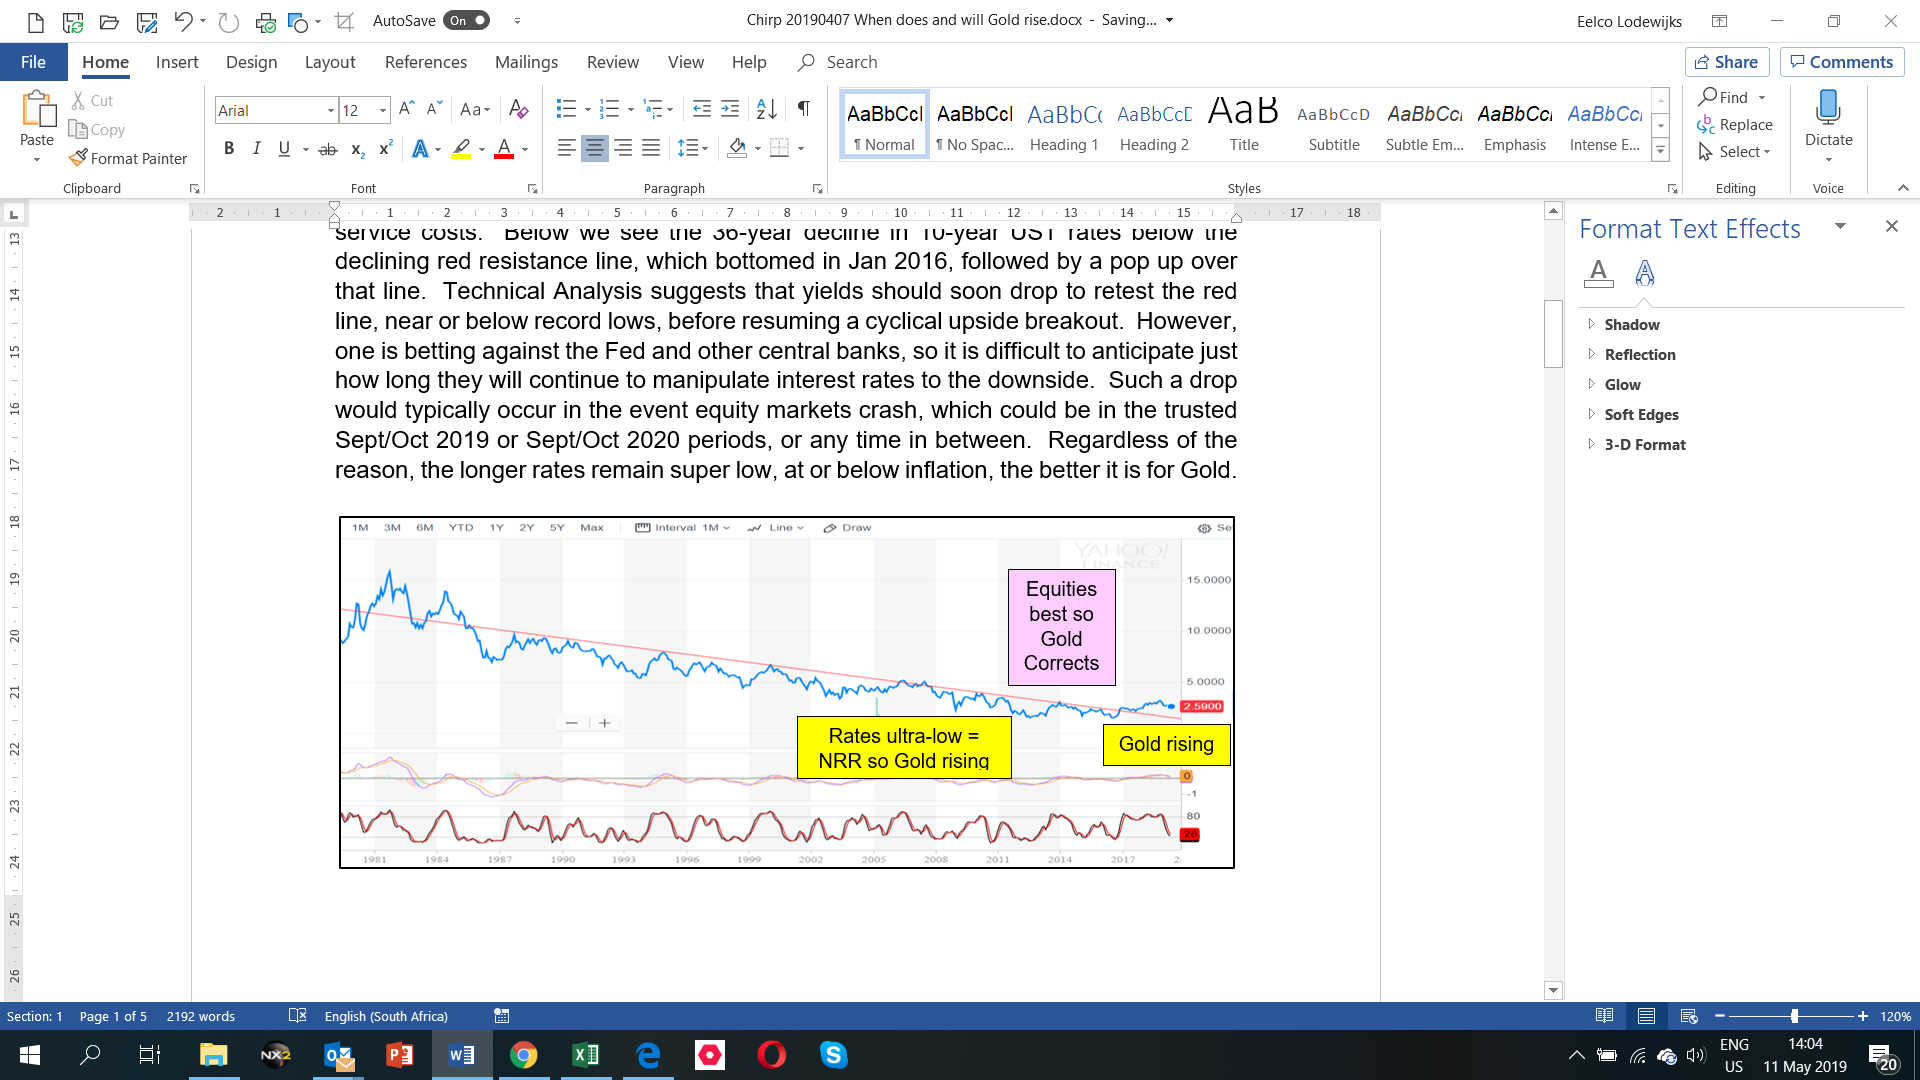
However, the above “monthly” chart’s Stochastic suggests that rates are oversold and could rise for many months before they fall, which may favour the later 2020 equtiy market correction.
It is critically important to realise that “super/artificially” low and negative yields discouraged savings and encouraged risky speculation. This resulted in rising debt, which is future consumption brought forward, and the mispricing of most assets.
Gold’s action these past 18 years interpreted from the above “NRR” Equity perspective
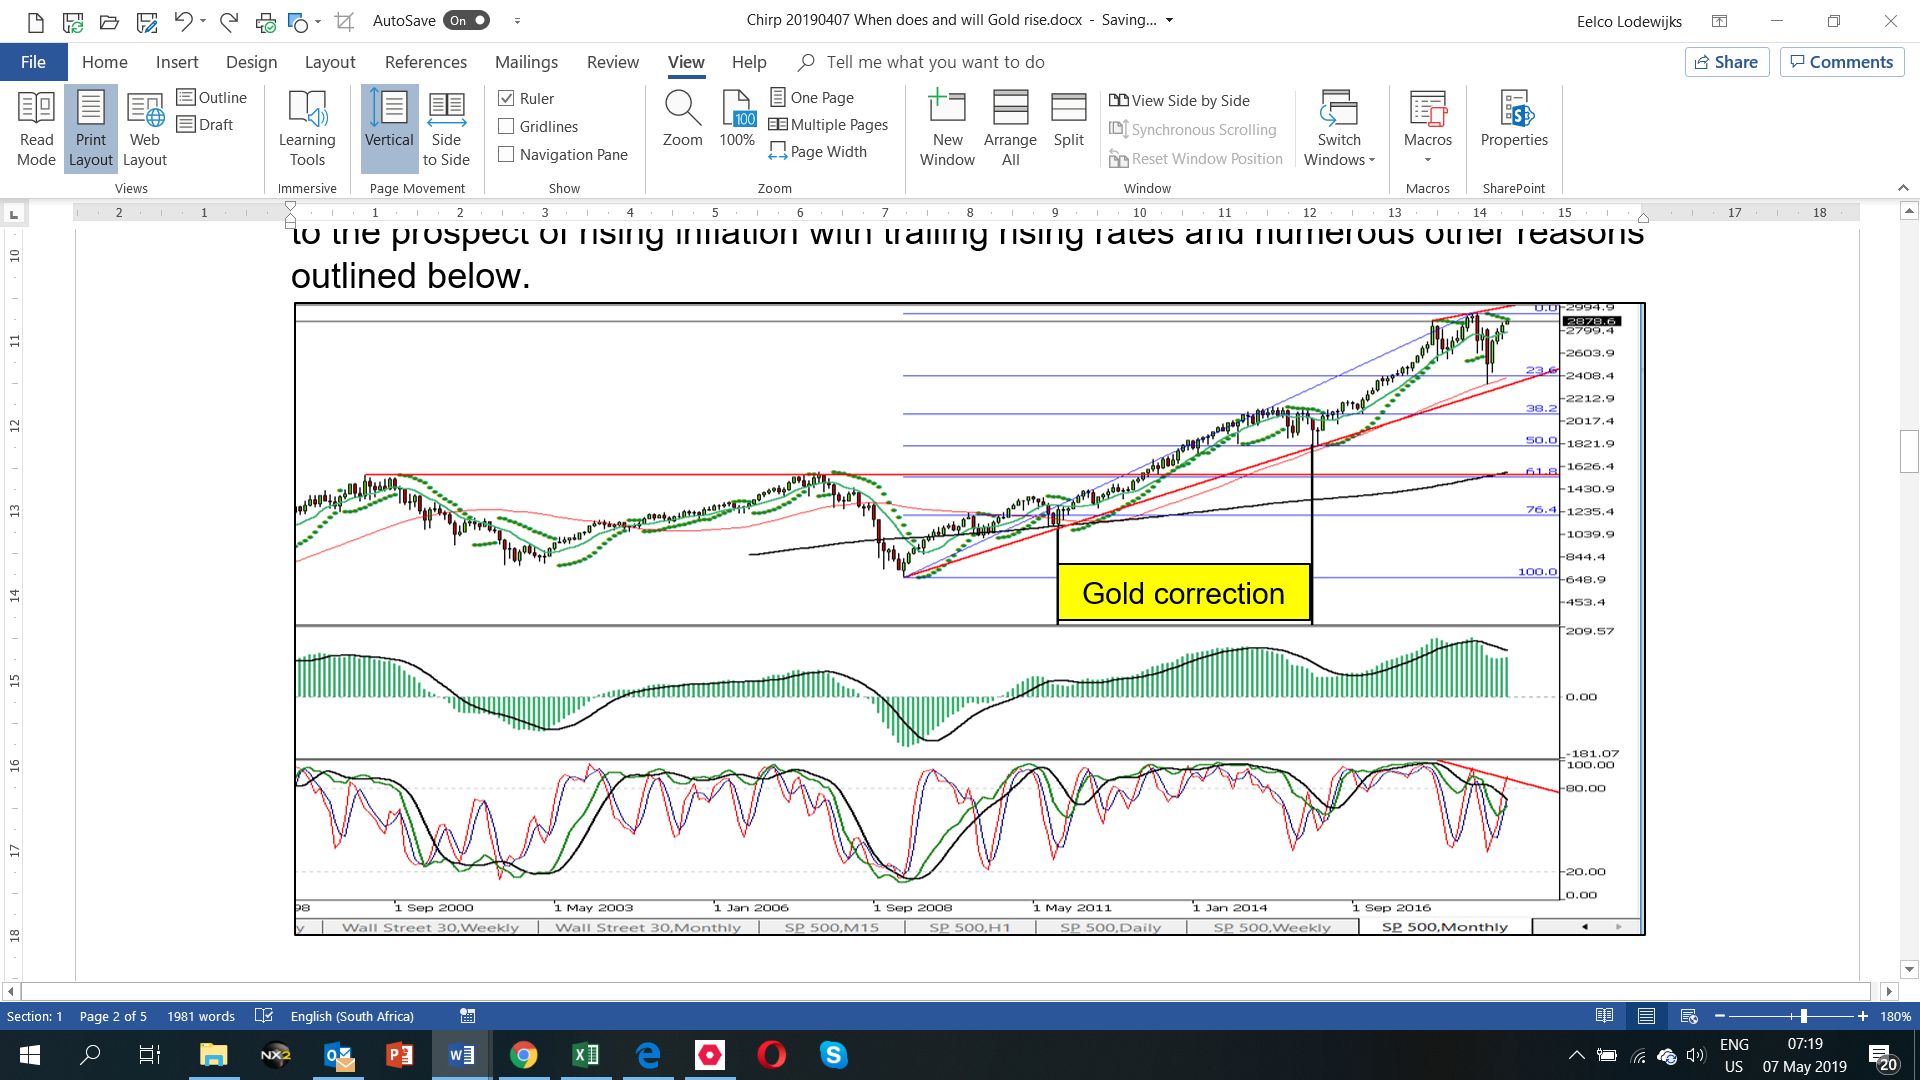
Referring to the chart below, I use the monthly S&P 500 as proxy for global markets, because if the US sneezes, the world gets the flu. Equities crashed early 2001/2003 and again in 2007/2009, all the while holding below the 2000 peak, depicted by the horizontal red line, until 2013. During most of this time, Gold was rising because equities did not offer actual, or the prospect of, positive real returns, especially after adjusting for inflation and tax. However, by September 2011, investors shifted out of Gold, and back into equities, because they became convinced that equities would once again rise above the red line. The vertical black line on the left reflects where the Gold boom ended Sept 2011, where-after, Gold corrected because equities offered superior returns. Gold then bottomed in January 2016, at the vertical black line on the right, as investors started hedging their bets in response to the prospect of rising inflation with trailing rising rates and numerous other reasons outlined below.
Current and future prospects for Equities and Rates
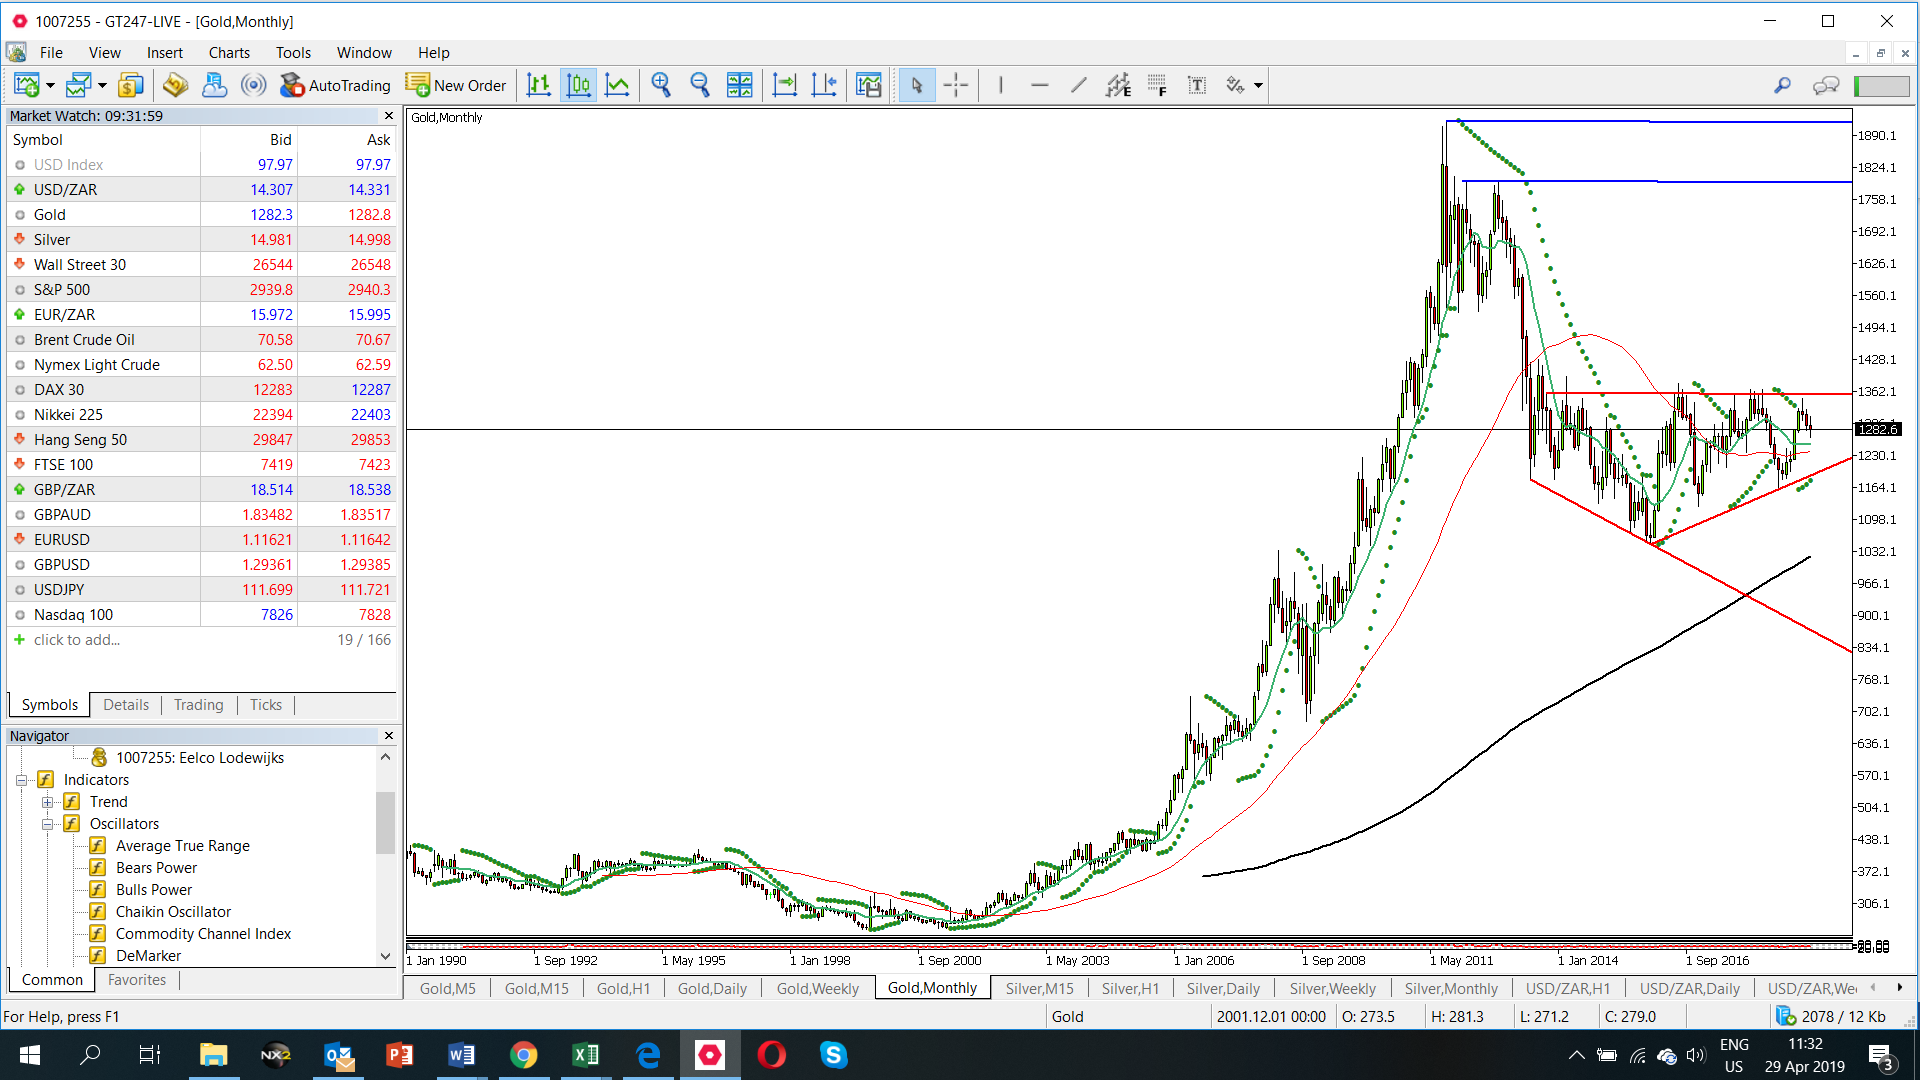
From a technical analysis perspective, the S&P remains above the rising red support line, which suggests further upside, while the blue Fibonacci lines show that the S&P has not made a 38.2% correction of this entire bull market. However, this boom is now one of the longest on record and markets are overbought, so we are overdue for a correction. Furthermore, MACD is bearishly aligned and we also see a probable bearish divergence between the price and the Stochastic oscillator, as reflected by the two short red lines. The weekly charts (not shown), show overbought markets rolling over, which suggests the above monthly divergence will be confirmed. Therefore, it is possible that the S&P is forming a bearish triple header. Contrarily, if the S&P rises to a new record, at say 3 000 (up 1-2%), it could complete a bearish megaphone top.
It should be noted that in the past, interest rates were the market’s “risk pricing mechanism”, with higher rates suggesting higher risk and lower interest rates suggesting lower risk. Accordingly, investment funds used to move between equity markets (risk on) and bond markets (risk off), which meant that Stocks and Bonds were not correlated. However, in this era where interest rates are no longer set by “free” markets, but are instead kept artificially low by central banks, that risk pricing mechanism is broken. These ever-lower rates made both equity and bond markets attractive, consequently, those two markets have become increasingly correlated these past 10 years. This is not a good situation, because it suggests that the next “risk off” cycle could be very painful, because the traditional flight to safety offered by Bond markets will no longer be quite as attractive. This is exactly when Gold comes into its own as the ultimate “flight to safety” destination.
To make matters worse, recessions typically eliminate the excesses that build up during booms. However, central bank intervention has repeatedly prevented this from happening, by indulging in untested monetary policies, such as QE, TARP, ZIRP, etc. Today, 40% of Eurozone bonds and 16% of corporate bonds have negative yields. The fact that deficit spending continues unabated and sovereign debt continues to spiral out of control, suggests that QE to infinity is the only logical future outcome. This would initially be accompanied by the renewed repression of rates, but could in future feed inflation, both of which would be great for Gold.
The resulting artificially low and negative bond yields have resulted in significant market distortions as cheap money lowers the threshold for investments that would otherwise not be considered. Amongst others, this has pushed pension funds and investment companies into a search for yields, which translates into more risky strategies and greater pain in the event of a market crash. Consequently, the excesses and distortions continue to grow unabated, which suggests that the next market crash will, in fact, be an unusually big economic reset.
However, as mentioned above, super low rates have encouraged risky investments, which, in turn, resulted in mispricing of assets. Consequently, one of the strongest bull markets in history has not been matched by the traditional “strong” 4%-6% GDP growth, but has instead been accompanied by a very weak economic recovery. For example, it is estimated that 15% of companies in the S&P are losing money after interest, despite rates being so low. In fact, much of this seemingly “impressive boom” was driven by speculative growth expectations, not value. This is because the latter part of this equity boom was mostly on the back of a handful of tech stocks, share buybacks and, more recently, IPO’s of loss-making tech companies whose shares soar despite continued losses.
It should also be noted that GDP is a measure of growth in turnover and, in our emerging multi-tech world where things are increasing cheaper or free, current economic measures are no longer accurate depicters of economic performance. Furthermore, many of the economic statistics, like inflation, are manipulated by Governments to reflect more favourable outcomes. Accordingly, both Government and Business are increasingly operating in the dark without an accurate compass.
Add to all this the fact that countless disruptive technologies are going to change the way we do business and the way our world works in the next 5-10 years. This will cause many mega corporations and even industries to be transformed, shrink or fail.
Fundamentally, all this lays the foundation for a long awaited 38.2% - 50.0% Fibonacci correction / crash. When that happens, there will be a flight to the safety of bonds, which will drive rates down. It is my expectation that it will start in Oct 2019 or 2020.
Of course, if an equity collapse causes US interest rates to fall, the Dollar would lose its appeal, and significant Dollar weakness would probably herald the onset of inflation, which would, in turn be good for Gold.
Why invest in Gold (and Silver) – provided we get the timing right
The above analysis suggests that we will soon see a correction in Equities, and we will soon see rates dropping below inflation once again, thereby meeting the two criteria needed for Gold to resume its role as the ultimate “flight to safety” destination.
Remember, the entire point of buying “physical” Gold or Silver is to:
- Own a tangible to ensure the return “of” your capital when the return “on” your capital is at risk and is likely to be considerably negative in the near NRR future;
- Get away from owning FIAT currencies, which continually lose value;
- Get out of the dishonest “screw you” banking system; and
- Eliminate third party risk at a time when incentive bonuses have created a situation where management strategies and equity valuations are no longer rational.
Instructive article: https://www.milesfranklin.com/what-would-you-sell-your-gold-for/
Gold always hold its value, or better, during times of economic crisis. Furthermore, Gold is the perfect currency hedge in an era where all currencies are fiat and gravitating to zero. Finally, Gold has outperformed all asset classes over the past 100, 50 and 20 years. Before he became Chairman of the Fed, Alan Greenspan said:
“In the absence of the gold standard, there is no way to protect savings from confiscation through inflation. There is no safe store of value. Deficit spending is simply a scheme for the hidden confiscation of wealth. Gold stands in the way of this insidious process. It stands as a protector of property rights. If one grasps this, one has no difficulty in understanding the statists' antagonism toward the gold standard”. He recently confirmed that he stood by every word of that.
Late (2016), Greenspan likened the Fed's over-blown balance sheet to "a tinder box that has not been lit", characterized the job of Fed chairman as one “subject to the heavy dictate of the federal government”, and recommended gold ownership as a hedge for private investors. "Gold," he said, "is a good place to put money these days given its value as a currency outside of the policies conducted by governments".
Gold’s action and prospects – a future scenario
Before Gold can truly resume the generational bull market that started in 2001, we need NRR’s in both Equities and Bonds. This would probably only happen if Equities were to crash at the end of their current record run, which would, in turn, drive yields back down to, or below, their historic record lows as there would be a flight to the safety of bonds. Therefore, all we need to do is to anticipate, or wait for the day, when Equity markets correct meaningfully, as that will provide the trigger for both lower bond yields and higher gold prices. This suggests that analysing the Gold price charts is almost pointless until this happens.
Gold is still not out of the woods and the charts are not bullish. Fundamentally, Gold must first break above the horizontal red resistance line shown on the monthly chart below, which sits at about $1 370, before it rises to the next major blue resistance levels at about $1 800 and $1 920. Bearing in mind that this is a monthly chart, the $1 370 breach could happen in September 2019, or it may only happen in 2020.
A subsequent break above $1920 would be conclusive confirmation that the Generational Gold Bull market is on track for stellar performance. A fractal analysis I updated in 2017 sheds more light on this – it can be seen at this link.
When Gold breaks above $1920, it is my contention that Gold will reach $8 000 to $10 000 by about 2025/2027, which would be 6.0x – 7.5x higher than the current price of $1 300. Contrarily, Silver is likely to go to R300, $400 or even $500, which would be 20x to 33x higher than the current price of0 $15.00.
THIS COMMENTARY WITH CHARTS, by Jesse Felder underscores the above.
One chart I’ve been watching for the past few years is the ratio of Gold to the S&P 500. Over the last half-century there have been good times to own gold and good times to own stocks and the two have rarely coincided (making gold a better portfolio diversifier than many alternatives). The trend in the ratio of the two (at the bottom of the chart below) has been a decent guide to understanding when to own each.
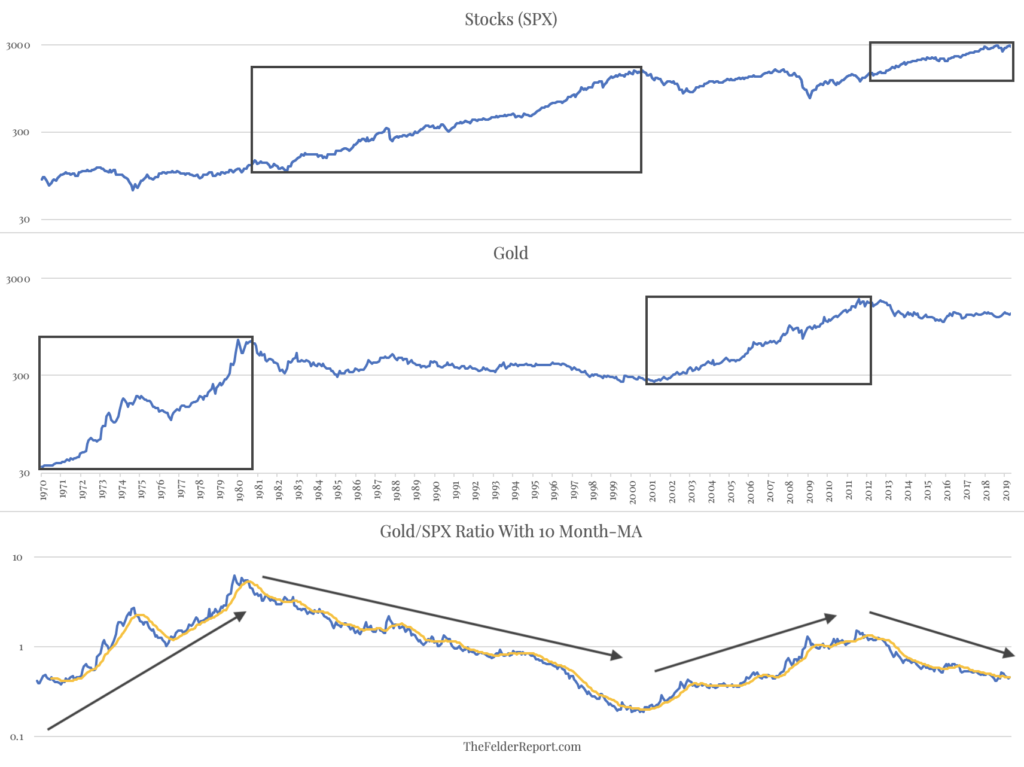
The ratio very recently crossed above its 10-month moving average thus giving another buy signal which would suggest market trends are supportive of owning gold versus owning stocks. Overcoming its most recent high set late last year would likely confirm this latest signal is more than just a “whipsaw.” And it would have important long-term implications for investors of all sorts as these trends have typically lasted a decade or longer.
Last Notes
Without gold and silver, there is little diversification in your policy. Diversification within equities is not diversification if the markets crash, as all equities crash together. Today, diversification into bonds is not as clever as it was in the past, especially if there is a risk of rising rates. NB! I consider platinum and palladium risky in the long term as 50% of PGM are used in cars with internal combustion engines, most of which are likely to be replaced by electric cars in the next decade.
These, and earlier reports, can all be viewed at http://eelcogold.com/
----------------------------------------------------------------------------------------------------------------
Disclaimer: The content of this report represents the opinions of Mr Lodewijks, who is a retired Civil Engineer with diverse interests. Where applicable, the content should be deemed informative guidance to get the reader thinking and not specific advice.
Mr Lodewijks is not a qualified Investment Advisor. His investment reports aim to educate and help investors understand investment considerations and strategies. As trading and investing in any financial markets may involve serious risk of loss, Mr. Lodewijks recommends that you consult with a qualified investment advisor.
*********


