Which is More Precious, Black or Yellow Gold


While gold was extremely popular the past few years, I think it's safe to say crude oil is unbeatable for popularity, as it's a resource which almost everyone uses on a daily basis and it affects all of us in the wallet when oil prices rise as fuel, shipping costs and petroleum products start to cost more and more. This is the first time I have REALLY noticed everyone is following the price of oil. When kids start talking about it, then you know its being watched like a hawk from all types of individuals and traders.
When crude oil peaked at $147.90 back in July, people were starting to panic. The increase on fuel alone was really taking a toll on commuters and shipping costs went through the roof, which hurt almost every business in some way. That being said, oil is now back down at support and looking ready for a bounce. Let's take a look at the charts.
Crude Oil Monthly Chart Explained
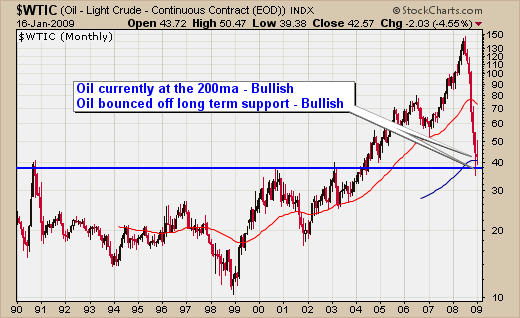
The monthly chart is by far the most over looked chart, because it seems so far out of most people's trading time frame, that they just don't check to see what things look like from further distance. I will admit that is a boring chart to watch, as it moves as slow as molasses but it still provides excellent support and resistance levels, which we do not see on the weekly or daily chart. Currently the monthly chart of crude oil has pulled back to the 200 day moving average, which is generally a good place where buyers step in. Also to take that same price level and see that it's also a long-term support level, really starts making things look better for a possible bounce.
Crude Oil Monthly Trading Chart
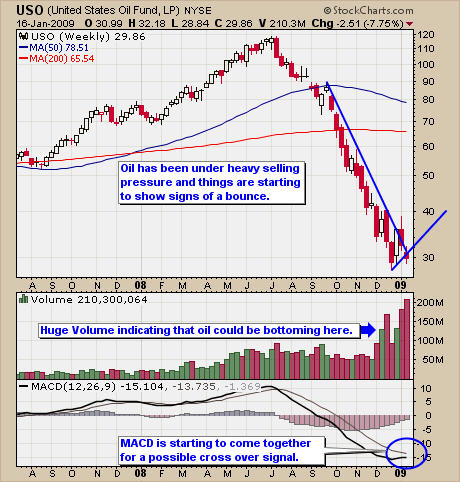
Crude Oil (USO Fund) Weekly Chart Explained
The weekly chart is really exciting to look at because oil has sold off so hard and it's become the talk of the world, everyone wants to catch the bounce in oil price when it does finally bounce. I can see oil bouncing back up to the $60 level but only time will tell. I don't forecast or trade with a bias; I am strictly a technical trader. You can see how popular it has become simply by looking at the volume on the chart. Only 12 months ago it was trading an average of 30 million shares and now it's blasted higher to over 200 million shares each week, indicating we should see some type of reversal soon. This prolonged steep sell-off is starting to show signs of a bottom. The downward trend line has been tested as prices are starting to slow the speed of decline. Also the MACD is getting close to crossing over as the downward momentum is slowing.
Crude Oil Weekly Trading Chart
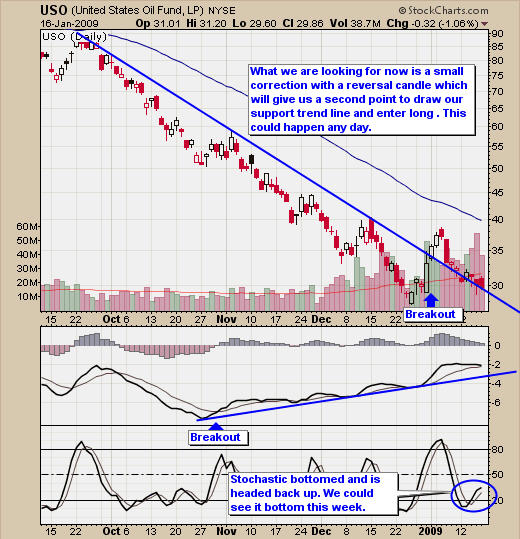
The Trading Time Frame - Crude Oil Daily Chart Explained
The daily chart of crude oil is what most traders use and it is also what I focus on for generating entry and exit points. A couple of weeks ago, I mentioned we needed oil to break higher above our down trend line and then correct (sell back down) to lower our risk, as we will be able to draw a support trend line once oil reverses and generates a reversal candle.
This daily oil chart shows us that oil is starting to find more buyers, as we had a nice bounce in price 2 weeks ago and heavy volume also shows interest is climbing. The MACD (momentum) has been on an up-trend for a couple of months indicating that we should see a shift in trend soon. And to top that off, stochastic has bottomed and started to head higher, which is bullish for the short term. Oil can also be traded using the leveraged exchange traded funds (ETF) DXO and DTO, if you want more bang for your buck.
Crude Oil (USO Fund) Daily Trading Chart
Crude Oil Conclusion
Oil continues to be in a strong down trend and waiting for a low risk entry point is crucial. Picking bottoms or chasing rallies just doesn't perform well over the long run. Following a basket of ETF's like USO, DXO, DTO, XLE, GLD, DGP, GDX, XGD.TO and more, allows me to catch moves within the gold and oil sector.
My strategy is conservative and I do miss a number of good trades, because I need risk to be under 3% before I jump. Generally within the basket of ETF's I follow, I will get one or two signals when the market reverses or bounces off support. And that is the fund where I put my money. I prefer to trade GLD and USO, but if GDX gives a signal I trade it when the time is right. Quality trades are what I focus on finding/waiting for and I avoid a ton of high risk losing trades, which are the silent killers. One high-risk trade losing 7%+ will cripple your profits for the year quickly. I continue to wait for an entry point, which could be just around the corner if things work out.
What's Up with Gold Prices?
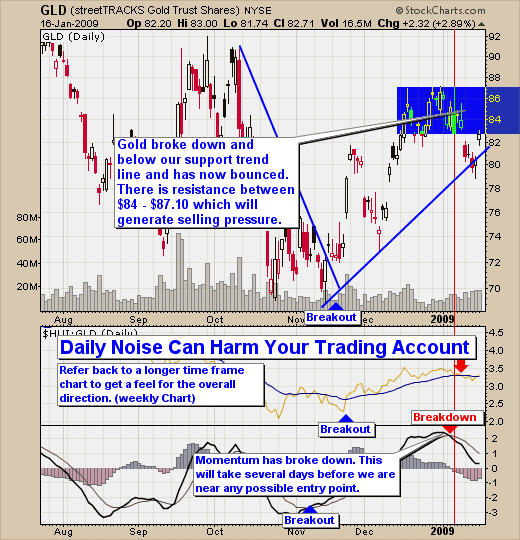
Gold has performed well after finding support and bouncing to the top of its descending trend line. The daily gold chart is full of noise and with everyone excited for the next big rally in gold, I am sure Fridays big up day really has you stressed out, in case this is the next gold bull, because you don't want to get left behind. During emotional times like this, I like to step back and take a look at gold from a distance.
The daily chart, which I use for trading gold, can sometimes raise my blood pressure, because of the noise (price swings) on the chart. As you can see in the chart below, it looks like gold is ready to continue its run higher. But what we forget to keep in mind is that the weekly chart is bearish giving gold down ward pressure.
Daily Gold Chart Filled with Noise and Emotions
The Relaxing Waves of the Weekly Gold Chart
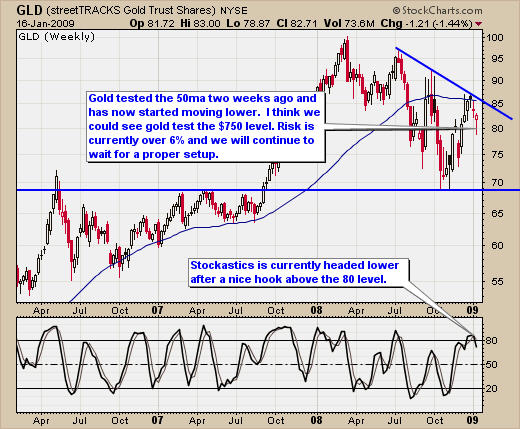
After looking at the daily chart of gold and most definitely getting a little confused, we look at the weekly chart. This reminds us of the overall trend of gold, and allows us to see if it's under more buying, or selling pressure. Currently gold is in a downward trend and just finished hitting its head off resistance 3 weeks ago. This chart is what can keep you on the right side of the trade more often than not. While I am bullish on gold, I do not trade long when the overall trend is down and I must have a proper setup and low risk entry point. This weekly chart indicates that gold is under weekly selling pressure and is trading just below resistance. Also the stochastic topped and started heading lower last week. In my opinion this is not a good time to be going long gold.
Weekly Gold Trading Chart
Gold Conclusion
Seems like everyone is excited and waiting for gold to start its next big rally, but from a short-term traders point of view like mine, Gold just does not look like a buy yet. Currently gold is in a downward trend on the weekly chart and near resistance. Also, the risk is more than double what I want, for me to enter a trade. I continue to wait for the dust to settle before our hard earned money is put back to work.

Chris Vermeulen has been involved in the markets since 1997 and is the founder of Technical Traders Ltd. He is an internationally recognized technical analyst, trader, and is the author of the book: 7 Steps to Win With Logic
Through years of research, trading and helping individual traders around the world. He learned that many traders have great trading ideas, but they lack one thing, they struggle to execute trades in a systematic way for consistent results. Chris helps educate traders with a three-hour video course that can change your trading results for the better.
His mission is to help his clients boost their trading performance while reducing market exposure and portfolio volatility.
He is a regular speaker on HoweStreet.com, and the FinancialSurvivorNetwork radio shows. Chris was also featured on the cover of AmalgaTrader Magazine, and contributes articles to several financial hubs like MoneyShow.com.
More from Gold-Eagle


