While Gold Stays A Safe-Haven Port…Silver Hits Downside Support


So how did January work out for ya?
■ In a mere month the killer coronavirus has taken (at this writing) over 300 lives with sadly more in the offing given reports of some 14,000 folks being infected ... the global negative economic effect is of macro proportions, from canceled commerce and flights to quarantines and closed establishments;
■ The UK technically withdrew from the EU ... whoo-hooo given next comes 11 months of business and trade issues over which to stew;
■ The StateSide President went on Senatorial trial after being impeached ... and come Wednesday shall have (albeit expectedly) survived;
■ The price/earnings ratio of the S&P 500 using "TTM" (trailing 12 months actual earnings as opposed to unrealized estimated earnings 12 months out) is still 39x as 'twas at the end of 2019 ... which means -- given the Index is essentially now "unch" thus far in 2020 -- that Q4 Earnings Season is growthless;
■ The Gold/Silver ratio mid-week topped 90x, the white metal continuing to be regarded (like the red metal) as purely industrial ... whilst the yellow metal true to safe-haven form resiliently responds to all that's unintended, untoward, unknown.
And in the midst of all these abnormal (becoming normal?) goings-on, Sister Silver swooned to the downside tune of her divining "Baby Blues" -- as for the past two weeks we've proposed she would -- reaching down to our suggested structural trading support at 17.42 per the red line and arrow as shown on the right in the following two-panel graphic. And we 'spect that Gold on the left ought also have reached down to its red line at 1521 were the world not coming off the rails. The massive nugget is that upon Silver ultimately being rediscovered (for the umpteenth time) as money -- just ask any of your Athenian buddies from back in 2020 BC -- 'twill overwhelm Gold in upside percentage gain; (write it down):
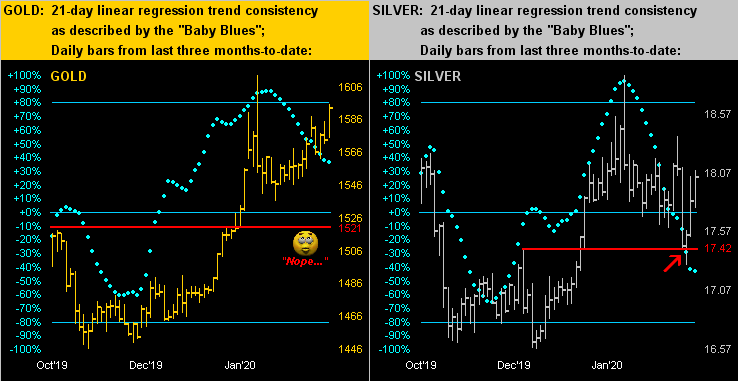
Indeed across the above three-month view, both Gold and Silver were in precious metal harmony for the first two, but are rather diverging as unexpected events ensue. To be sure, 'tis the safe-havens that rule as we turn to the BEGOS Markets Standings with the year's first month now through:

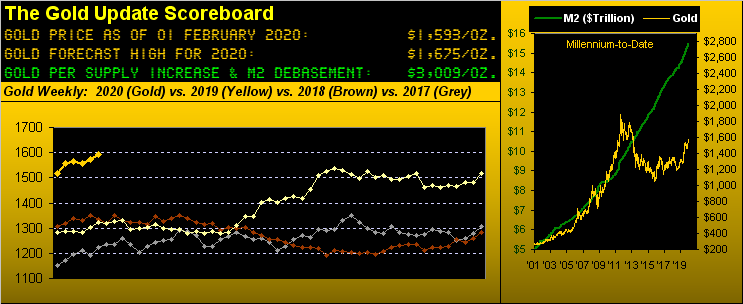
As listed, second only to the Bond (+5.3%) from one month ago-to-date in performance is Gold (+4.8%). But in looking to leverage amongst notable Gold equities in 2020, thus far the royalty company Franco-Nevada (FNV) is +17% and the mining company Newmont (NEM) is +10%. 'Course in reviewing Gold's equities brethren from one year ago-to-date, gains are all the more impressive: with Gold itself +20%, we've the Global X Silver Miners exchange-traded fund (SIL) +26%, NEM +42%, the VanEck Vectors Gold Miners exchange-traded fund (GDX) +43%, Agnico Eagle Mines (AEM) +59%, Pan American Silver (PAAS) +62%, and FNV +65%. That's a lotta percent. Here's the graphic:
As for Gold's own year-over-year view, here are the weekly bars, the rightmost parabolic Long trend steadily maintaining its upward stride per the rising blue dots. Moreover, note the dashed trendline: extend that present rate of ascent (+320 points annually) and Gold in a year's time would revisit its All-Time Closing High (from 22 August 2011) at 1900. 'Course the slope of the line shifts a bit from week-to-week, and to merely satisfy our forecast high this year for 1675 would be pretty neat. But since as far back as 2003, nary has a year gone by without some two-to-three stints of red-dotted parabolic Short trend being thrown in, just to keep us on our tradin' toes:
Now economically, the Barometer has had a pretty good upside run coming into 2020, indeed quite robust through the final quarter of 2019. However: reports of late haven't been as great, although the just-reported first peek at Q4 Gross Domestic Product of +2.1% annualized growth handily beat the consensus for just +1.8%; ('course since you follow the Econ Baro, you already knew Q4 nicely grew). But: this past week's reports divulged January's Chicago Purchasing Managers Index descending for the seventh time in the past 12 months; December's Personal Income and Spending and New Home Sales all slowed; and that month's Pending Home Sales were the weakest in six years. Thus the Baro (blue line) has keeled over a bit with the S&P 500 (red line) in tow (finally). As to whether 'tis just a beginner run -- or that for an expert -- remains to be seen:
As well, the yield curve is still quite flat from 1.33% for two-year dough to just 1.52% for ten years. The yield on the S&P 500 is 1.87% but with that comes the "Look Ma! No Earnings!" risk. Further, FedHeads are musing over a capping of Treasury yields toward keeping borrowing rates affordable as more states are experiencing economic shrinkage. One wonders if the next arrow in the StateSide opposition's quiver is for crashing the stock market with November's elections in the balance. (Got Gold?)
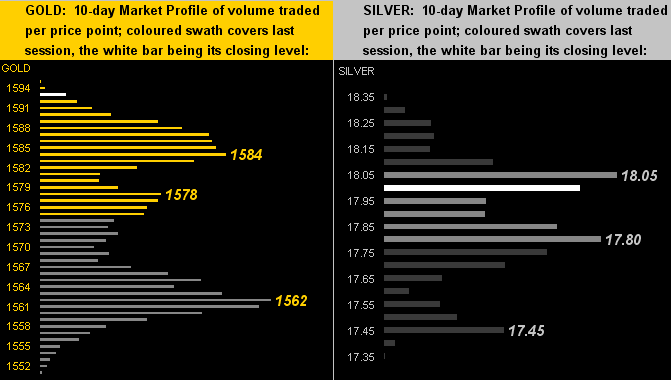
Turning to the precious metals' 10-day Market Profiles we've got Gold near the top of the stack (at left) with Silver instead off the boil toward mid-stack (at right). Labeled for both markets are their respective three most dominate trading prices for these past two weeks:
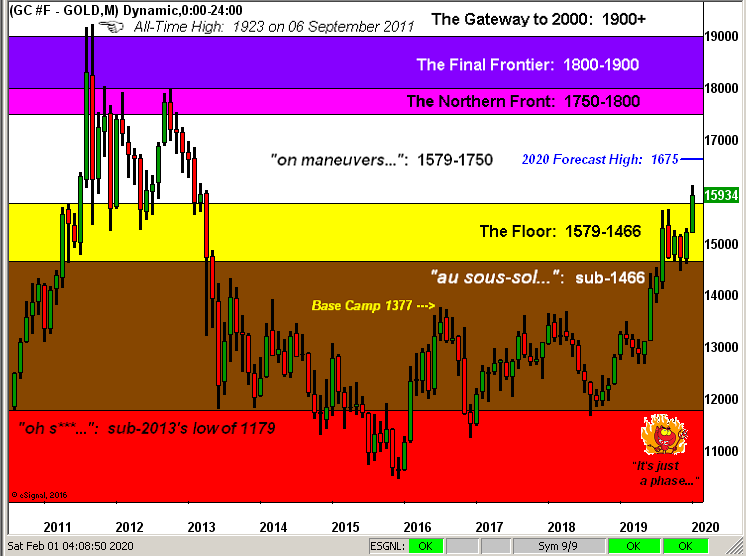
Towards this week's wrap and it being month-end, here we've the broad view of Gold's structure by the monthly bars across nearly 10 calendar years. And yes, 'tis true, Gold has moved up into the "on maneuvers..." category for the first time since falling from it during that wretched April of 2013. As denoted 'round the mid-point of this sector is our forecast high (in blue) for this year at 1675:
So that was January. And so 'tis said that "as goes January so goes the year", so forth and so on. 'Twas this millennium's 20th January, which for the S&P 500 since 2001 has been up 10 times and down 10 times, the latter being the case this time. So how accurately predictive is January for the year's S&P direction? Not very. Through the first 19 years of this millennium, (which for you counting-challenged folks out there was 2001 through 2019), January's direction has turned out to be the year's overall direction just 53% of the time, (10 for 19). So much for that January axiom, eh? Fortunately by currency debasement 'tis axiomatic that Gold's highest days are ahead. So bring on Groundhog Day, the Super Bowl, and absolutely the Gold course stay!
www.deMeadville.com
www.TheGoldUpdate.com
********

Mark Mead Baillie has had an extensive business career beginning in banking and financial services for two years with Banque Nationale de Paris to corporate research for three years at Barclays Bank and then for six years as an analyst and corporate lender with Société Générale.
For the last 22 years he has expanded his financial expertise by creating his own financial services company, de Meadville International, which comprehensively follows his BEGOS complex of markets (Bond/Euro/Gold/Oil/S&P) and the trading of the futures therein. He is recognized within the financial community of demonstrating creative technical skills that surpass industry standards toward making highly informed market assessments and his work is featured in Merrill Lynch Wealth Management client presentations. He has adapted such skills into becoming the popular author each week of the prolific “The Gold Update” and is known in the financial website community as “mmb” and “deMeadville”.
Mr. Baillie holds a BS in Business from the University of Southern California and an MBA in Finance from Golden Gate University.


