Who’s The Sucker?


You Have to Start Somewhere?
On Wednesday the Federal Reserve reduced (aka tapered) its monthly bond buying purchases by $10 billion from $85 billion to $75 billion. After the Federal Open Market Committee meeting outgoing Chairman, Ben Bernanke, said:
“Reflecting cumulative progress and an improved outlook for the job market, the committee decided today to modestly reduce the monthly pace at which it is adding to the longer-term securities on its balance sheet.”
He also commented that the Federal Reserve is committed “to doing what is necessary to get inflation back to target [increased back to 2%]” and “the action today [tapering] is intended to keep the level of accommodation the same overall.” [Emphasis ours]
To put into context the significance of what the mainstream media would have you believe is a meaningful change in Fed monetary policy, we present the following chart of the Federal Reserve’s Balance Sheet, courtesy of David Franklin at Sprott.

Source: Bloomberg and Sprott Asset Management
This chart shows two things. The first, and not so important, is how insignificant a $10 billion reduction in bond purchases really is. The second, and more important is, the colossal expansion of the Federal Reserve Balance Sheet since 2008.
Before introducing QE, the Fed’s balance sheet was only $940 billion. Currently, it sits at just under $4 trillion. And, a projection by Sprott places it at $5 trillion by the end of 2014.
If their forecast is correct, which is perfectly reasonable given the current rate of expansion, it would mean that between 2008 and the end of 2014, the Fed will have increased its balance sheet by 5 times! Keep in mind that it took the Fed 95 years, between 1913 and 2008 to grow its balance sheet to just under $1 trillion.
This is a massive amount of money printing. And, wherever this money goes, it’s going to raise the prices of whatever it touches.
We can already see the impact it’s having on U.S. stock markets as they bounce around in record territory on relatively low volume. The impact is also evident in bond markets where interest rates have reached historic lows.
For now, inflation is showing up in asset prices rather than ordinary goods and services. The Fed, based on their comments we quoted above, are not concerned about inflation showing up in goods and services, but they ought to be.
The Fed maintains that the purpose of its QE program is to stimulate economic growth and in the process create jobs. However, as we explained in our September 20th Weekly entitled “Ben Bernanke is just Stringing you Along”, the Fed is more concerned about suppressing interest rates and funding massive U.S. budget deficits than economic growth.
That’s not to say that they are not interested in economic growth. The Fed is trying to stimulate the economy, but not in the manner often reported (i.e. by providing liquidity to banks to spur lending).
In actuality, they are hoping that the effect of printing an unprecedented amount of new currency will debase the dollar and make U.S. exports cheaper, thereby stimulating the economy.
This explanation, however, is not palatable for U.S. trading partners, Treasury debt holders, or the general population so the alternate explanation is given.
A Sure Bet
Ben Bernanke is famous for saying that the Fed could “raise interest rates in 15 minutes if he had to.” It didn’t take 15 minutes on Wednesday!
Julia Coronado, the chief economist at BNP Paribus in New York and a former Fed economist commented in regard to the Fed’s tapering announcement, “as soon as they [the Fed] started talking about tapering, they raised interest rates.” [Context added]
In a previous Weekly, we presented the chart below which illustrates the affect comments made by Ben Bernanke, regarding tapering bond purchases, had on interest rates. The rise between the two red lines indicates roughly a 25% increase in borrowing costs for the 10 Year Treasury.
Now that the QE program will reportedly be tapered in January, interest rates have responded in a similar fashion. On Wednesday, the UST 10Y opened at 2.86% and closed at 2.89%, an increase of 1.48%. This trend continued for the rest of the week with the UST 10Y at 2.94%, reflecting a rise of 2.72% as of this writing.
Taking into consideration the time period when tapering was first hinted at, May 22 to today, Treasury rates have risen 31%.
Rising interest rates are a big problem for the Fed for a couple of reasons. The thousand words reflected in the chart below shows the first reason.
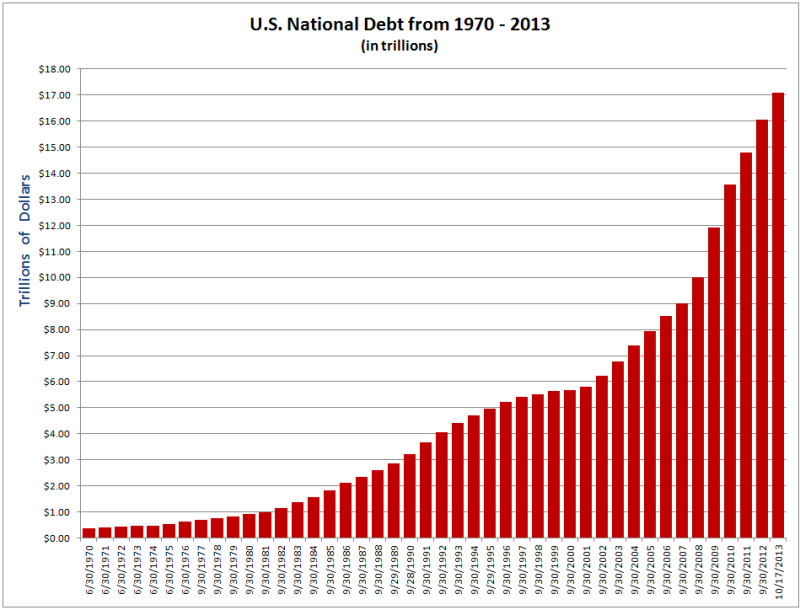
The approximate U.S. National Debt is currently a mind boggling US$17,252,995,875,875. The interest paid on this debt so far in 2013 is US$254,199,540,000 (i.e. $254 billion). If you haven’t seen the astonishing speed at which these two numbers are escalating check out: www.usdebtclock.org.
The above amount of interest represents 7.3% of the current U.S. budget of $3.49 trillion. Thus, any significant rise in interest rates on $17.3 trillion dollars spells t-r-o-u-b-l-e!
The second problem the Fed has with rising interest rates is the inverse relationship between interest rates and bond prices. The Fed holds just over $2 trillion in Treasury bonds, so when rates rise, their (and everyone else’s) Treasury holdings lose value.
The bottom line is, when you consider the real reasons for QE, the Fed can’t taper. It’s trapped. Therefore, interest rates must stay low. And in relative terms, given the almost imperceptible impact a monthly reduction of $10 billion has, as shown in the earlier Sprott chart, they haven’t done much in the way of tapering.
What they have done is more of the same posturing tactic, which we have talked about before, to try and sell the fiction that the economy is improving.
Suckers!
“Here’s the thing. If you can’t spot the sucker in the first half hour at the [poker] table, then YOU are the sucker” [Emphasis ours] – From the movie, Rounders
In our recent Weekly “The Game is over…” we presented the chart below, which shows the U.S. Debt, the Debt Ceiling, and the gold price over the last 14 years.
The chart clearly shows that the increase in U.S. debt has been matched by an increase in the price of gold, with of course, the exception of 2013.
With the continued trend of historic U.S. budget deficits resulting in rising debt levels and the likelihood of rising interest rates, the money printing party will have to continue. It’s already manifesting itself in the form of higher asset prices and it’s only a matter of time before it shows up in consumer prices.
On the international front, the tide of U.S. money printing has put enormous downward pressure on the dollar. This serves current U.S. policy well, as it makes exports cheaper and undermines the value of U.S. government debt. The trouble with this beggar-thy-neighbor policy is that other countries usually start doing the same in self-defense.
This is also known as the proverbial race to the bottom, in which countries engage in competitive devaluations in order to maintain an exchange rate beneficial to their own exports. As a result, tsunamis of international currencies flow all over the globe.
This is what explains the high inflation rates that have emerged in various countries (e.g. Brazil, Russia, and India). In economic terms, this process is known as importing inflation, in this case from the U.S.
Within this backdrop, it is intriguing to note which countries in the world hold the largest percentage of their foreign exchange reserves in gold.
In July, current Fed chairman Ben Bernanke told the Senate Banking Committee that “nobody really understands gold prices and I don’t pretend to really understand them either.”
In a similar committee meeting in July of 2011, he responded to a question from Congressman Ron Paul who asked the reason that central banks hold gold? Bernanke simply replied, “long-term tradition”.
These are odd things for a Fed Chairman to say, given the Federal Reserve is responsible for setting U.S. foreign exchange rate policy for which 72% of these reserves are held in gold.
Would you hire someone to manage the foreign exchange reserves of the U.S., of which 72% consists of gold, who publicly confesses to his bosses that they only own it for purposes of tradition and further that he does not understand the price trends of the asset?
Of course we don’t really believe Ben Bernanke when he says such things. We think this is simply an exercise in obfuscation and misdirection (aka Fed Speak). In fact, we know monetary officials value gold highly as a monetary reserve asset.
When Brett Arends, of the Wall Street Journal, asked the U.S. Treasury if it would consider selling some of the country’s gold reserves to pay the bills, their response was:
“Selling gold would undercut confidence in the U.S. both here and abroad…it would also be destabilizing to the world financial system.”
The curious part of all this is that the U.S. is devaluing the dollar, which everyone in the world must use to trade for major commodities, but will not officially sell an ounce of gold to fund historic budget deficits or pay down debt. Does that tell you anything?
Who are the real suckers?
Closing Thoughts
We have written extensively about China’s likely rapid accumulation of official gold reserves by their central bank, the People’s Bank of China (PBOC). Additionally, central banks around the world turned net buyers of gold in early 2009 for the first time in 20 years, in the aftermath of the Global Financial Crisis (GFC).
Although, the U.S. is reportedly not adding to its gold reserves, it is officially not selling them either, notwithstanding the likelihood that they have leased a significant amount of these holdings to major bullion banks.
This should tell investors a great deal about what central banks are expecting in the future and gold’s importance as a hedge against inflation and the potential loss in value of their other currency and sovereign debt holdings.
These risks have been heightened since the onset of the GFC as a result of the Fed’s unprecedented QE program and the subsequent competitive devaluation that has followed. It explains why central banks, especially from Eastern countries, have made gold a central pillar of their strategic monetary objectives over the last few years.
If the world’s central banks are preparing for a rainy day by accumulating and preserving their gold reserves, maybe you should own a little too.
Further, because the value of the yellow metal has been temporarily depressed, the publicly traded shares of gold producers are historically undervalued at the moment.
This makes it an opportune time to accumulate the shares of the most promising gold miners in anticipation of gold’s favorable supply and demand fundamentals reasserting themselves over the medium to long term. These shares will offer strong leverage to a rising gold price.
If you are looking to take advantage of this rare window of opportunity to buy low for the purpose of selling high, check out our Gold Miners Comparative Analysis Table , which has a multitude of critical metrics to use in evaluating and comparing gold mining companies.
You can find it by navigating to the version of this article posted on our website on the Weeklies page. Additionally, our Model Portfolio, available to paying subscribers, identifies the gold miners most likely to outperform as the price of gold rises.
That’s it for this week. Happy Holidays from all of us at Gold Miners!
RJ Wilcox


