Why You Shouldn’t Get Excited About Gold’s Mini-Rally


Gold seems to be sleeping off its latest mini-rally and lacks the momentum to reach new highs. What happens from here? Has the USD bottomed? And what does it mean when we factor in the EUR/USD pair and poor economic indicators from Europe into the equation?
Not much happened yesterday (Jan. 21), but what happened was relatively informative. And by “relatively” I mean literally just that. Gold moved lower yesterday and in today’s pre-market trading, doing so despite another small move lower in the USD Index. The moves are not big, but they are meaningful. They show that gold’s inauguration-day rally was likely a temporary blip on the radar screen instead of being a game-changer.
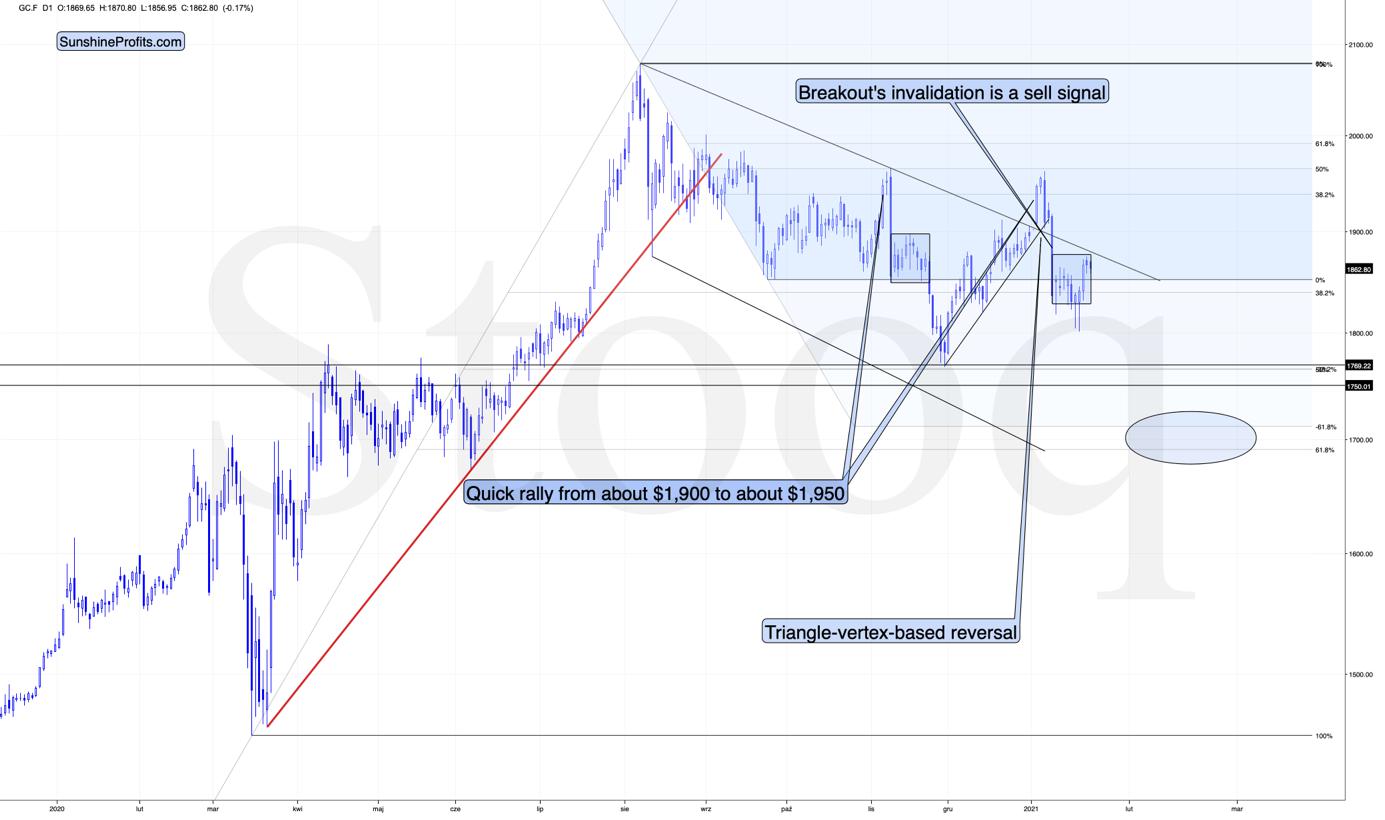
Figure 1 – COMEX Gold Futures
Looking at the above gold chart, I marked the November consolidation with a blue rectangle, and I copied it to the current situation, based on the end of the huge daily downswing. Gold moved briefly below it in recent days, after which it rallied back up, and right now it’s very close to the upper right corner of the rectangle.
This means that the current situation remains very similar to what we saw back in November, right before another slide started – and this second slide was bigger than the first one. Consequently, there’s a good reason for gold to reverse any day (or hour) now.
Besides, there’s also a declining resistance line just around the corner.
And that’s not even the most important thing. The most important thing is that based on the similarity to how things developed between 2011 and 2013, gold’s downward trajectory is likely to have periodic corrections at this time – up to a point where it simply plunges.
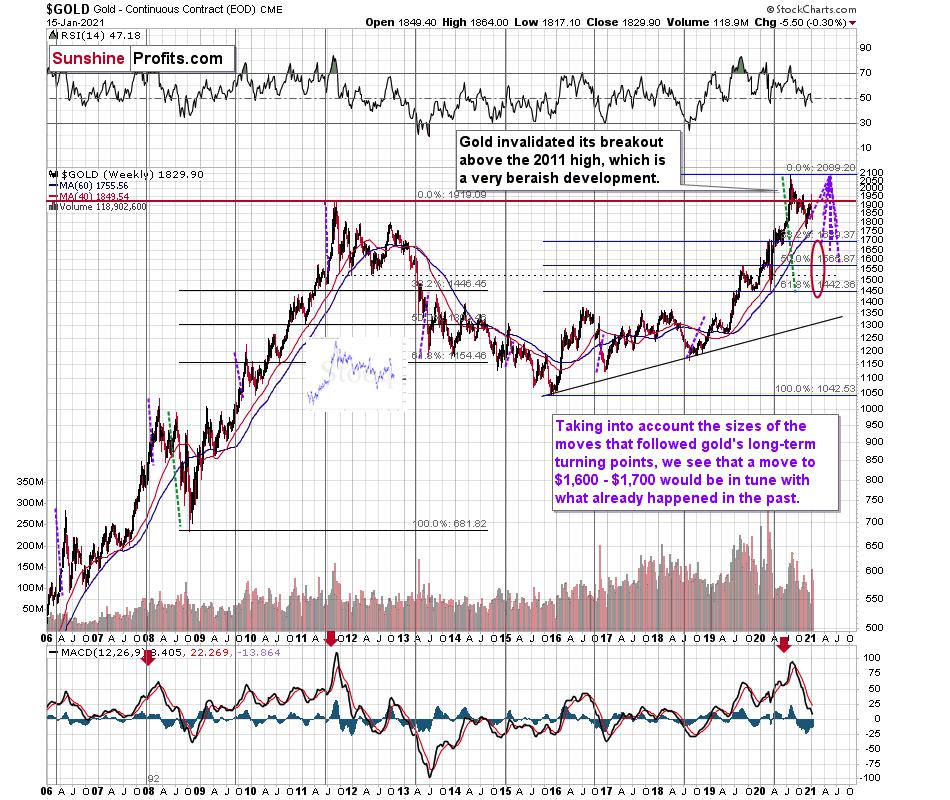
Figure 2 - GOLD Continuous Contract (EOD)
When the current situation is compared to what we saw about a decade ago, it shows what one should expect, assuming that the history repeats itself.
Gold kept on declining with corrections along the way until April. In April, the decline accelerated profoundly. The biggest problem with the latter was that practically nobody expected this kind of volatility. Those who were thinking that it’s just another move lower that will be reversed were very surprised.
Right now, you know in advance that a bigger move lower is likely just around the corner, and you won’t be surprised when it comes. Whether we have to wait an additional few days or first see gold rally by $10 or $30 is not that important, if it’s about to slide $150 and then another $200 or so.
I would like to add that gold is declining today and based on the similarity to the November consolidation, it’s exactly the day when we should expect to see a decline. Of course, the similarity doesn’t have to persist, and the history doesn’t have to repeat itself to the letter, but what’s happening right now seems to be confirming the analogy in a considerable way. This means that more declines are likely just around the corner. If not immediately, then shortly.
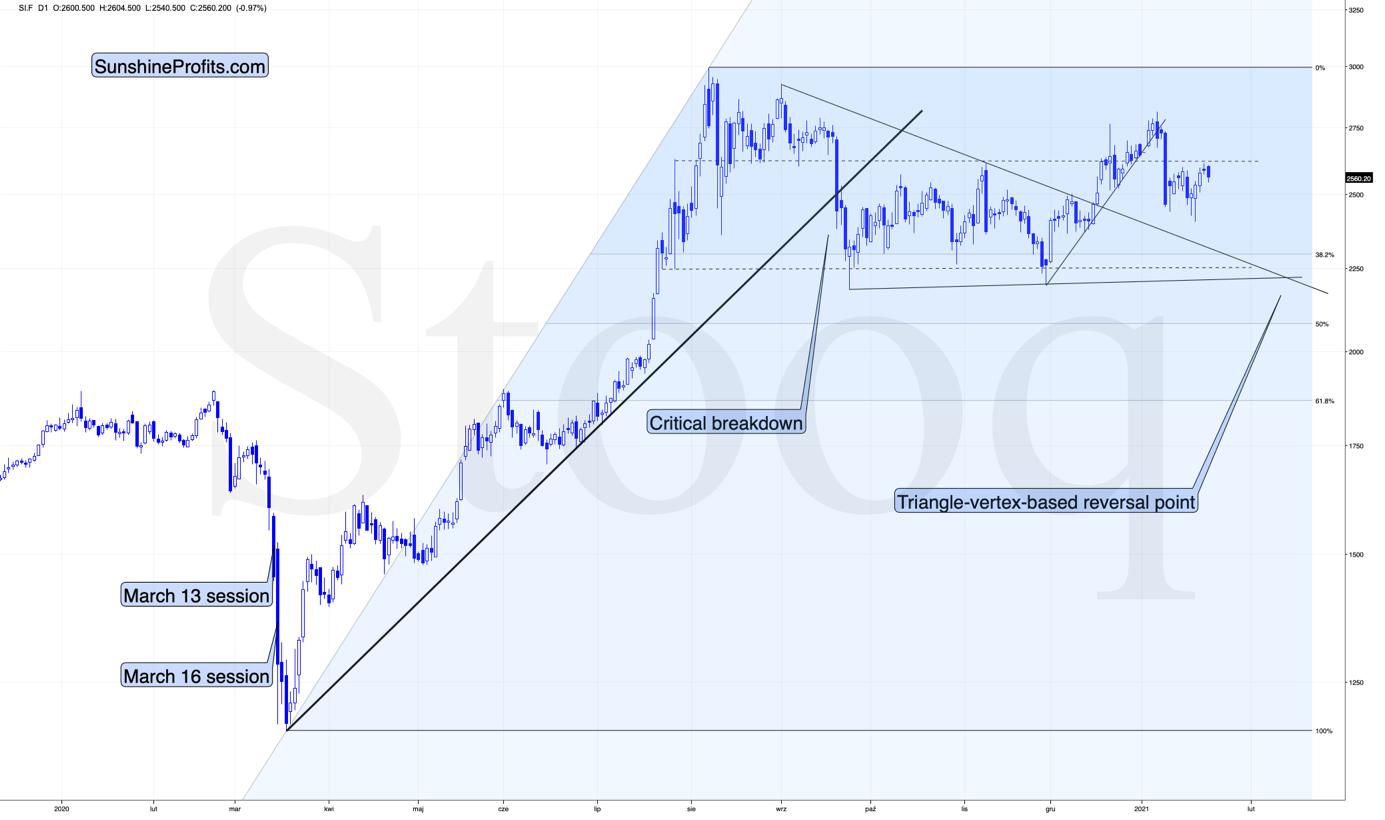
Figure 3 - COMEX Silver Futures
Silver turned south after reaching (approximately) the price level that stopped the rally in July and November 2020, and also earlier this year. This seems relatively natural and the outlook for silver remains bearish for the next several weeks.
Silver corrected a bit more of this year’s downswing than gold, which is normal given the bearish outlook. The same goes for miners’ underperformance. Let’s keep in mind that silver’s “strength” is temporary – once the decline really starts, and it moves to its final part, silver is likely to catch up big time.
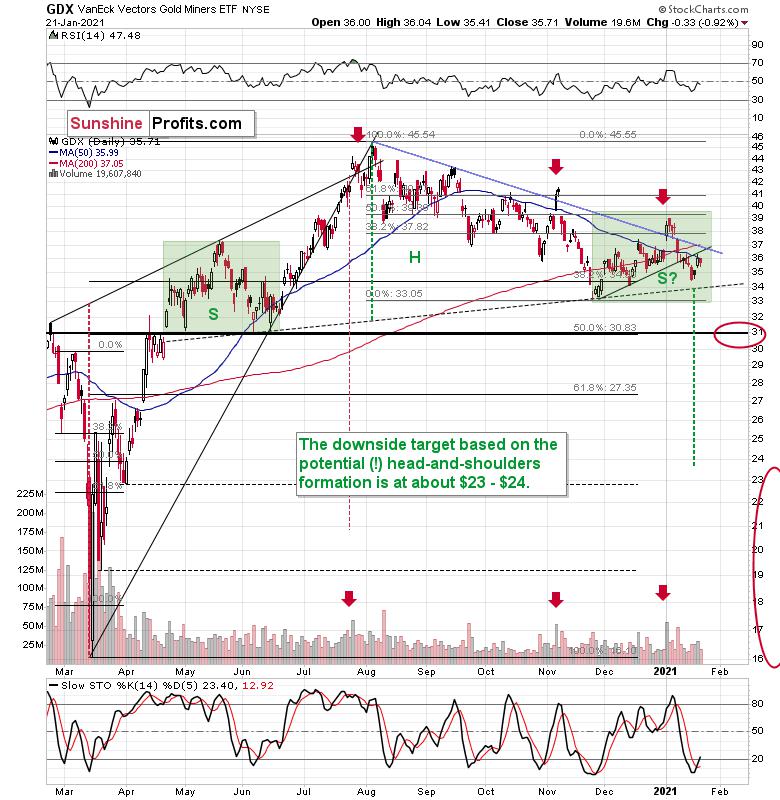
Figure 4 - VanEck Vectors Gold Miners ETF
As far as the miners are concerned, mining stocks didn’t correct half of their 2021 decline. They didn’t invalidate the breakdown below the rising support line, either. In fact, the GDX ETF closed yesterday’s session below the 50-day moving average. Technically, nothing changed yesterday.
Please note that the November – today consolidation is quite similar to the consolidation that we saw between April and June (see Figure 4 - green rectangles). Both shoulders of the head-and-shoulder formation can be identical, but they don’t have to be, so it’s not that the current consolidation has to end at the right border of the current rectangle. However, the fact that the price is already close to this right border tells us that it would be very normal for the consolidation to end any day now – most likely before the end of January.
If we see a rally to $37, or even $38, it won’t change much – the outlook will remain intact anyway and the right shoulder of the potential head-and-shoulders formation will remain similar to the left shoulder.
However, does the GDX have to first rally to $37 or $38 to decline? Absolutely not. It could turn south right away, thus surprising most market participants.
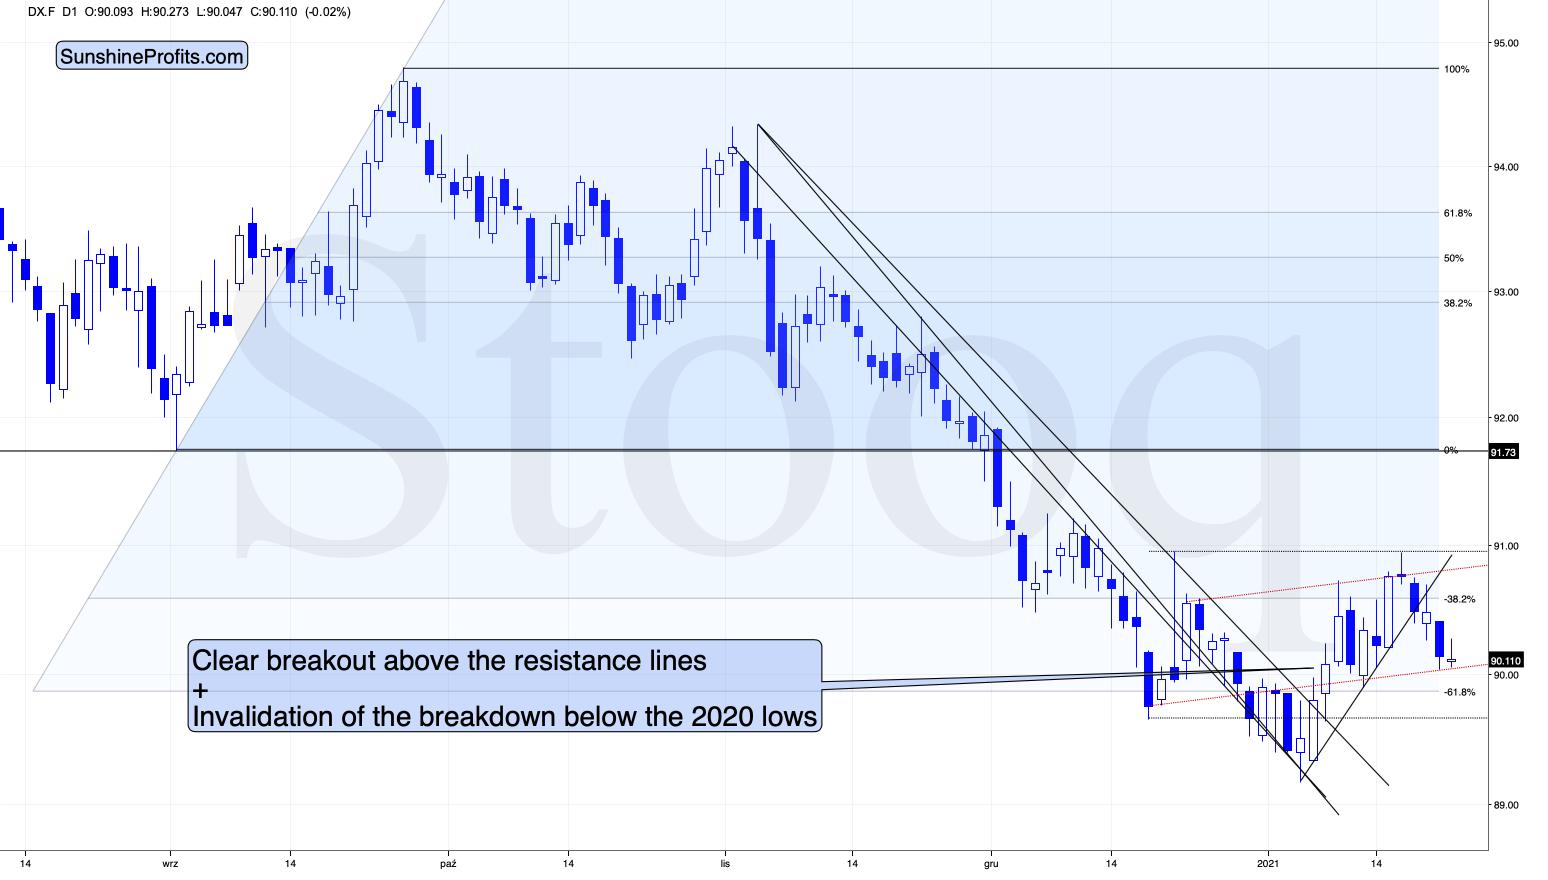
Figure 5 – USD Index
In Tuesday’s (Jan. 19) analysis , I commented on the above USD Index chart in the following way:
The USD Index is after a major breakout above the declining resistance lines and this breakout was confirmed. Consequently, the USD Index is likely to rally, but is it likely to rally shortly? The answer to this question is being clarified at the moment of writing these words, because the USD Index moved back to its rising short-term support line that’s based on the 2021 bottoms.
If the USD Index breaks below it, traders will view the 2021 rally as a zigzag corrective pattern and will probably sell the U.S. currency, causing it to decline, perhaps to the mid-January low or even triggering a re-test of the 2021 low.
If the USD Index performs well at this time and rallies back up after touching the support line, and then moves to new yearly highs, it will be then that traders realize that it was definitely not just a zigzag correction, but actually the major bottom. In the previous scenario, they would also realize that, but later, after an additional short-term decline.
It’s now clear that the former scenario is being realized. The support levels that could trigger the USD’s reversal are based on the potential inverse head-and-shoulders pattern – the red line that’s slightly above 90, and the horizontal line that’s slightly below it. It’s also possible that the USD Index tests it yearly lows. None of the above would be likely to change the outlook for the precious metals sector, at least not beyond the immediate term.
Later yesterday (Jan. 21) and also in today’s overnight trading, the USD Index moved to the upper of the above-mentioned support lines. Is the bottom already in? This seems likely, but it’s not crystal-clear yet. However, it doesn’t really matter, because the precious metals market responded to the USD’s strength for just one day (in a meaningful way that is) and taking a closer look at that day reveals that it was not the USDX’s performance that gold reacted to, but to the underlying news – the inauguration-day-based uncertainty. So, even if the USD Index declines some more here before soaring, gold doesn’t have to move significantly higher. In fact, it would be unlikely to do so.
Stocks have rallied, and based on this rally, the weekly RSI moved close to 70 once again.
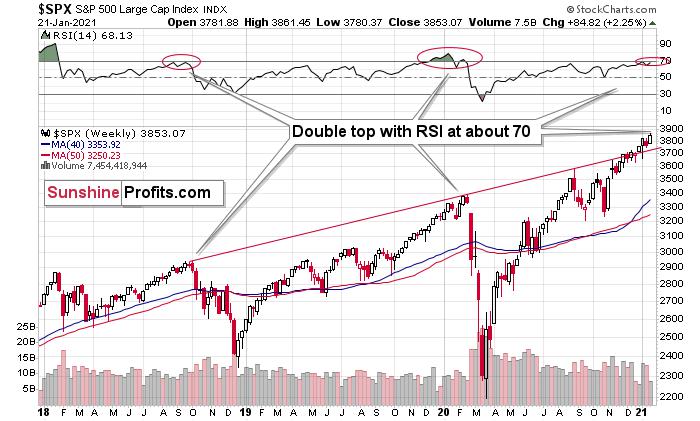
Figure 6 – S&P 500 Index
This is important because the last two major declines were preceded by this very signal. We saw the double-top in the RSI at about 70, exactly when the stock market started its big declines, and we’re seeing the same thing right now. If this was the only thing pointing to much lower stock values on the horizon, I would say that the situation is not so critical, but that’s not the only thing – far from it. Before moving to these non-technical details, let’s recall why the stock market analysis and the USD index analysis matters for precious metals investors and traders.
The analyses matter because gold, silver, and mining stocks are likely to decline in parallel with a decline in stocks and the USD’s rally. This is likely to take place up to a certain point, when precious metals show strength and refuse to decline further despite the stock market continuing to fall and the USDX continuing to rally. This kind of performance happened many times, including in the first half of last year.
Since the S&P 500 futures are down in today’s overnight trading, perhaps we have indeed seen a top. Even if not, it doesn’t seem that one is very far away, based on how excessive the situation looks from the fundamental point of view. Let’s discuss some of those non-technical issues.
Mind Over Matter
Despite Janet Yellen’s recent assertion that “the United States does not seek a weaker currency,” her tongue-in-cheek comments are actually doing just that. The newly minted U.S. Treasury secretary urged lawmakers to “act big” with regard to prospective stimulus, saying that the benefits “far outweigh the costs.”
And since her worst-kept secret became public on Jan. 18, the USD Index has been under fire ever since. Furthermore, as her words instill the EUR/USD with borrowed confidence, the precious metals are displaying the same bold behavior.
Please see below:
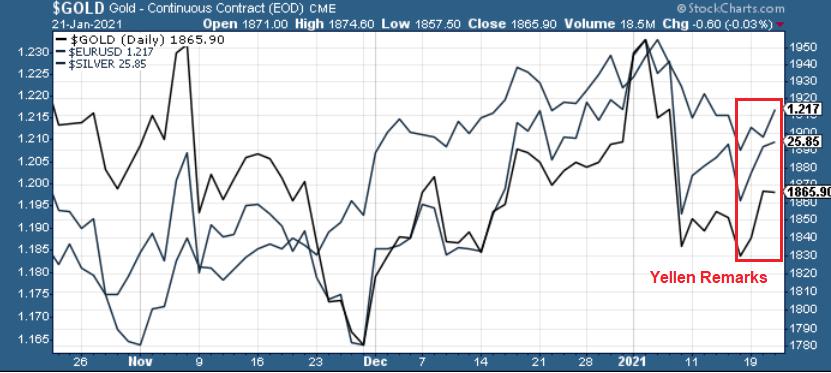
Figure 7
However, despite the narrative overpowering reality, the Eurozone fundamentals don’t support the recent rally. And why is this important? Because as you can see from the chart above, as goes the EUR/USD, so go the PMs.
Yesterday, European Central Bank (ECB) President Christine Lagarde revealed that the Eurozone economy likely shrank in the fourth quarter – all but sealing a double-dip recession.
Please see below:
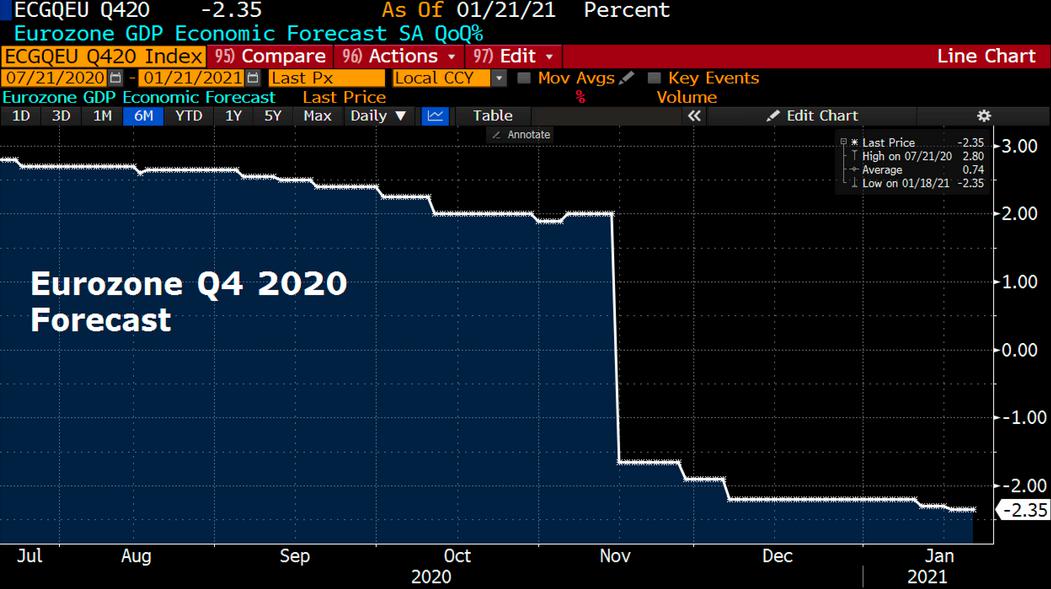
Figure 8 – (Source: Bloomberg/ Holger Zschaepitz)
In contrast, the Federal Reserve Bank of Atlanta’s GDPNow forecasting model (as of Jan. 21) has the U.S. economy expanding by 7.5% in Q4. Furthermore, even if we take the Atlanta Fed’s estimate with a grain of salt, the Blue Chip consensus (forecasts made by private-sector economists) is for growth of nearly 4.0% (tallied as of early January). And even more telling, economists with a bottom 10% Q4 GDP forecast ( see Figure 9 - the shaded light blue area below) still expect positive growth.
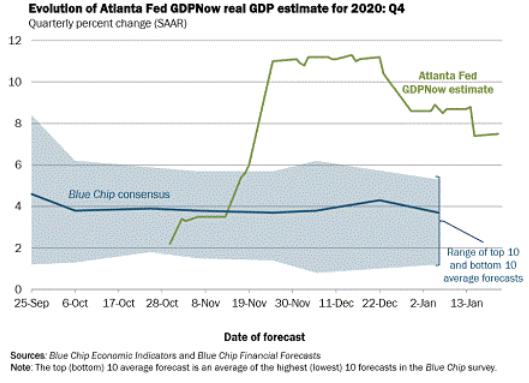
Figure 9
The bottom line?
We can now add the Eurozone GDP to the long list of relative underperformances.
Expanding on the above, European consumer confidence (released yesterday) went backwards again in January and is now less than 10 points above its April low. Furthermore, the current reading is still well-below the long-term average.
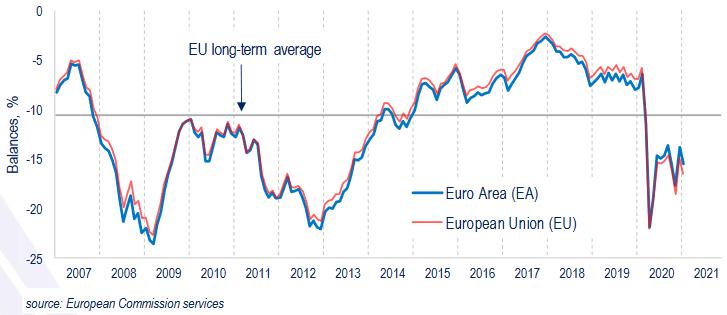
Figure 10
On Jan. 8, I highlighted the significant divergence between European CPI and U.S. CPI (inflation). For context, European CPI was – 0.30% in December (negative for five-straight months), while U.S. CPI was 0.40% in December (positive for seven-straight months).
I wrote:
Weak CPI is a precursor to a weaker euro. Why so? Because since asset purchases fail to produce any real economic growth, the ECB will be forced to lower interest rates to stimulate the economy. As a result, the cocktail of paltry economic activity and lower bond yields leads to capital outflows as foreign (and domestic) investors reallocate money to other geographies (like the U.S.). Thus, capital will likely exit the Eurozone and lead to a lower EUR/USD.
And today?
Well, it’s exactly what the ECB is doing.
Due to the economic malaise confronting Europe, the ECB is targeting its bond-buying activity toward financially weaker counties (like Italy) as opposed to financially stronger countries (like Germany). Essentially, it’s conducting a shadow operation of yield curve control (YCC).
Please see below:
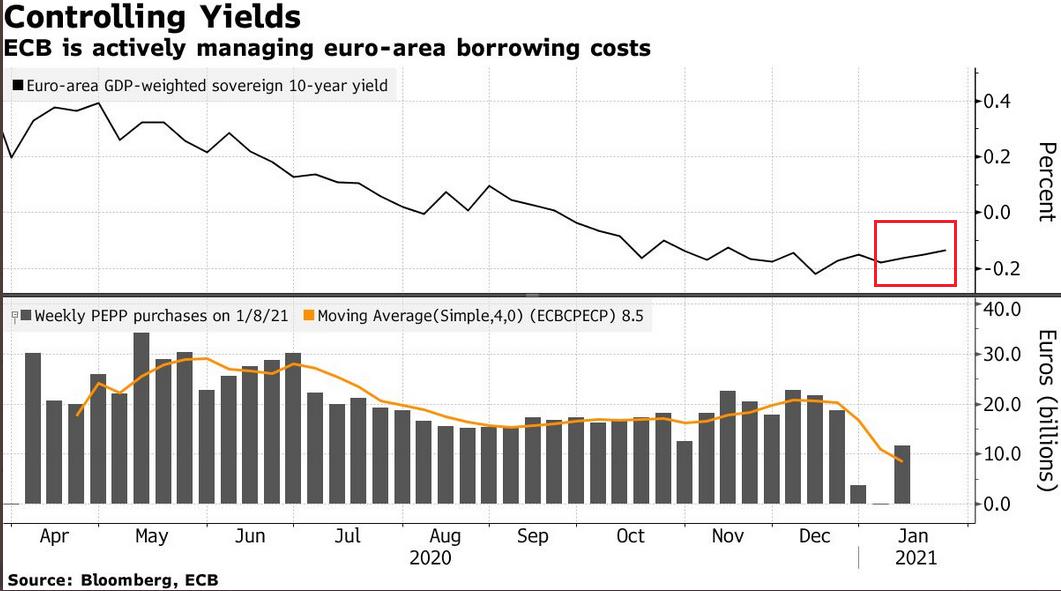
Figure 11
If you analyze the red box above, you can see that Europe’s weighted-average bond yield has increased in 2021. And why is this happening? Because as Europe’s economic deterioration merges with Italy’s fiscal plight, this cocktail has made European bonds riskier, and thus, investors demand a higher interest rate. And while higher interest rates are bullish for a country’s currency when they’re a function of economic growth, a crisis-like spike in yields (due to solvency concerns) means the exact opposite.
Furthermore, if you follow the gray bars at the bottom-half of the chart, the ECB actually decreased its bond purchases toward the end of December (2020), Then, once January hit (2021), it was back to business as usual.
As a result, the ECB’s attempt to scale back its asset purchases was (and will be) short-lived. And as the economic conditions worsen, the money printer will be working overtime for the foreseeable future.
To that point, Bloomberg Economics expects the ECB to purchase €15 billion worth of bonds per week until 2022 – more than doubling its pandemic emergency purchase program (PEPP) to nearly €1.85 trillion.
Please see below:
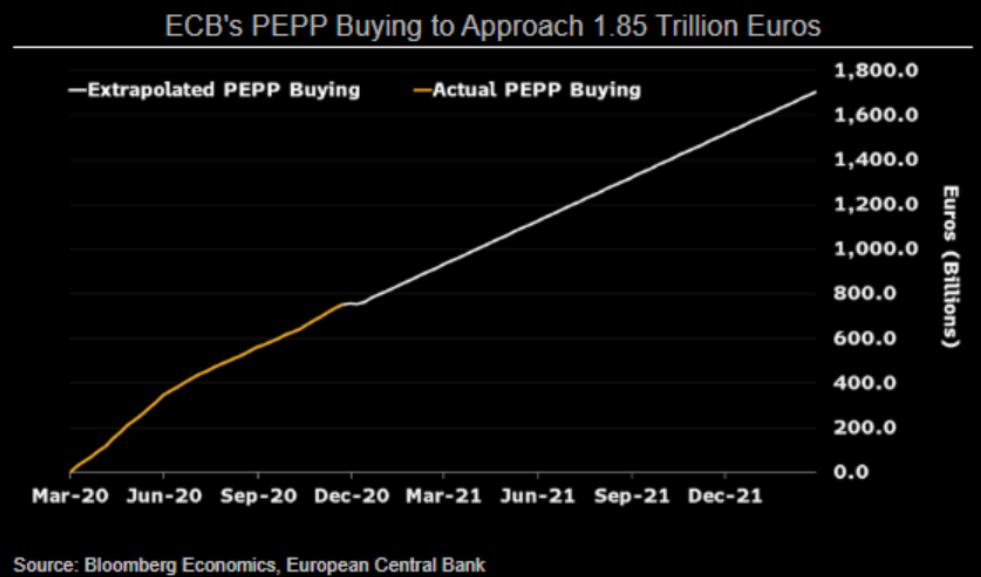
Figure 12
And in real-time?
Well, the ECB’s balance sheet hit another record-high on Friday (Jan. 15) – with total holdings still at 69% of Eurozone GDP (nearly double the U.S. Fed’s 35%).
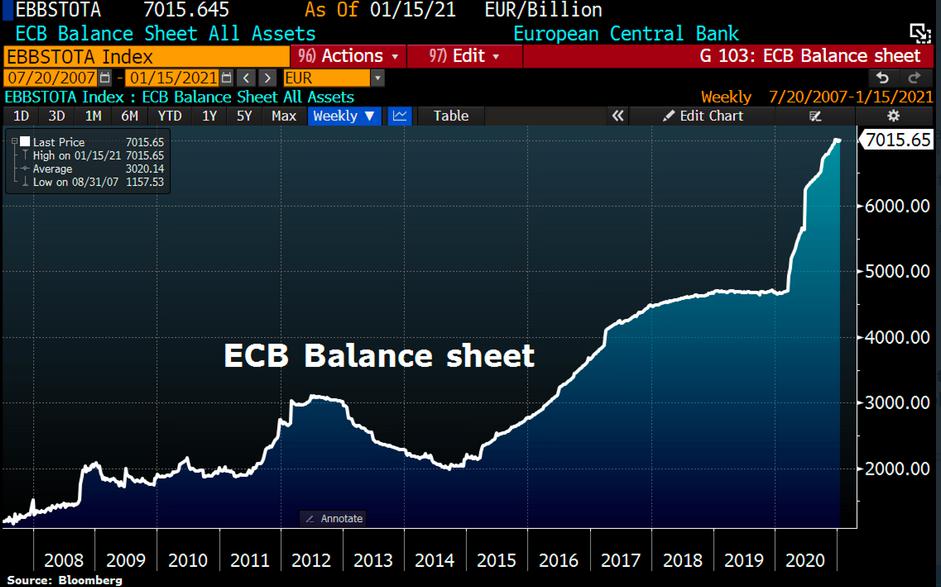
Figure 13
And why does all of this matter?
Because, as I highlighted on Jan. 12, the ECB’s relative outprinting is a precursor to a lower EUR/USD.
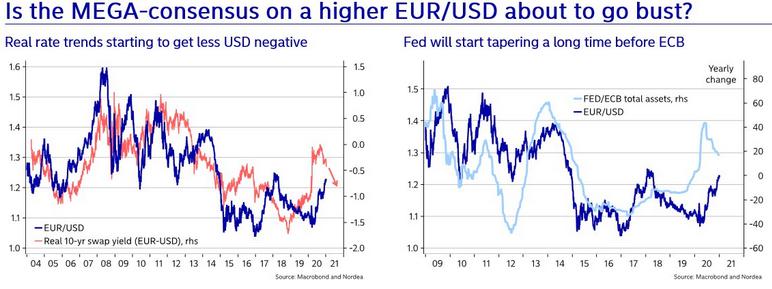
Figure 14
I wrote:
Turning to the second chart (Figure 6 - on the right), notice how the EUR/USD tracks the FED/ECB ratio? To explain, the ratio (the light blue line) is calculated by dividing the U.S. Federal Reserve’s (FED) balance sheet by the European Central Bank’s (ECB) balance sheet. Essentially, its direction tells you which monetary authority is printing more money. If you analyze the EUR/USD (the dark blue line), it trades higher when the FED is out-printing the ECB (the light blue line is rising) and trades lower when the ECB is out-printing the FED (the light blue line is falling). The key takeaway? With the light blue line falling, it means that the ECB is outprinting the FED . And if this dynamic continues, the EUR/USD (the dark blue line) should move lower as well.
The top in the FED/ECB total assets ratio preceded the slide in the EUR/USD less than a decade ago and it seems to be preceding the next slide as well. If the USD Index was to repeat its 2014-2015 rally from the recent lows, it would rally to 114. This level is much more realistic than most market participants would agree on.
In conclusion, the EUR/USD’s recent strength is built on a foundation of sand. Instead of following the hard data, traders are letting the narrative cloud their judgment. Moreover, due to their strong correlation with the EUR/USD, gold and silver are falling into the same trap. However, once the semblance of strength evaporates, a decline in the EUR/USD is likely to usher a move lower for the PMs. Furthermore, with gold already approaching the upper trendline of its November consolidation channel, the momentum may wane sooner rather than later.
Thank you for reading our free analysis today. Please note that the above is just a small fraction of today’s all-encompassing Gold & Silver Trading Alert. The latter includes multiple premium details such as the targets for gold and mining stocks that could be reached in the next few weeks. If you’d like to read those premium details, we have good news for you. As soon as you sign up for our free gold newsletter, you’ll get a free 7-day no-obligation trial access to our premium Gold & Silver Trading Alerts. It’s really free – sign up today.
Przemyslaw Radomski, CFA
Founder, Editor-in-chief
Sunshine Profits: Effective Investment through Diligence & Care
* * * * *
All essays, research and information found above represent analyses and opinions of Przemyslaw Radomski, CFA and Sunshine Profits' associates only. As such, it may prove wrong and be subject to change without notice. Opinions and analyses are based on data available to authors of respective essays at the time of writing. Although the information provided above is based on careful research and sources that are deemed to be accurate, Przemyslaw Radomski, CFA and his associates do not guarantee the accuracy or thoroughness of the data or information reported. The opinions published above are neither an offer nor a recommendation to purchase or sell any securities. Mr. Radomski is not a Registered Securities Advisor. By reading Przemyslaw Radomski's, CFA reports you fully agree that he will not be held responsible or liable for any decisions you make regarding any information provided in these reports. Investing, trading and speculation in any financial markets may involve high risk of loss. Przemyslaw Radomski, CFA, Sunshine Profits' employees and affiliates as well as members of their families may have a short or long position in any securities, including those mentioned in any of the reports or essays, and may make additional purchases and/or sales of those securities without notice.
*********
 Przemyslaw Radomski, CFA, is the founder, owner and the main editor of SunshineProfits.com. You can reach Przemyslaw at: http://www.sunshineprofits.com/help/contact-us/.


