Widgets vs Greenback Dollars


The real gross domestic product (GDP) is an inflation-adjusted measure that reflects the value of all goods and services produced by an economy in a given year (Investopedia). Inflation is the rate at which prices increase over time, resulting in a fall in the purchasing value of money (Google. When this all is examined a little closer, it is clear that since the mid-1990s these definitions conceal that is relevant for someone who wants to determine how inflation today affects our lives as well as the economy. This lack of clarity brings us to a Fool…when you call someone a fool, you either mean he's gullible or just a run-of-the-mill idiot (Vocabulary.com). On the subject of inflation and GDP it seems most of us live in a fool’s paradise.
That statement, unless supported by solid evidence, is fighting talk. So allow me to explain. In a world where an official CPI properly reflects the increased cost of living as consumer prices increase and it – or a suitable equivalent – is used to determine the real GDP, an increase of x% in the GDP implies that the total quantity of goods produced and services rendered, have increased by x%. Note that this statement refers to ‘quantity’ in a material sense, not to ‘value’ as measured in dollars in an economic sense as the GDP definition has it. The material concept of ‘quantity’ and the dollar ‘value’ do not measure the same aspect of an economy.
Ideally, anyone that gives it some thought would prefer that the quantity and value aspects of their economy remain in step; so that when one increases the other does so to the same degree. That would be a situation that is effectively inflation neutral even when prices are increasing. Unfortunately we do not live in an ideal world. A simple example will explain the principle involved.
Last year, a corporation made and sold 10 million widgets at $100 each for sales of $1 billion. This year they bring out a new model which is priced at $112 each. In olden times, the increase of $12 dollars would have been used to in the calculation of the CPI according to the weight of widgets in the basket used for the CPI. That would have increased the CPI to reflect inflation corresponding to the 12% increase in the price, allowing the CPI to also serve as a cost of living index.
Now, however, the government’s inspectors of quality changes take note of the fact that the new widget, while basically doing the exact same thing for the user as the older model, is not exactly the same. It now comes in 6 colours, not 4; the paint is more durable, while the legs are longer by two inches to adjust for an increase in the average length of women over the past 15 years. The angle of the legs have also been increased by 5 degrees for better stability. The warranty is now 1 year and not only 6 months and the corporation will refund the cost to return widgets that are not working properly, provided that the unit was then found to have failed because of a manufacturing problem, not because it had been abused.
After a brief discussion, the inspectors assigned a dollar value to each improvement from the perspective of potential purchasers. The total value of the improvements to the widgets is estimated to be $9/unit. That meant the contribution of the price increase to official inflation is only $3/unit. However, since widgets are not essential items in a consumer household, the price increase meant sales did not reach the 10 million units of last year, but fell short by 30 000. The corporation nevertheless still showed an increase in revenue to $1086.4 million for an increase of 8.6%, which is more than enough to make Wall Street happy.
This increase also boosted nominal GDP by $86.4 million. It so happened that after the government inspectors processed the full list of consumer price increases using their best estimated of quality improvements, the official CPI was the same as what they applied to the widgets, 3%. That result meant the contribution of the Widget corporation to the real GDP was now 8.38% more than that of the previous year, at almost $84 million. This achievement was quite similar to most other corporations so that the government was very happy, Wall Street was happy, owners of Widget was happy and the only ones not so happy were the employees of Widget who had received increases of only 3%, right at the official CPI.
What then can the problem be when just about anyone of any consequence in the national economy is so happy with the performance of Widget and a majority of the other corporations – as these people in real life happen to be? The GDP is up nicely; good corporate profits (in part because increases in employees cost was kept level pegged with the CPI) have the price of Widget shares up handsomely and the stock options are worth a lot more. Does the fact that this year only 970 000 widgets, 3% fewer than the year before, were manufactured trigger any concern anywhere? Or that what happened this year extends a 20 year cumulative trend? Not yet.
It so happens that when the increase in the GDP plus the CPI, which is the official increase in prices, is less than the actual increase in prices, then the physical or material volume of production declines. In the example, the sum of the increase in the GDP and the CPI is 11.38%, which is less than the 12% price increase. Thus the number of widgets produced declined by 3%.
In order to apply this model to a real economy, one must have reasonably accurate data on actual price increases as a weighted index. The Chapwood Index provides price changes on a large number of consumer items as an un-weighted index for 50 US cities. During the past five years the average increases in the price indices for the cities range from about 7% to 13%.
John Williams calculated the CPI using its 1980 formulation for the period to 2019 in comparison to the official CPI. If the alternate CPI is used as a measure of price increases, the chart conforms quite closely to the Chapwood index. Data on the US GDP from the Federal Reserve database from about the turn of the century until the start of the financial crisis, shows the GDP initially ranged from 3% to 6%, but from 2008 to 2017 or 2018 this dropped to about 2% to 4%.

The table shows the ranges for the CPI and GDP for two periods since 2000, before and after the financial crisis.
The sum of the official CPI and the GDP from 2000 to 2007 at best and on occasion is in the same range as the increases in consumer prices. This implies a gradual, perhaps not consistent, decline in the volume of US material GDP during this earlier period.
However, since 2008 there has been a marked increase to about 3-4% between the sum of the CPI and GDP and the range of price increases. The implication is that during the two Obama terms and the early Trump presidency, the real US economy shrunk consistently by a few percent each year, with 2018 possibly close to being a breakeven year to show some improvement. Recent low inflation values could place the economy back in jeopardy if growth does not pick up soon and price increases continue at about the same rate as during the past few years.
One could speculate on the basis that the table is slightly optimistic and that the artificially low CPI since the mid 1990s have contributed to more optimistic GDP values than is warranted by the material production of the economy. If so, this may explain the decline in the participation rate of the workforce in the economy on the premise that consumer demand declined as household incomes failed to keep pace with the real cost of living. Use of credit could help close the gap until the financial crisis, after which many marginal households were less able to employ more debt to compensate for the increasing deficit in their finances as incomes lagged prices.
Early indications are that with Trump in the White House US economic growth has shown some signs of life, but not yet enough to compensate for the high rate of price increase – which latter is the result of business people knowing they can set higher prices that thanks to the new CPI does not awaken the inflation boogeyman and thereby invite higher interest rates.
This fool’s paradise is expected to continue as long as the artificially low CPI is used to set wage and salary increases and also to justify low interest rates that result in the misallocation of capital. The trends behind the establishment of this artificial economy in which we live cannot continue indefinitely. As Stein has famously said, in that case they will stop. It is expected that the stopping will not be a pretty sight. The difference for the US economy between widgets and dollars, everyone focusing only on the dollar, will impoverish not only employee households, but the economy as a whole. On the global playing field, the latter will develop into a disaster.
On the standoff in the trade war with China, most commentators seem to think that China is in the more vulnerable position because of their national debt, which they compare with their GDP. My thoughts on this is that if one were to revalue the yuan to bring the salaries of, say, their teachers, engineers and assembly line workers in line with what their Americans equivalents earn, their GDP would be in the number one global position. I also wonder how their national debt/capita would compare, seeing that they are still dragging millions of people into the middle class. Finally, what does China have to face in terms of unfunded obligations coming due, a large portion of the population not employed and pension funds actuarially under water?
I think that these considerations make it more of an even situation between the two countries. There is also the Chinese obsession with never losing face to counter-act the American commitment to be the winner in all situations. It would therefore not be a surprise to find that the increased import tariffs are more likely to become a tit for tat affair than for one to hope for Chinese capitulation. I fear that based on my view of the situation there is too high a probability of the standoff lasting too long and becoming too confrontational for the economic health of both countries.
The key difference if push should come to shove, I think, is that, when considering how they behaved during the late 1930s in the war with Japan, the Chinese people are conditioned to stand united and willing to accept great hardship to achieve their goals. When threatened by outside forces they have not capitulated, but held firm come what may, letting the chips fall where they do. At whatever cost to them.
Which is why I am truly concerned with a situation which relates to the traditional question of what happens when an irresistible force meets an immovable object. There is no winner possible; only losers all round.
On the technical front it interesting how many of the charts show that the prices have held either to consistent and lasting trends, that are also contained in patterns which constrict prices into ranges that decrease in size over time. It is as if there is a time not too far off when these trends will change. Perhaps with a vengeance in some dramatic way? Ought to be interesting if that does lie in the near future.
Euro–Dollar
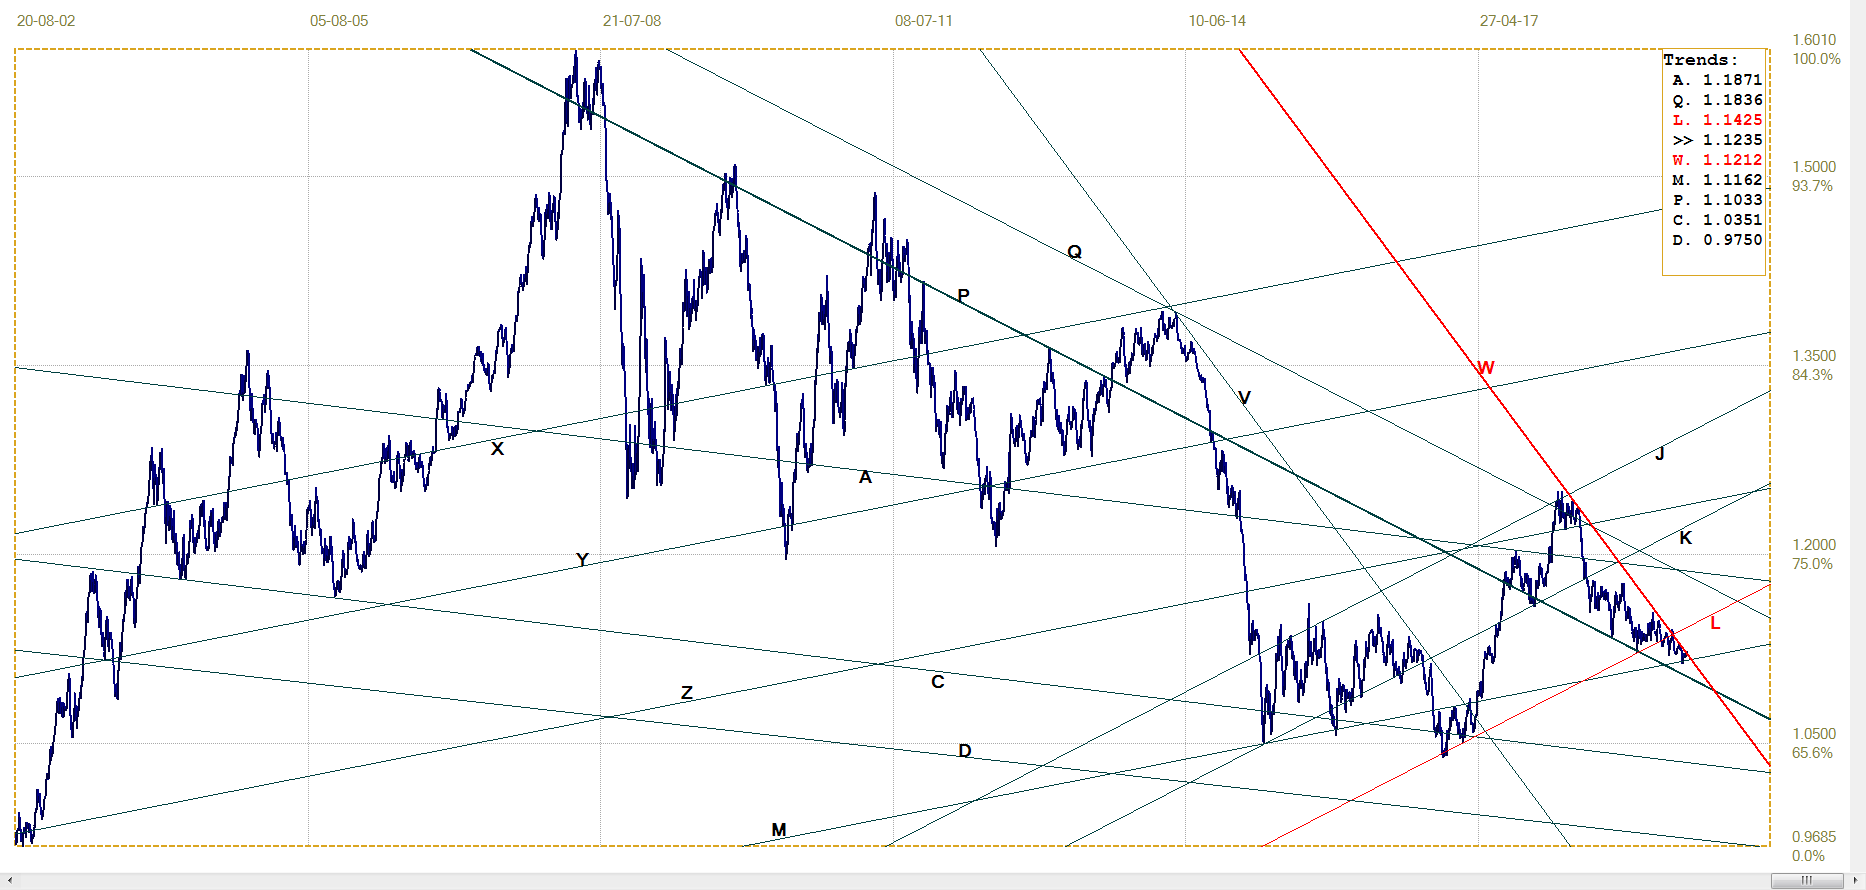
Euro–dollar, last = $1. 1235 (www.investing.com)
Here is one of the charts where the price has held along a steep resistance for far longer than one might have suspected. Not only is the trend holding tight along the steep resistance, but it is also holding back from challenging the support that has proven to be substantial, with the only break lower a clear bifurcated bottom, which acted as a reversal pattern. The resulting rally was quite steep until the euro became trapped in pennant PW ($1.11212) with Friday’s close just a fraction higher out of the pennant, having managed not to break clear below line M ($1.1162).
Pennant formations that are well-defined – as this one is - have a good record of developing to the full five-leg pattern before the break happens. Much less often, they break prematurely in the right direction at the end of leg 4, but without having completed leg 5. Such premature breaks, as could be happening here, tend to be steep and sustained.
DJIA Daily Close
Now that the DJIA has reversed lower off the resistance along the top of bearish channel PQR (26 584), the previous high at 26 828.39 on 3 October last year is beginning to look safe from the current rally. Also, at the top of sideways channel AB (26 712) came within 0.5% of a challenge, but failed to persevere and fully test the resistance.
The appearance of the chart is of having made a triple top even though the three top reversals are not accurately at the same level. A triple top owes more, I think, to its psychological effect than to actual technical relevance. After a third attempt to extend a longer term rally has failed, it becomes assumed in the subconscious that the market does not want to extend higher.
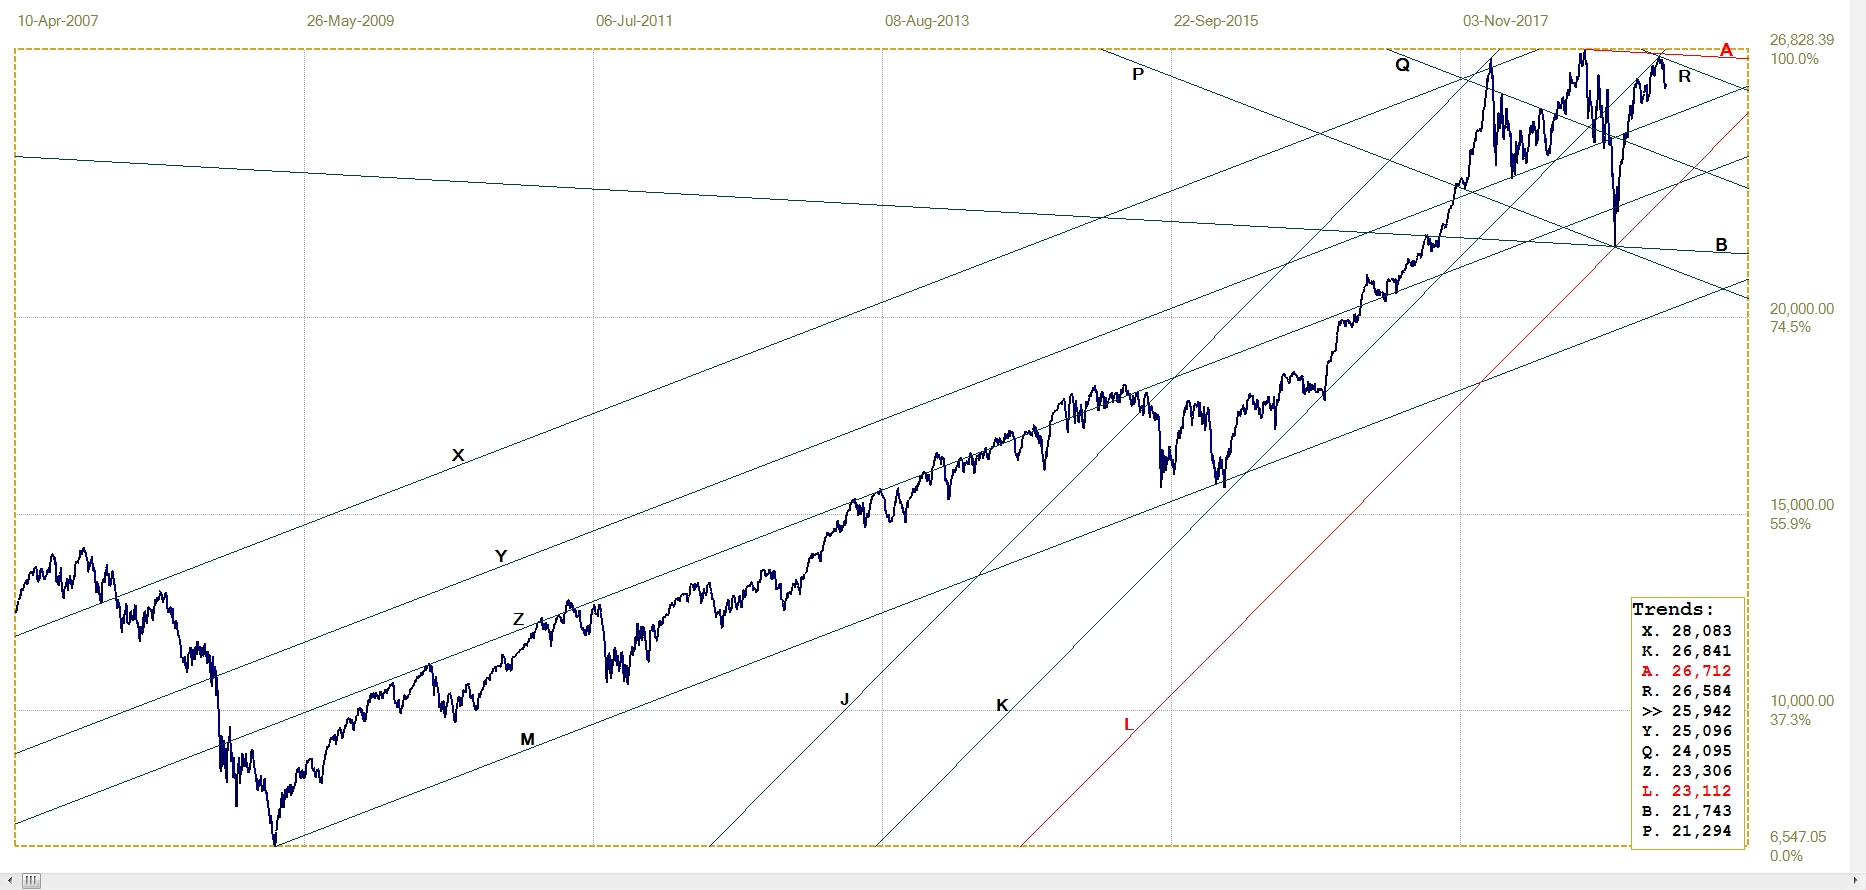
DJIA, last = 25942.37 (money.cnn.com)
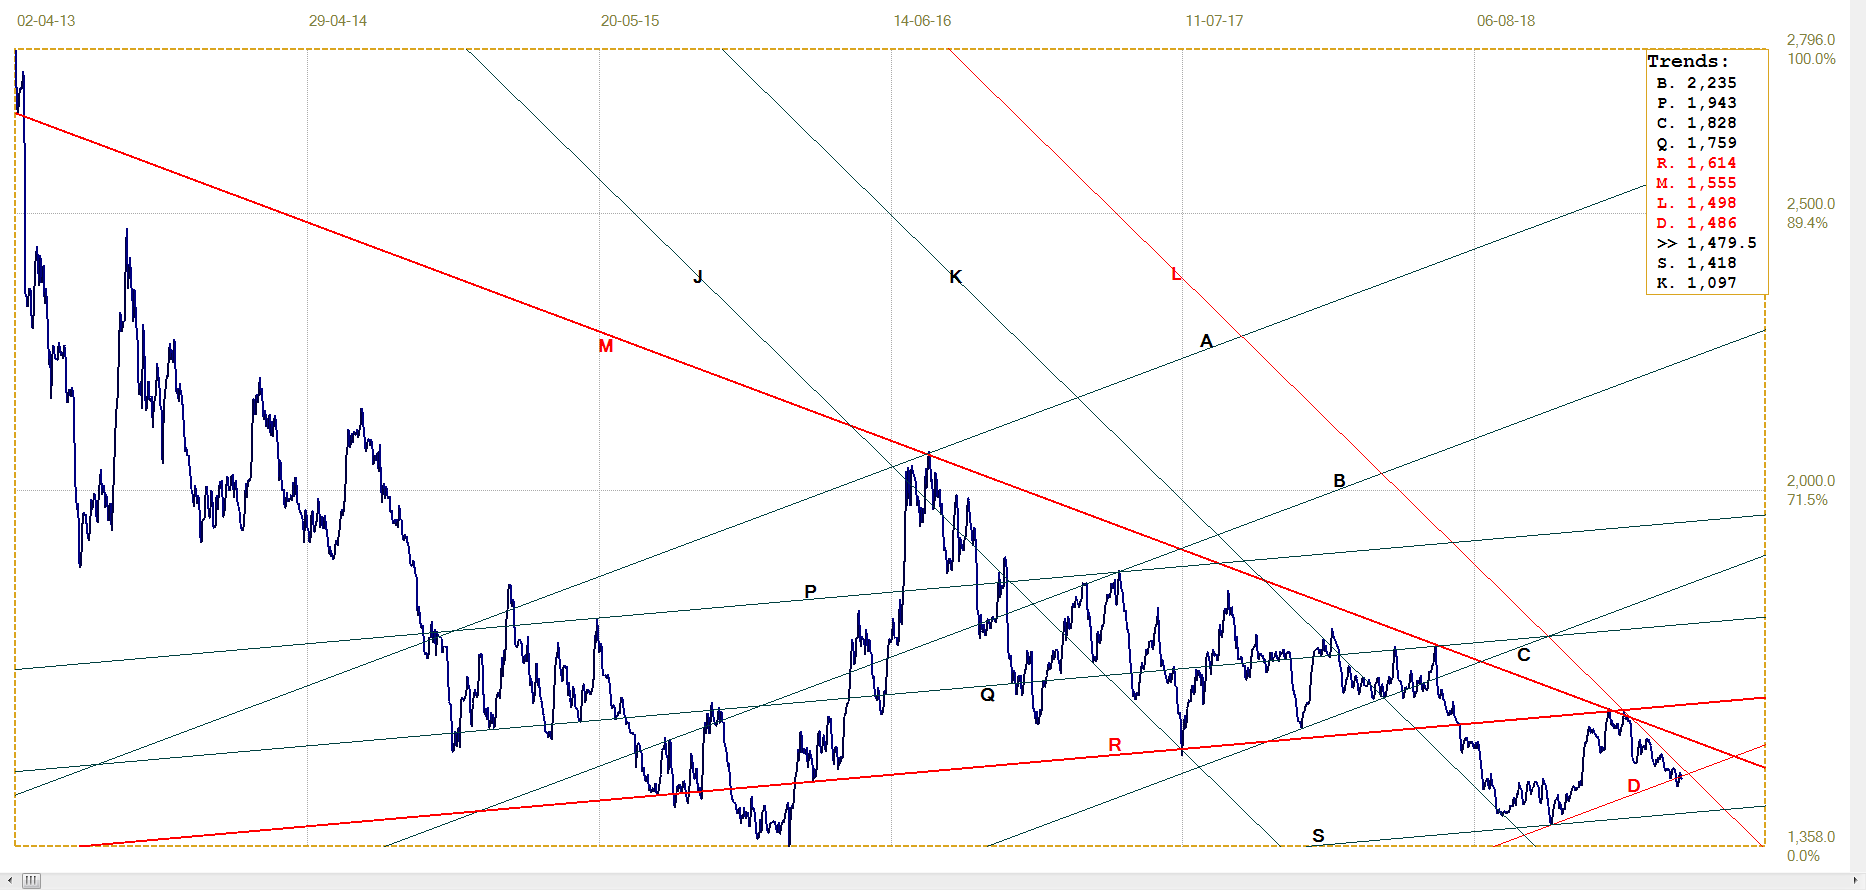
Gold London PM Fix – Dollars
Rather similar to the euro, the price of gold is holding tightly to a steep trend and between support and resistance. While not lasting as long as the euro, being stuck within the small pennant between resistance at line L ($1277) and support at line F ($1271), what happens next is technically important.
The break above line F at the end of the fifth leg of triangle MF is a strong bullish signal, but steep bear channel KL intervened to force the price back to line F on two occasions – thereby to complete legs 2 and 4 of the small pennant! The question is whether the pennant will complete normally, with a break above the pennant and a new rally.
Similar to the euro, there is already a marginal break above the pennant; however. in this instance it is the anticipated event at the end of the fifth leg. This should be bullish. A break back into triangle MF will be technical evidence of fresh suppression of the price, similar to but on a much smaller scale to what happened way back in 1996 when gold broke above $400 at the end of leg 5 of a large triangle, only to fall victim to the ‘Gold carry’ organised by the central banks .
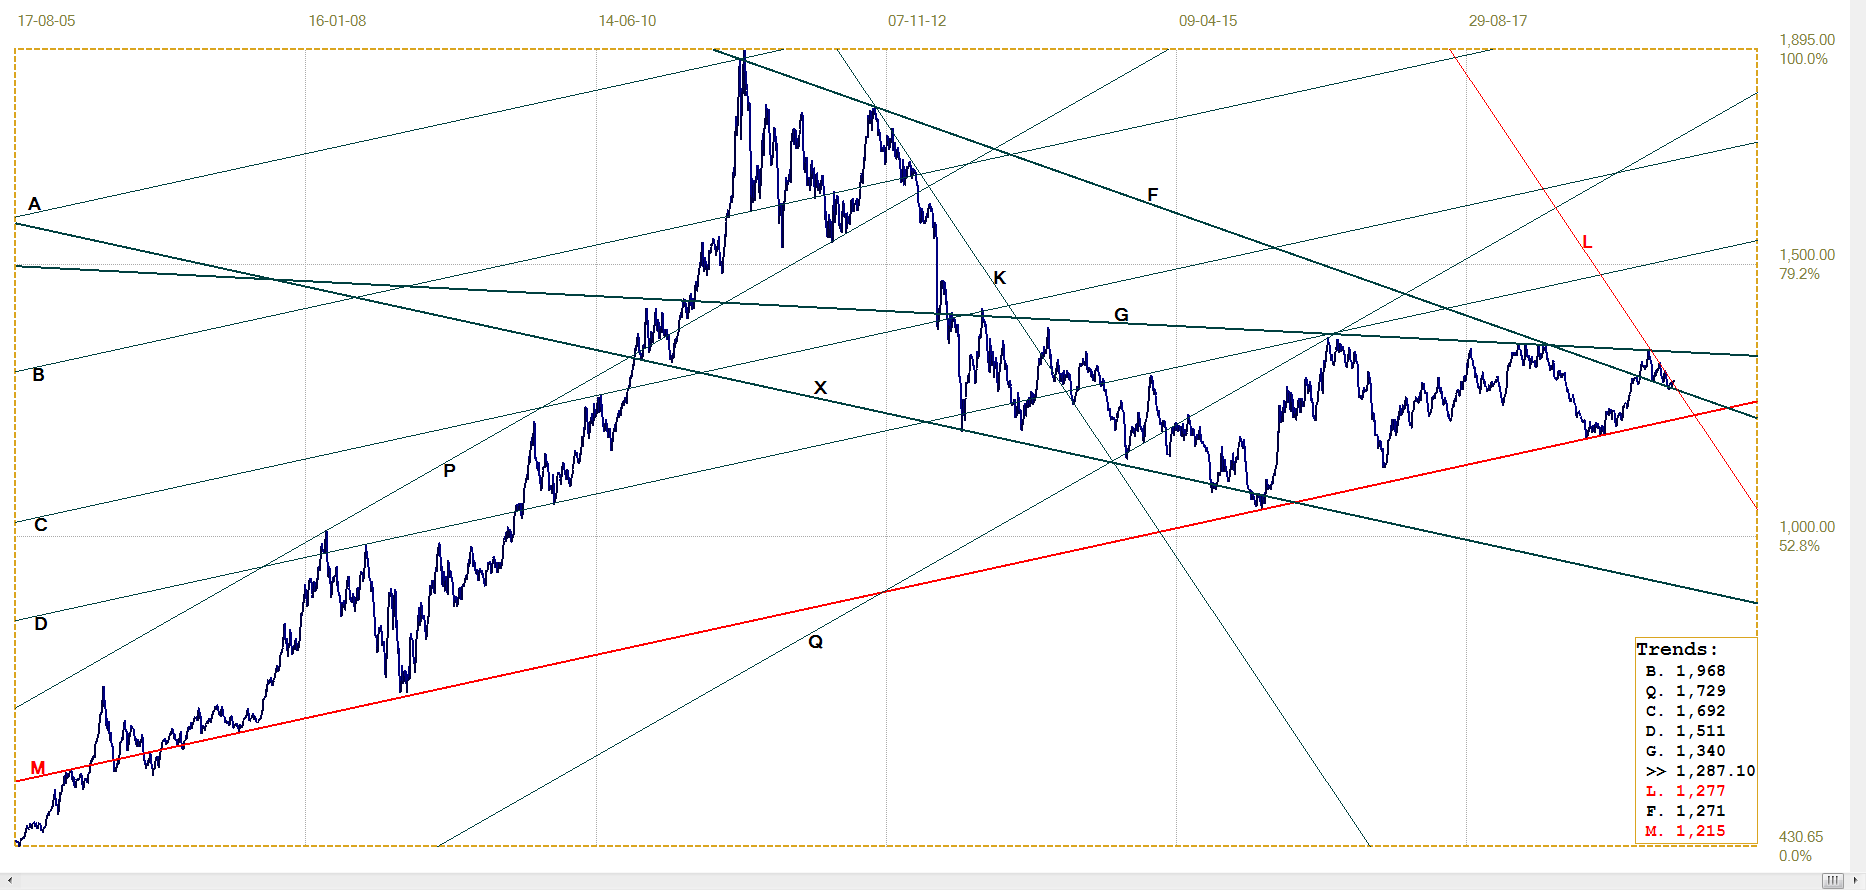
Gold price – London PM fix, last = $1287.10 (www.kitco.com )
Euro–gold PM Fix
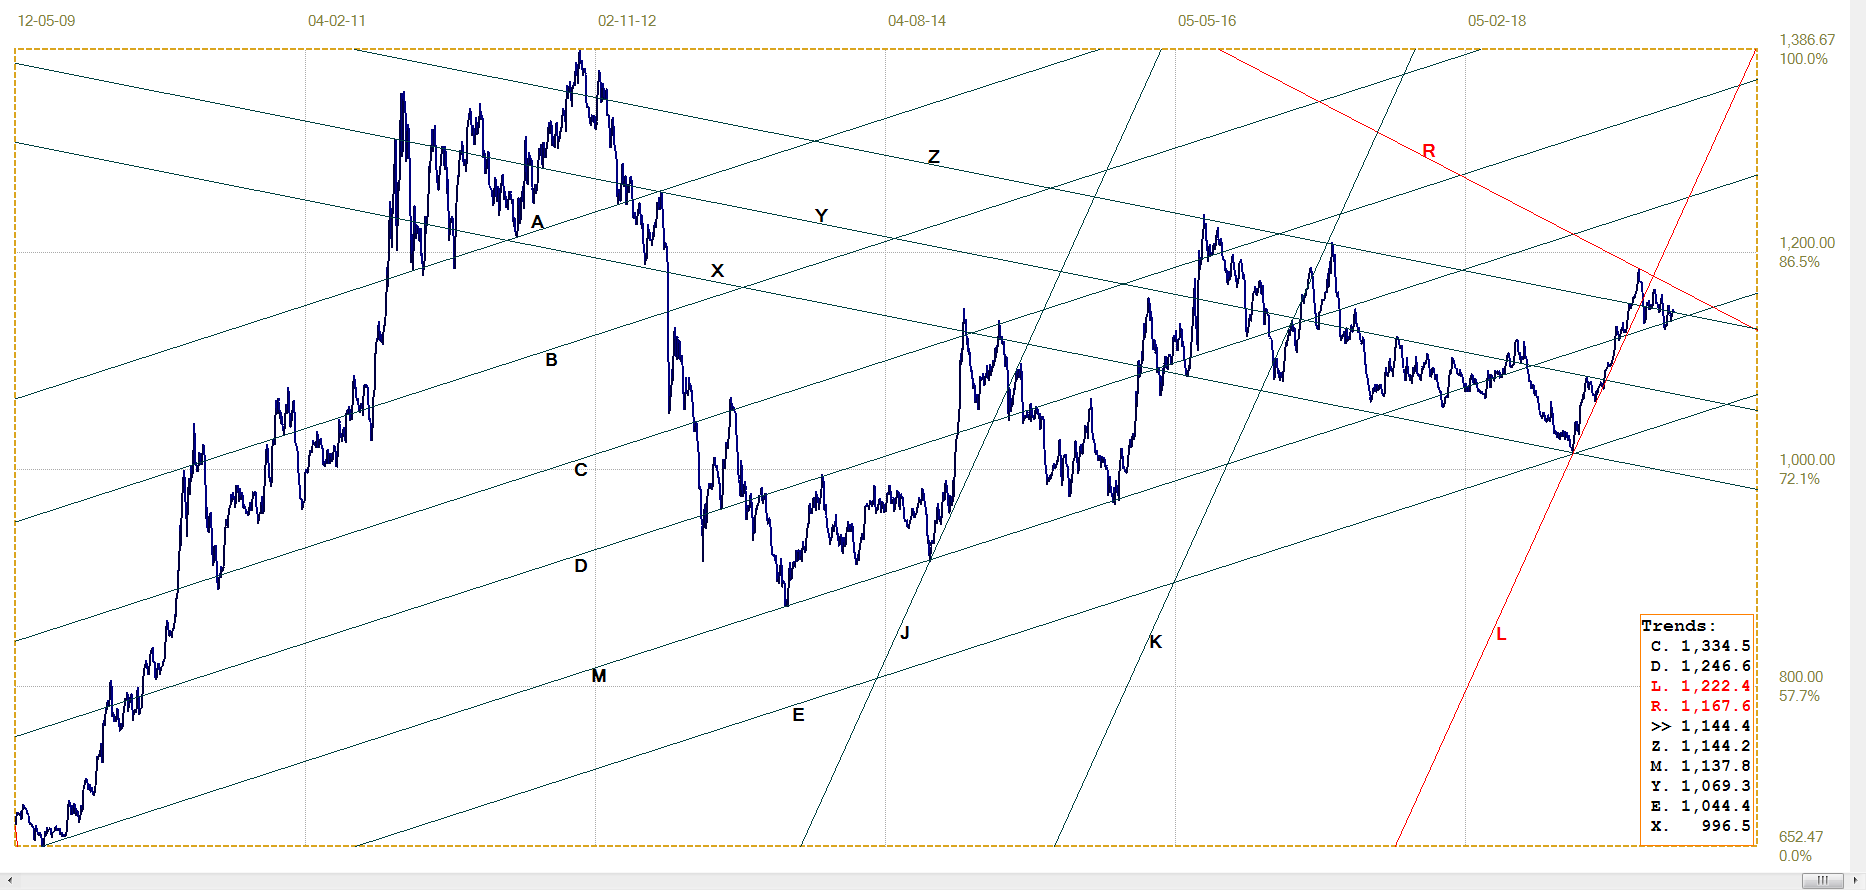
Euro gold price – PM fix in Euro, last = €1144.4 (www.kitco.com)
After failing to hold to the steep trend it had followed along line L (€1223), the euro has kept to the triangle between lines R (€1167) and M (€1138), mostly keeping to line Z (€1144). A brief break below line M soon corrected, but this warned that the outlook for the euro price of gold is a little more bearish than bullish. The possibility of a stronger euro with a weaker euro price of gold holds a warning for the dollar price of gold, which is so precariously poised above key support.
Silver Daily London Fix
Silver daily London Fix, last = $14.795(www.kitco.com)
In this analysis, the pattern between lines M ($15.55) and D ($14.86) is a triangle, as have appeared in some other charts. The price of silver have just completed the third leg of the triangle to end with a minor break below line D that so far has not fully corrected – as is anticipated to happen.
Should a correction to above line D begin the fourth leg of the triangle, the prospect still is that normal development of the triangle will result in a break lower after the fifth leg has been completed – or perhaps even earlier, while still on leg 4. In both cases, the outlook for silver will be dire, in line with what the PM doomsayers have been expecting.
The PM bulls are hoping for a break higher at the end of leg 4, which then would be a premature break and a signal for a strong rally to follow.
U.S. 10–year Treasury Note
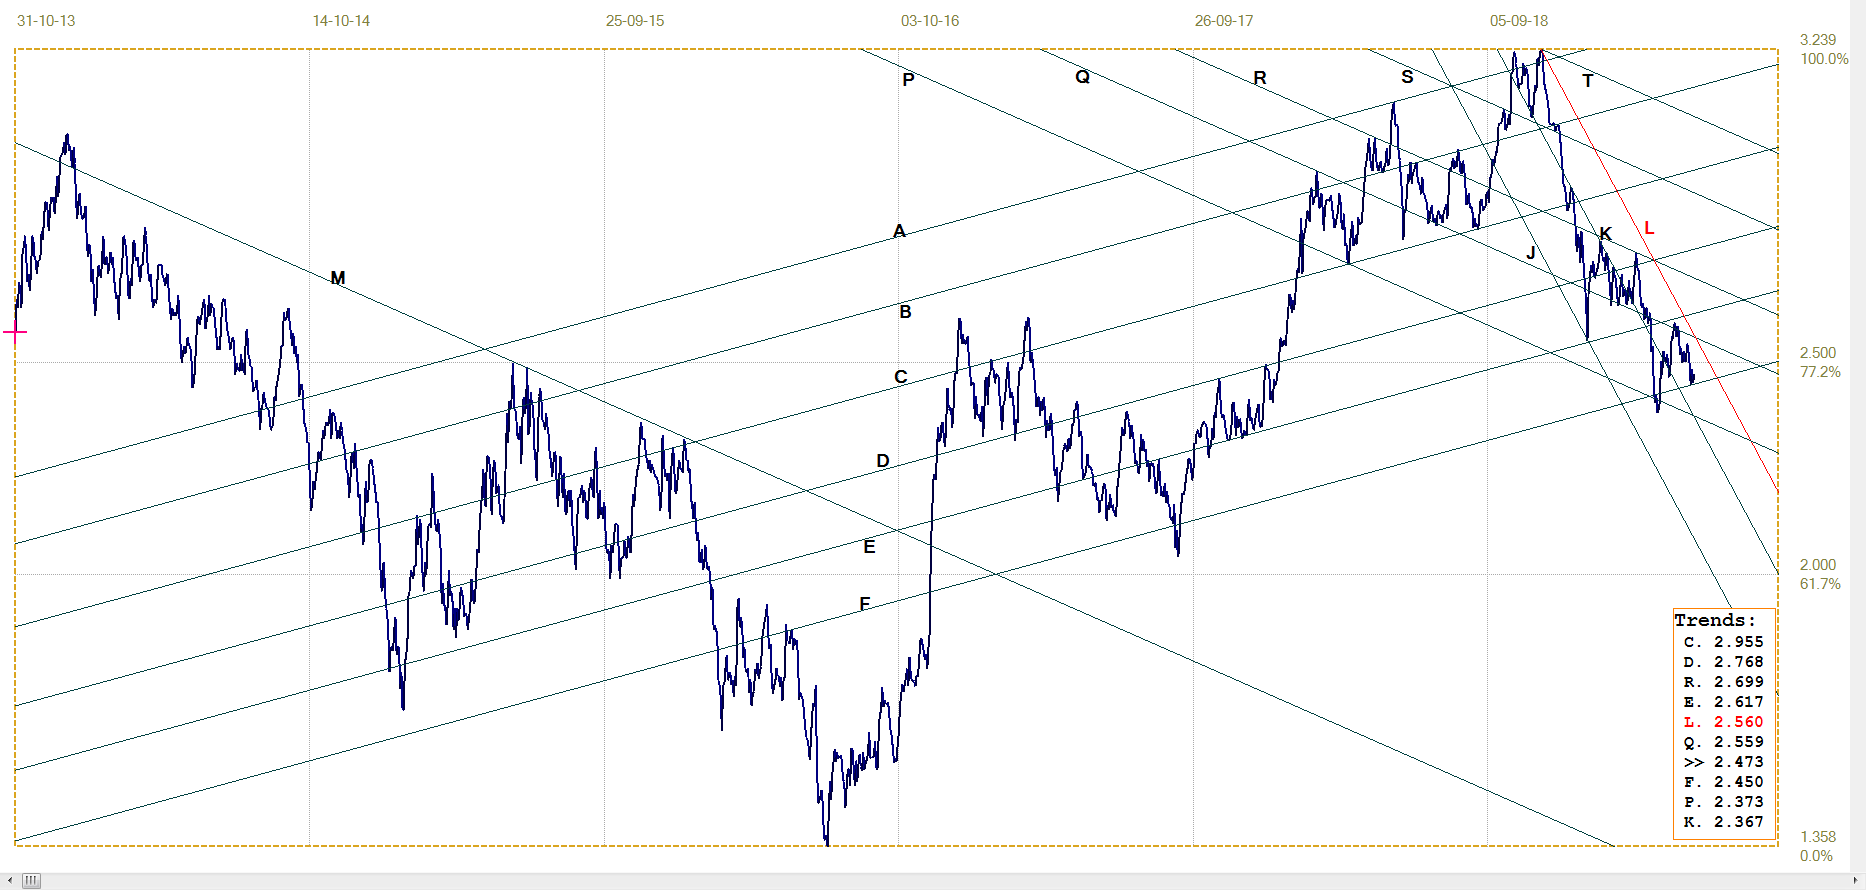
U.S. 10–year Treasury Note, last = 2.473% (www.investing.com )
The markets found themselves in a difficult situation the past week or two. There was uncertainty about the outcome of the trade war with China that ended Friday with higher tariffs and promises of more. The addition of higher tariffs to the cost of imported goods might mean a windfall for government coffers, but if the costs of the tariffs are passed on to consumers, the effect on inflation could trigger a push for higher interest rates.
Certainly, the long term risks of this happening must have been evaluated, but if the consensus among those who set policy is that China will fold their expectation will be that the matter will be resolved before there is a significant roll-on effect on inflation and higher interest rates.
The yield on the 10-year Treasury dropped sharply last week. The reason could be the traditional flight to a safe haven when outside danger threatens, or perhaps a fear that the stock market is again making ready for a bear market. What happens now that the yield has reached the bottom of bearish channel EF (2.450%) and has made a small reversal, will indicate the near term future for the bond market.
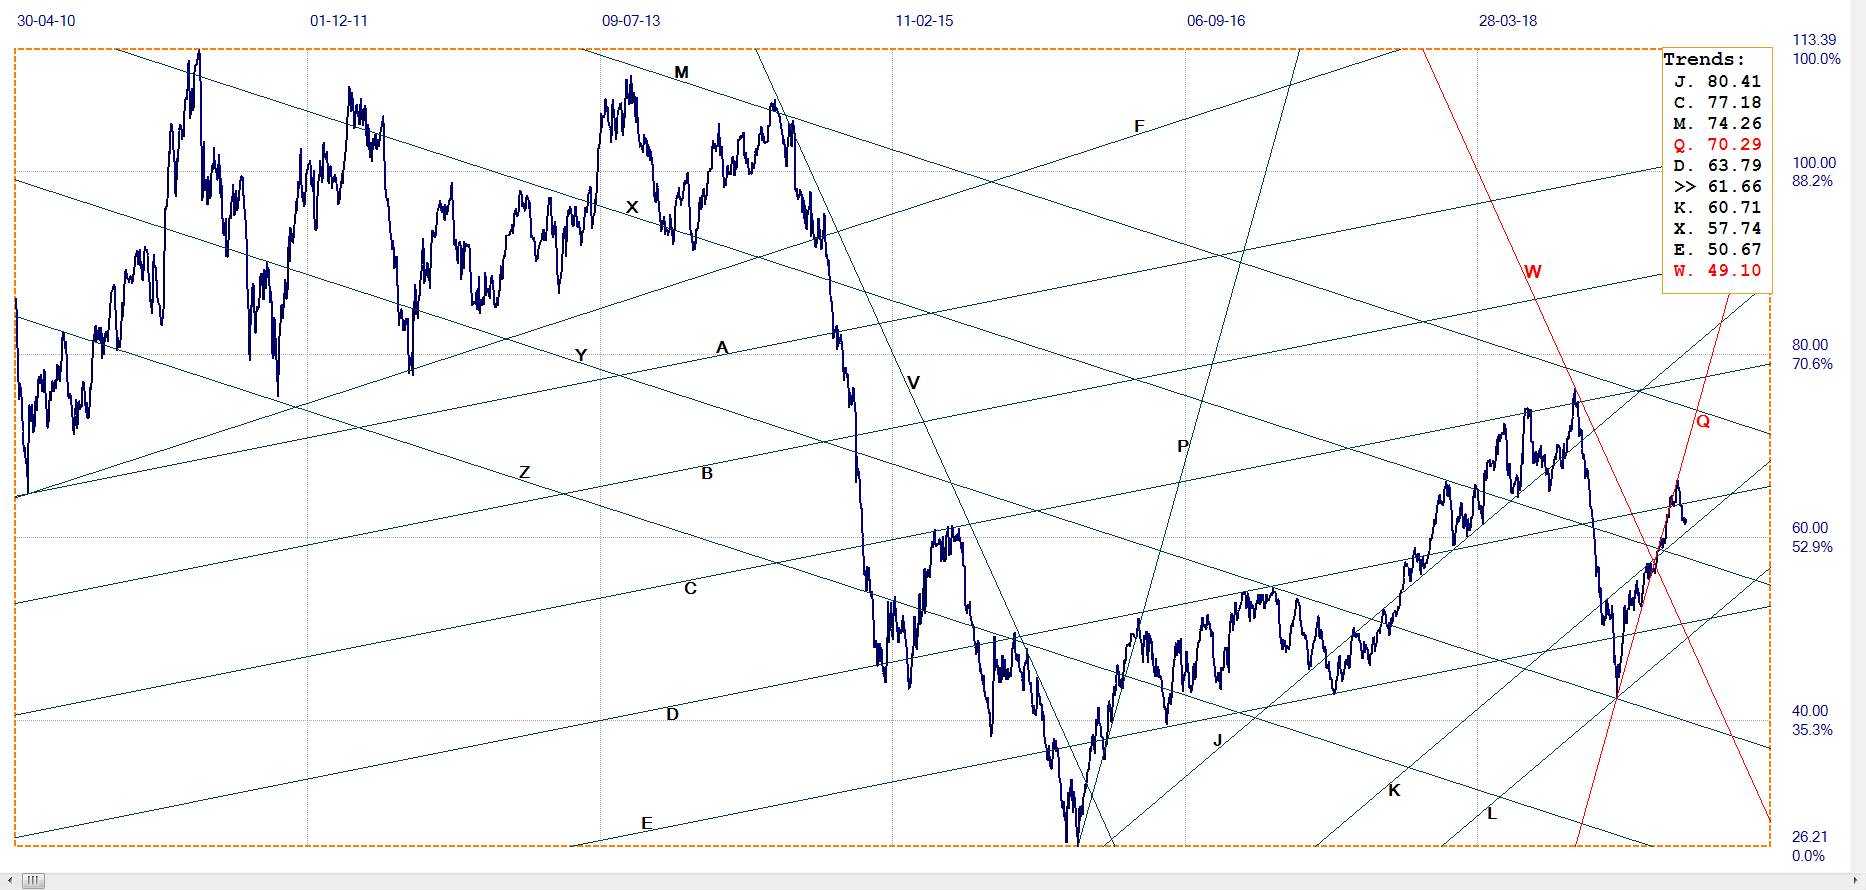
West Texas Intermediate Crude. Daily Close
The price of crude has broken below the steeply rising technical support of line Q ($10.29) and also below line D (63.79). It then started to consolidate a little above the top of bull channel KL ($60.71). The price still looks lower to more sideways for now and for as long as the support at line K holds.
********


