Will Gold’s Upside Breakout From A Massive, Bullish Cup And Handle Pattern Continue?


Gold formed a Massive Cup and Handle Bullish pattern that started at its September 2011 peak and continued through February 2022. This eleven-year pattern just completed. This pattern was Bullish and projected an upside breakout, with a price target of 3,000.
We have been tracking this long-term pattern for several years.
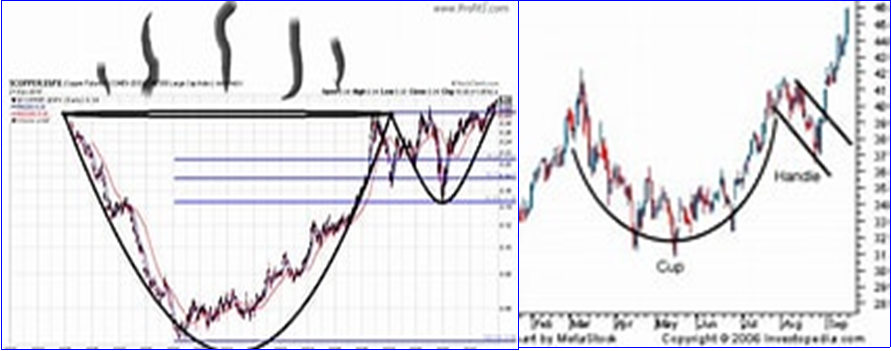
Shown below, a Cup and Handle chart pattern is where we see a drop in the price after a significant high (such as we saw back on September 2011) followed by a rise back up to the original peak value, key resistance, which is then followed first by a smaller drop, and then a rise past the previous peak. It is an indication of bullish sentiment in the market and likely further price increases. It is a continuation “pause” pattern in a long-term Bullish trend. Gold started its long-term Bullish trend back in the 1970’s, and temporarily topped on September 6th, 2011 at 1923.70. It then fell into a late 2015 bottom on December 3rd, 2015 at 1,045.40, then rose back to approximate 2011 levels last August 7th, 2020 at 2,089.20. At this August 2020 level, the “Cup” portion of the pattern was completed. Next to come was the final portion of the pattern, the “Handle” decline.
The unique shape of this pattern, typically, is a rounded bottom like the bottom of a tea cup. But what is important is that this pattern needs a “Handle.” After prices return to their original high (which occurred in August 2020), once they rise back to that same approximate level, a decline must form that is short in both time duration and depth, relative to the steepest decline into the Cup’s bottom. Once this “Handle” bottoms, prices should break out higher back to the original high. Once prices rise above that original high level, it is off to the races for prices. That rise is now underway.
Below is an example of this pattern from the Technical Analysis Science of Market Forecasting Textbooks:
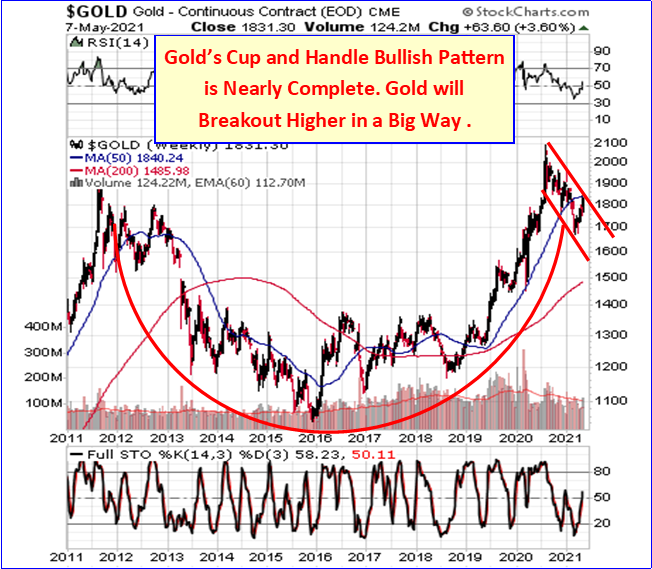
To see the progression of the pattern, this next chart shows where the pattern stood in May, 2021, along with the pattern prediction. At that point, Gold was deep into the Handle’s decline:
5/7/2021 |
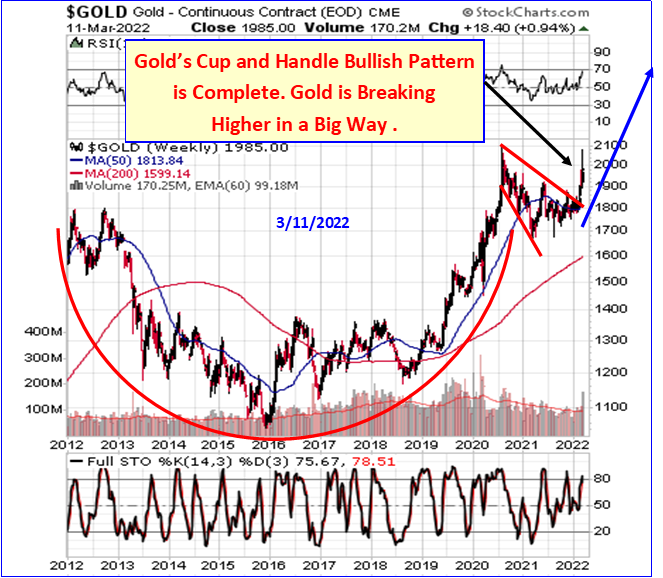
Since then, Gold continued its consolidation to finish the Handle, which was accomplished in February 2022. Gold then catapulted higher, breaking out of the declining Handle, finishing the entire eleven year pattern.
The last time we presented an article on this pattern, we wrote, “Great news at long last for Gold bugs. Probably not so good for the stock market, hyperinflation, or for world peace and security, as this Gold pattern is warning trouble could be coming.”
Now it is clear, Gold saw hyperinflation and war coming, and a stock market plunge, which has occurred, with the highest Consumer Price Index rise in 40 years, with a powerful global stock market plunge, and with the Russian invasion of Ukraine.
Below shows Gold’s breakout from the Cup and Handle’s February 2022 conclusion.
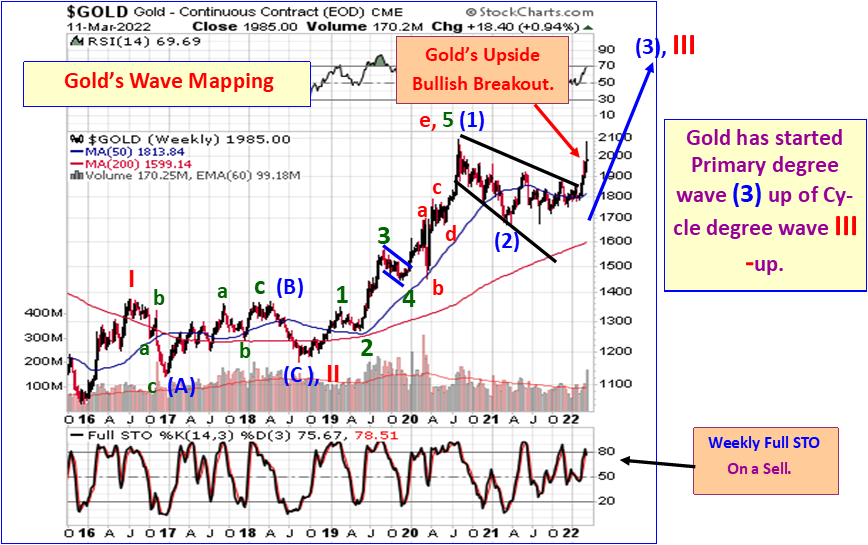
But in addition to the Bullish projections from this pattern, there is a Bullish Elliott Wave pattern projecting sharply higher Gold prices. It shows that Gold is about to hit the sweet spot of a dramatic Cycle degree wave III up. Unfortunately, this likely means more hyperinflation is coming, as well as a widening of military conflicts, and perhaps other dangerous economic and geopolitical events. This is shown on this next chart:
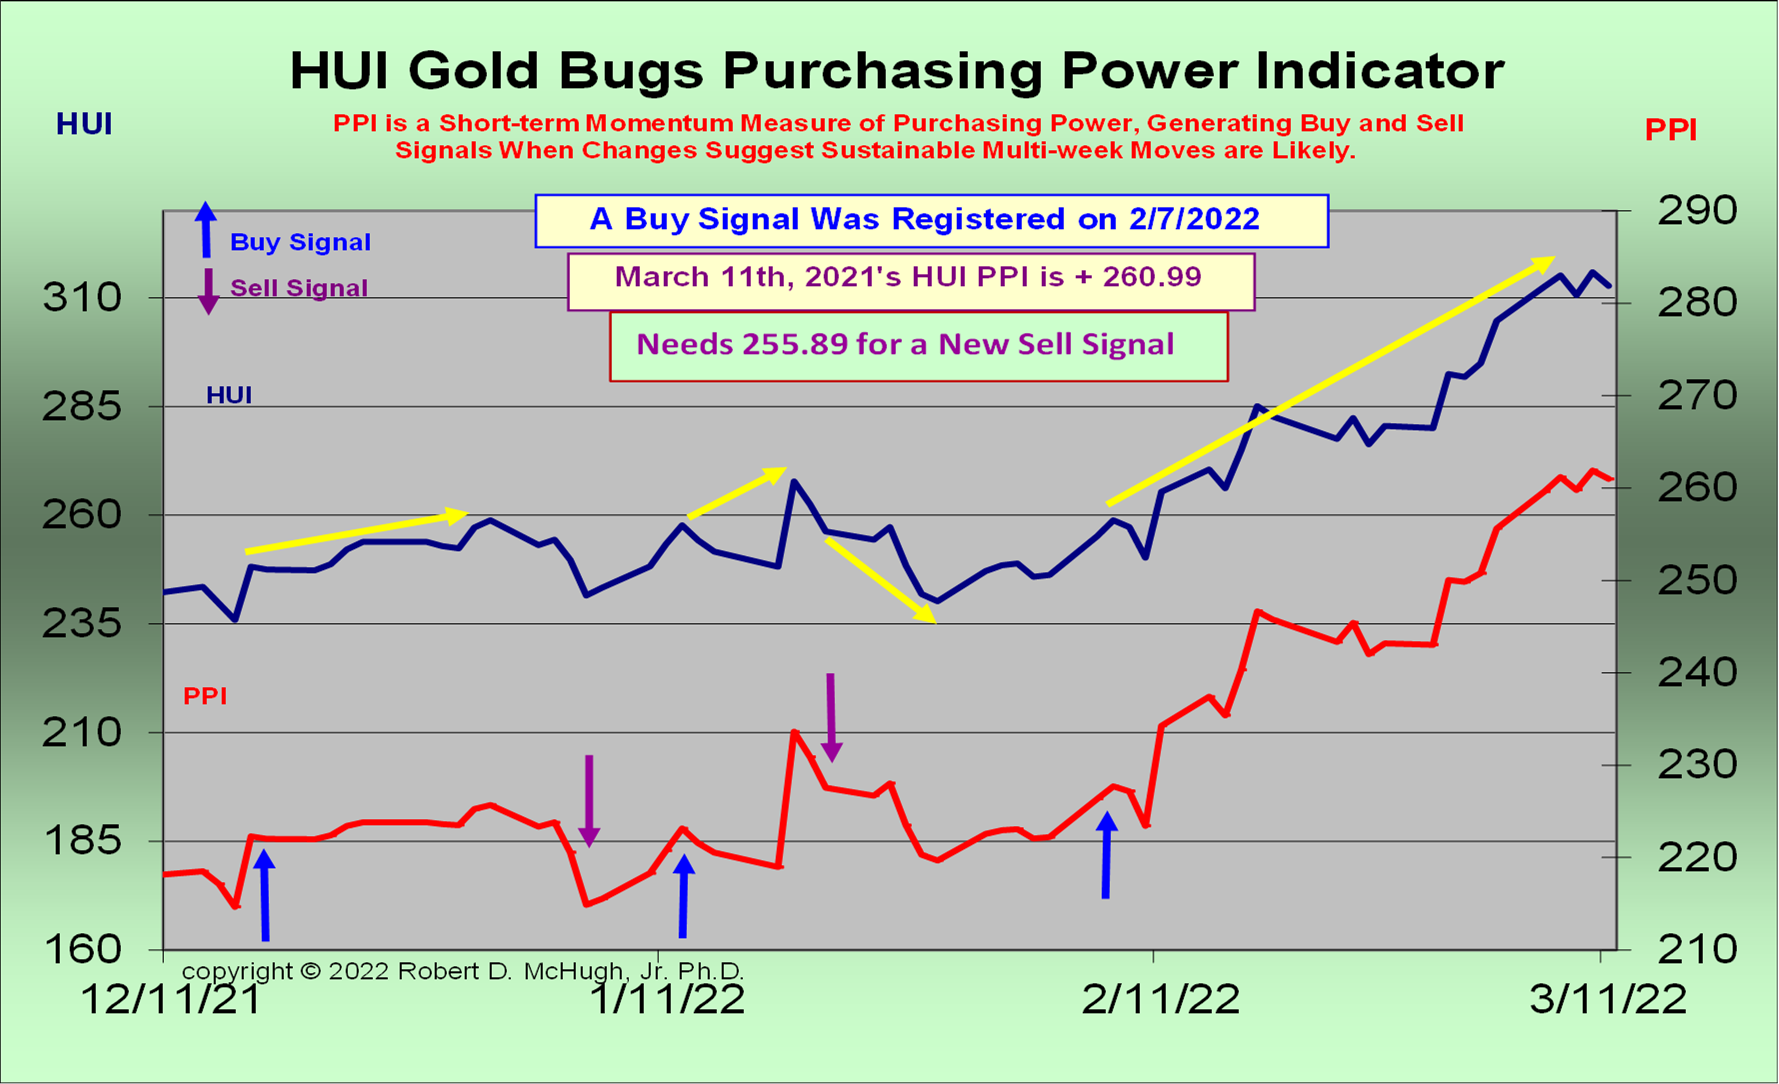
We also use momentum measuring key trend-finder indicators for the HUI Mining stock index, which we show to subscribers in our newsletters. We have found that Gold tends to track these Mining stock Buy / Sell Indicators. One of the charts we like is to look for Bullish or Bearish signals for the HUI from our Purchasing Power Indicator. This gives us reliable identification of new short-term trends. Below is the latest chart, and it is showing a Bull signal was generated on February 7th, which has been followed by a strong rising trend in Gold and Mining stocks.
At Dr. McHugh’s www.technicalindicatorindex.com we track the short-term waves that make up these larger degree trends, and chart them in our forecast newsletters, and have developed several proprietary Buy/Sell indicators that help us identify when the next significant move is starting for the major stock indices, as well as for Gold, Silver and Mining stocks, and in which direction the move will develop. We publish these indicators in every Newsletter to subscribers. We offer education on how to trade markets up or down, based upon these indicators, patterns, and the overbought / oversold conditions that they identify with our Platinum Options and Silver ETF Trading programs. Our Memberships also include a Conservative Portfolio model.
*******


