Wow! $30 Plus…Or Much To Do About Nothing?


Let’s all get excited – $30 bounce on Friday – Hurray – Where are the Champagne glasses?
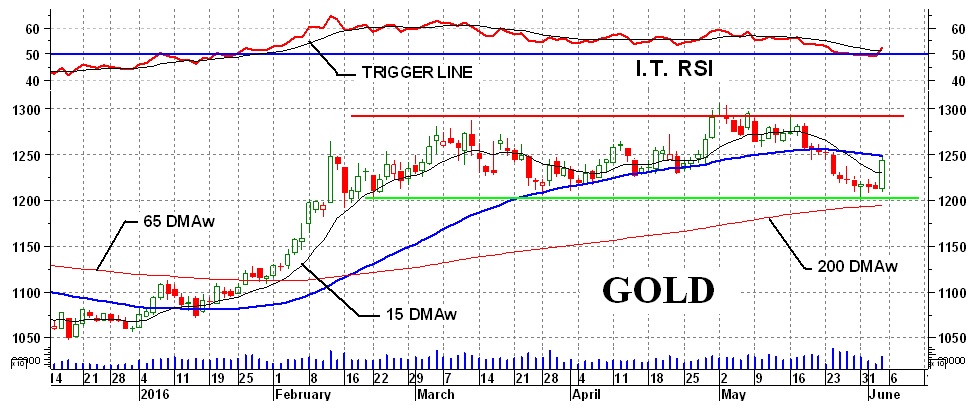
Oh wait, we’ve seen this picture before and not that long ago. Back on 2 Feb (check the chart) we had a $53 bounce (76% higher than Friday’s bounce) and where did THAT get us, other than just about to the very top and into 4 months of a sideways drift. And curiously, that previous bounce was just about at the same price. So, we’ve gone 4 months since, just to get back to the same price we had before. And for the volume aficionados the volume in Feb was 52% higher than the volume on Friday even though the Friday volume was not on the pathetic side.
Now, this is not to boo-boo Friday’s bounce. It just may turn out to be the start of something great BUT I’ll follow the charts and indicators. They usually filter out one day’s action and tell us the basic overall trend and gold position. From my experience the indicators will seldom define the very top or the very bottom of any move, at the time they occur, but they will also not leave you holding the bag with ever growing losses. So, what are they telling us today?
But before we get to today’s gold market analysis just a brief few words about last week. There were a few comments on the Gold-Eagle site about my commentary. Here are a few with my $0.02 worth.
“A large German bank disagrees with you, and technicals have no validity in a manipulative environment.”
“But he doesn't address the key issue. If markets are manipulated, the signals being sent by the charts are, indeed, invalid.”
As you might imagine I disagree with both of these comments. I will be addressing this issue in an appropriate section of an upcoming tutorial on my Facebook page.
“I'll take prices as they come and go with Merv's analysis.”
Good to know that I have at least one ultra intelligent reader out there.
Now, where was I?
Long-Term
Slow but steady the long term moving average line continues its climb. There is still little danger of a trend reversal but who knows, if gold should take a tumble it could cross the average line. That is for another time, I don’t see it happening this next week. For now the gold price remains above a positive sloping long term moving average line. The long term momentum indicator has moved closer to its neutral line but is still above the line in its positive zone. Friday’s action has perked up the indicator and it closed Friday above its trigger line although the trigger is still pointing downward. At the Friday close the long term rating remains BULLISH. The week ended with the Merv’s Gold and Silver 100 Index moving significantly higher, almost into new recovery highs, but not quite. The BULL/BEAR rating improved slightly but with a very high bullish rating it had very little extra room for improving. It stands at 93% positive and 3% negative.
Intermediate-Term
Ah, the time period of most interest (at least from my perspective). Everything improved here as could be expected from the Friday action. Until Friday the price was skirting that $1200 support level. Despite the huge bounce the price closed Friday just below its intermediate term moving average line and the line continues in its negative slope. The long term momentum indicator crossed back into its positive zone and slightly above its trigger line but the trigger is still pointing downward. Putting these together I must still rate the intermediate term as BEARISH although very close to turning. The Merv’s 100 turned back to an overall positive rating after last week’s negative. The BULL/BEAR rating closed the week with 67% of the stocks positive and 18% of the stocks negative.
Despite the Friday bounce nothing else has changed in the intermediate term perspective. Of greatest interest, the point and figure charts haven’t changed and the short term moving average line remains below the intermediate term line.
Short-Term
With the turn of events on Friday you would have expected things to have improved dramatically on the short term. The price did close above its short term moving average line but the line is still slightly in a negative direction. The short term momentum indicator has moved above its trigger line but remains in its negative zone. From a ratings standpoint, I can only rate the short term as NEUTRAL. This neutral rating is also reflected in the performance of the Merv’s 100 stocks. Here the BULL/BEAR rating has improved from last week but not quite to the bullish level. We had 40% of the stocks positive and 19% negative. By the end of the week we had 93 stocks that advanced during the week and 3 that declined.
********
Readers are invited to view my Facebook page at https://facebook.com/merv.burak where I will be slowly posting commentaries explaining in more detail my various indicators and techniques. I also present from time to time some individual stocks that look as if they may be good speculations. However, nothing I post is meant to be a recommendation to buy or sell. One should check with their broker or investment advisor before acting.
 Merv is a retired Aerospace Engineering consultant. He is also a retired market technician with over 40 years of market experience and research. Merv received his certification as a Chartered Market Technician (CMT) in 1992. Developer of many technical techniques and programs which he has been using in his previous Technically Speaking with Wil-Arm and Technically Precious with Merv commentaries posted throughout the globe. Developer of several gold and silver Indices, Merv continues to update his Merv’s Gold & Silver 100 Index and Merv’s Penny Arcade 50 Index and reviews them during his periodic on-going Technically Precious commentaries.


