Yesterday in Gold, Silver, Platinum and Palladium
 share
share
 share
share
 share
share
 share
share
 share
share
The gold price began to wander quietly and somewhat unevenly higher starting shortly after 9 a.m. China Standard Time on their Friday morning -- and that lasted until the 10 a.m. EDT afternoon gold fix in London. It jumped higher at that point, but obviously ran into 'something' within minutes. It continued to rally a bit from there until 12:15 a.m. in New York trading. It then crept a bit lower until shortly after 3 p.m. in the after-hours market -- and rallied a few more dollars from that juncture until trading ended at 5:00 p.m. EDT.
The low and high ticks in gold were recorded by the CME Group as $1,753.00 and $1,781.90 in the December contract -- and $1,751.60 and $1,779.60 in October. The August/October price spread differential in gold at the close yesterday was 80 cents...October/December was $2.20 -- and December/February was $2.10 an ounce.
To show you how tight the wholesale gold market is right now, the contango between August and February is only $5.10 the ounce in total.
Gold finished the Friday trading session in New York at $1,779.70 spot, up $25.80 from its Thursday close -- and a dollar and a bit off its Kitco-recorded high tick of the day. Net volume was very quiet for the second day in a row at a bit under 135,000 contracts -- and there was 10,500 contracts worth of roll-over/switch volume in this precious metal.
The silver price quietly stair-stepped its way higher in Far East and morning trading in London -- and then blasted higher the moment that the afternoon gold fix was put to bed at 10 a.m. EDT. It was viciously capped minutes later -- and then turned lower at the same time as gold...starting around 12:15 p.m. in COMEX trading in New York. After that, its trading pattern was also similar to gold's, complete with its rally in the after-hours market.
The low and high ticks in silver were reported as $23.13 and $23.83 in the September contract. The September/December price spread differential in silver at the close yesterday was 5.3 cents...December/March was 5.4 cents -- and March/May was 4.1 cents an ounce.
Silver was closed in New York on Friday afternoon at $23.73 spot, up 58.5 cents from Thursday. Net volume was very much on the lighter side at just about 44,500 contracts -- and there was a bit under 10,500 contracts worth of roll-over/switch volume out of September and into future months...mostly December, with a bit into the New Year as well.
The platinum price was sold a bit lower in the early going in the Far East -- and after recovering a few dollars in short order, didn't do much until a rally of some merit commenced around 11:30 a.m. in Zurich. That ran into 'something' around 11:35 a.m. in New York -- and less than an hour later some quiet selling pressure appeared -- and that lasted until an hour or so before the 5 p.m. EDT close. Platinum was closed at $1,024 spot, up 10 dollars on the day -- and 13 bucks off its Kitco-recorded high tick of the day.
Palladium's jump higher at the 6:00 p.m. open in New York on Thursday evening was capped and turned lower almost immediately -- and from that juncture it wandered unevenly lower until the low tick for the day was set a few minutes after 11 a.m. in Zurich. It then took off higher starting minutes before 2 p.m. CEST/8 a.m. in New York -- and the short sellers of last resort put in fork in it very shortly after the 10 a.m. EDT afternoon gold fix in London. It was sold very unevenly lower from there until the market closed at 5:00 p.m. EDT. Platinum was closed at $2,586 spot, up 26 dollars from Thursday.
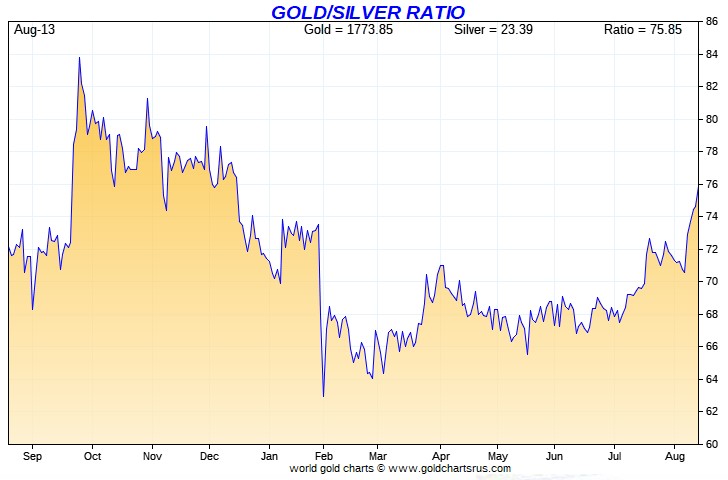
Based on the kitco.com spot closing prices in silver and gold posted above, the gold/silver ratio worked out to 75.0 to 1 on Friday, compared to 75.8 to 1 on Thursday.
And here's Nick's 1-year Gold/Silver Ratio chart, updated with the last five days of data.
----
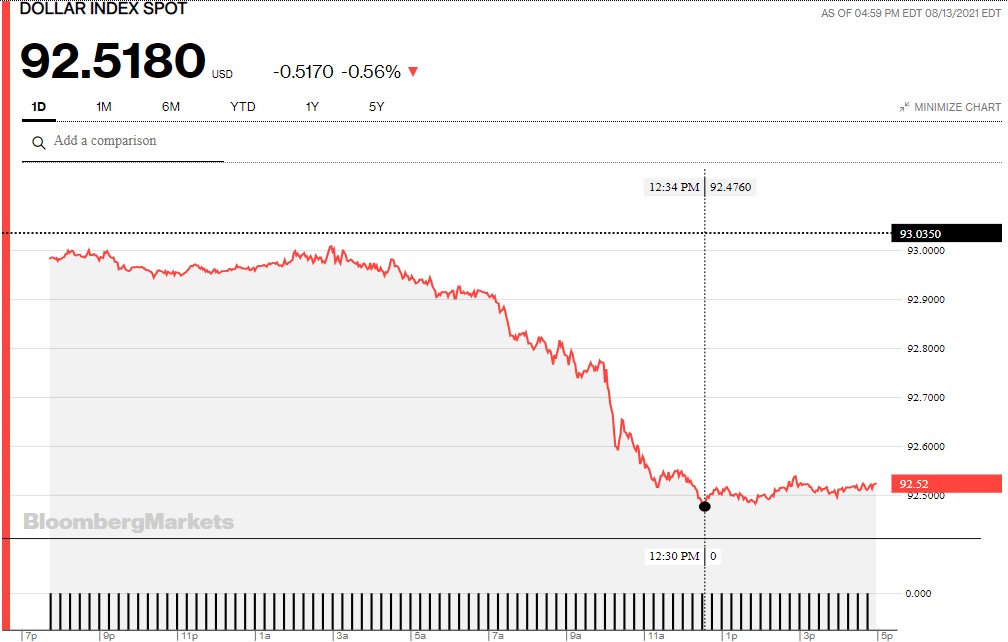
The dollar index closed very late on Thursday afternoon in New York at 93.035 -- and then opened lower by 5 basis points once trading commenced around 7:45 p.m. EDT on Thursday evening, which was 7:45 a.m. China Standard Time on their Friday morning. It had a very quiet down/up between then and its high tick of the day, which came a few minutes before the London open. The ensuing fall from grace ended at its low tick, which came a minute or so before 12:35 p.m. in New York. From that point it crawled a tiny bit higher until trading ended at 5:00 p.m. EDT.
The dollar index finished the Friday session in New York at 92.518...down just about 52 basis points from its close on Thursday.
Here's the DXY chart for Friday, thanks to Bloomberg as always.
And here's the 5-year U.S. dollar index chart that appears in every Saturday column in this spot -- and comes courtesy of the good folks over at the stockcharts.com Internet site. The delta between its close...92.51...and the close on the DXY chart above, was about 1 basis point below its spot close on Friday.
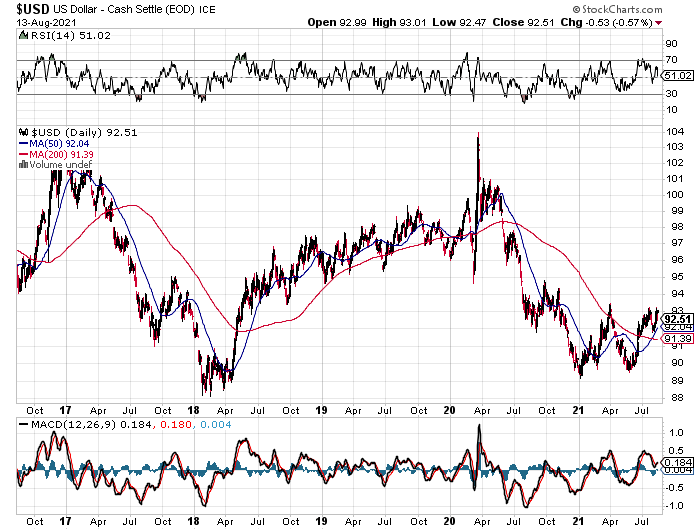
The dollar index took a nose dive at, or minutes before the 10 a.m. EDT afternoon gold fix in London -- and 'da boyz' had to cap silver and gold prices at that point. Because from thereon in, despite the fact that the DXY continued to fall until around 12:35 p.m...that part of its decline was not allowed to be fully reflected in the respective prices of either gold or silver.
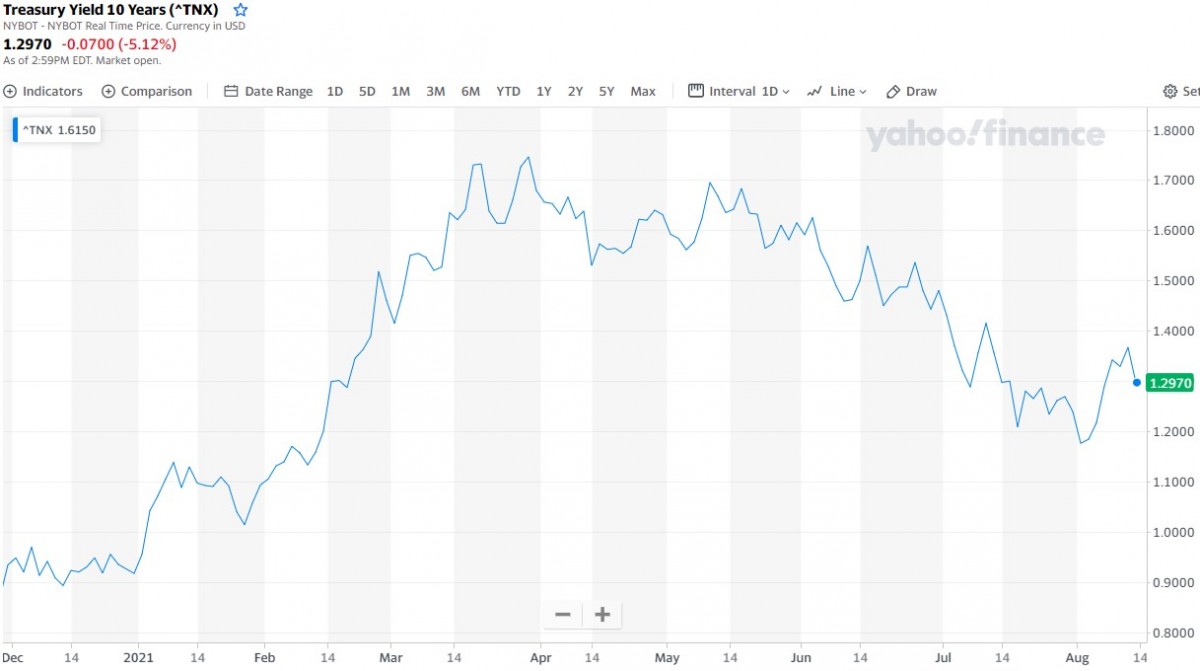
U.S. 10-Year Treasury: 1.2970%...down 0.0700 (-5.12%)...as of 2:59 p.m. EDT.
Here's the one-year 10-year U.S. Treasury chart, courtesy of finance.yahoo.com as always -- and as I keep pointing out, you can see where the Fed began yield curve control in March.
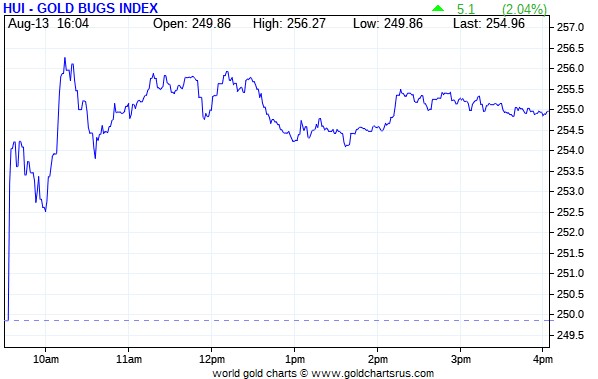
The gold stocks jumped higher in two steps as soon as trading began at 9:30 a.m. in New York on Friday morning -- and their respective high ticks were set when the gold price was capped shortly after 10 a.m. EDT. And despite the fact that the gold price rallied from there until trading ended, the gold stocks were sold a bit lower, before wandering quietly and unevenly sideways until the market close at 4:00 p.m. EDT. I was more than underwhelmed, as the HUI closed higher by only 2.04 percent.
The silver equities fought their way higher until around 11:15 a.m. in New York trading -- and less than an hour later they began to drift lower. That lasted until the market closed at 4:00 p.m. EDT. Nick Laird's Intraday Silver Sentiment/Silver 7 Index closed up only 1.98 percent. I was totally underwhelmed.
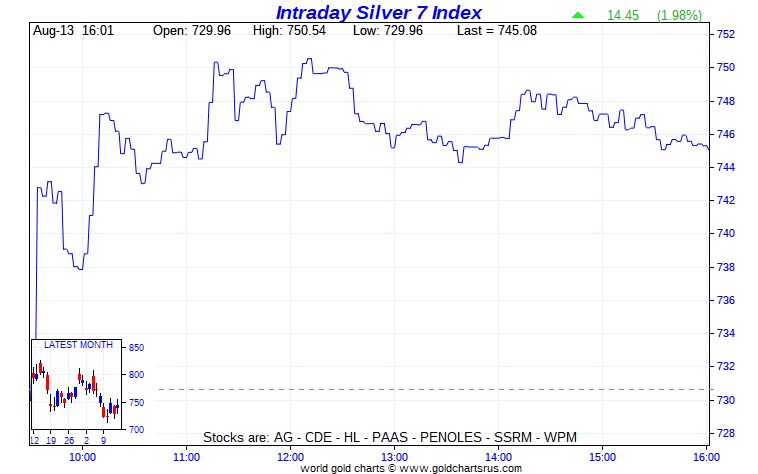
Computed manually, the above index closed higher by only 1.93 percent.
And here's Nick's 5-year Silver Sentiment/Silver 7 Index chart, so you can see what's happening currently vs. the longer term.
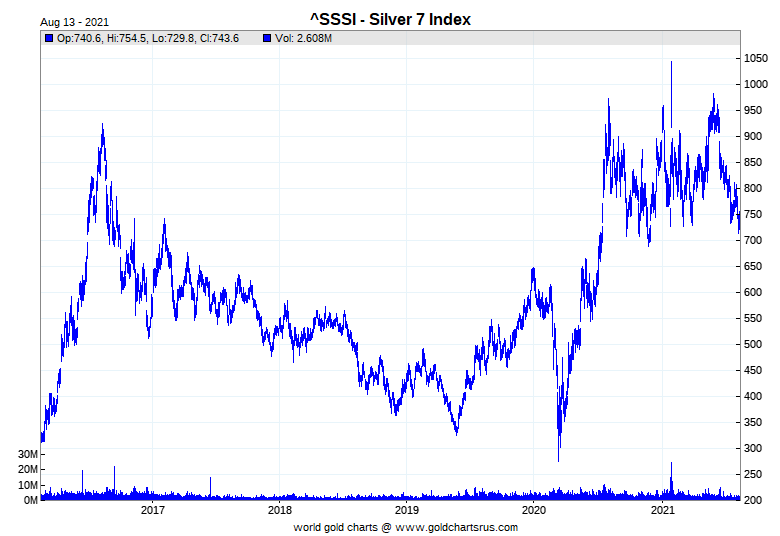
The two stars were SSR Mining and Wheaton Precious Metals, closing higher by 3.82 and 3.47 percent respectively. The absolute dog was Peñoles, as it actually closed down on the day by 1.49 percent -- and on very decent volume for it.
But I should point out that the rally in the silver stocks at the open yesterday morning ran into some fairly stiff [not-for-profit?] selling pressure on the way to their highs of the day -- and that certainly affected the overall performance of the shares.
Here's some new silver eye candy from the reddit.com/Wallstreetsilver crowd. I thank U.K. reader Nigel McHale for sending it our way -- and it's the first photo linked here.
----
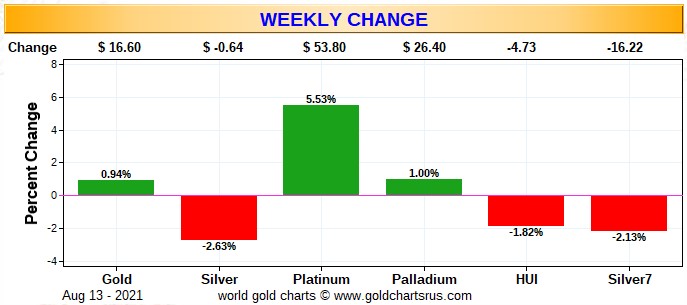
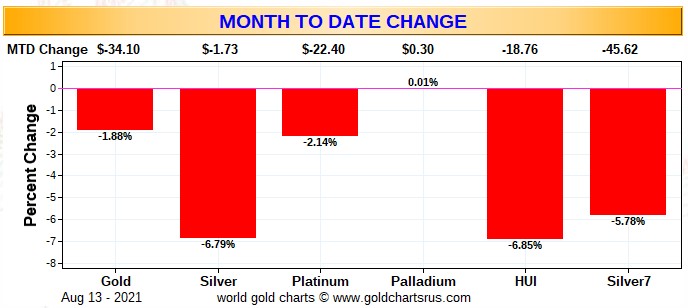
Here are the usual three charts that show up in every Saturday missive. They show the changes in gold, silver, platinum and palladium in both percent and dollar and cents terms, as of their Friday closes in New York — along with the changes in the HUI and the Silver 7 Index.
First off is the weekly chart -- and silver was the obvious 'underperformer'... courtesy of the Big 8 shorts. Even though gold closed higher on the week by a hair, their underlying equities couldn't manage the same feat.
Next is the month-to-date chart, which is now two weeks old -- and except for palladium, which is unchanged, it's a sea of red. Of course silver was the big loser, as it's the Big 8 shorts No. 1 problem child -- and it got hit the hardest for that reason. But it should be very carefully noted that the silver equities vastly 'outperformed' their golden cousins, despite that fact.
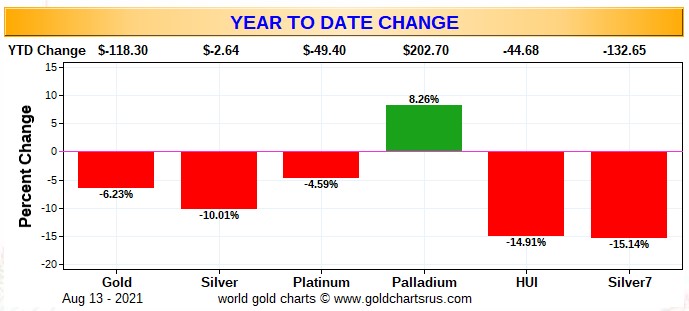
And here's the year-to-date chart -- and palladium is the only thing up on the year. Last week, this chart showed that gold and silver and their associated equities had both 'underperformed' about equally year-to-date, which I thought rather surprising at the time. But with this past week's performance added in, the underperformance of the gold equities is far more noticeable. However, it's a given that the underperformance of both precious metals won't last forever...or for long I would imagine.
As Ted Butler has pointed out on many occasions, the short positions of the Big 8 traders in general -- and the Big 4 short commercial traders in particular, are the sole reason that precious metal prices aren't at the moon already, as just about every other group of traders in the COMEX futures market are net long against them in all four precious metals...including all the rest of the traders in their respective commercial categories.
In the COT discussion further down, the commercial net short positions in both gold and silver fell by the expected huge amounts.
But as far as the Big 8 traders in gold was concerned, they barely made a dent in their monstrous short position, as Ted's raptors, the small commercial traders other that the Big 8, were hugely aggressive buyers during the reporting week -- and are now net long the COMEX futures market in gold. In silver, the Big 8 shorts fared far better, but even their improvement was relatively small in comparison to the overall.
---
The CME Daily Delivery Report showed that 15 gold and zero silver contracts were posted for delivery within the COMEX-approved depositories on the U.S. east coast on Tuesday.
In gold, the sole short/issuer was Marex Spectron -- and of the three long/stoppers, JPMorgan was the largest, picking up 12 contracts for its client account.
The link to yesterday's Issuers and Stoppers Report is here.
So far in the August delivery month, there have been 25,382 gold contracts issued/reissued and stopped -- and that number in silver is 1,939 contracts. There have also been 561 platinum contracts issued and stopped -- and that number in palladium is 2 COMEX contracts.
As Ted has pointed out for about decade now, JPMorgan is the big kahuna in everything gold and silver related. In gold so far this month they have issued 5,796 contracts out of their client account -- and stopped 8,646 contracts for clients as well. They have also stopped 3,929 contracts for their house account. In silver they have issued 1,541 contracts out of their client account -- and have stopped 710 contracts for clients as well.
The CME Preliminary Report for the Friday trading session showed that gold open interest in August dropped by 852 contracts, leaving 254 still around, minus the 15 contracts mentioned a few paragraphs ago. Thursday's Daily Delivery Report showed that 742 gold contracts were posted for delivery on Monday, so that means that 852-742=110 gold contracts vanished from the August delivery month. Silver o.i. in August declined by 14 contracts, leaving 161 still open. Thursday's Daily Delivery Report showed that 14 silver contacts were actually posted for delivery on Monday, so the the change in open interest and deliveries match for the second day in a row.
Total gold open interest at the close yesterday increased by only 768 COMEX contracts -- and total silver o.i. actually declined by 2,863 contracts...most likely short covering in both. These numbers are subject to some revision, usually downwards, by the time the final numbers are posted on the CME's website on Monday morning CDT.
---
There was a withdrawal from GLD yesterday, as an authorized participant took out 56,133 troy ounces of gold -- and there were no reported changes in SLV.
In other gold and silver ETFs and mutual funds on Planet Earth on Friday, net of any changes in COMEX, GLD & SLV inventories, there was a net 15,560 troy ounces of gold removed, but a net 26,951 troy ounces of silver was added.
The U.S. Mint had a sales report for the second day in a row, but this one was on the smallish side. They reported selling 3,000 troy ounces of gold eagles -- and 2,000 one-ounce 24K gold buffaloes.
Month-to-date the mint has sold 58,500 troy ounces of gold eagles...16,500 one ounce 24K gold buffaloes -- and 1,581,000 silver eagles.
I've been checking the Royal Canadian Mint's website for the last week or so now, hoping to discover their Q2/2021 Report, but so far, nothing...
----
There wasn't much activity in gold over at the COMEX-approved depositories on the U.S. east coast on Thursday. Nothing was reported received -- and only 10,513.377 troy ounces/327 kilobars was shipped out.
In the 'out' category, there were 280 kilobars that left Brink's, Inc. -- and the remaining 47 kilobars departed HSBC USA.
There was some paper activity, as 22,573 troy ounces was transferred -- and every ounce of that amount made the trip from the Registered category and back into Eligible...13,214.061 troy ounces/411 kilobars over at Malca-Amit USA...followed by the 6,272 ounce that was transferred at Brink's, Inc. The remaining 3,086.496 troy ounces/96 kilobars was transferred in that direction over at Loomis International. The link to all of Thursday's COMEX activity in gold, is here.
It was pretty quiet in silver as well. There was 139,243 troy ounces received -- and all of that ended up at Delaware. Only 975 troy ounces/one good delivery bar was shipped out -- and that departed Brink's, Inc. There was some paper activity, as 175,297 troy ounces was transferred from the 'Registered category and back into Eligible over at Manfra, Tordella & Brookes, Inc. The link to Thursday's silver activity is here.
But the big action on Thursday happened over at the COMEX-approved gold kilobar depositories in Hong Kong on their Thursday. They reported receiving 6,534 of them -- and shipped out 279. Except for the 150 kilobars that was dropped off at Loomis International, the remaining in/out activity occurred over at Brink's, Inc. as always. The link to that, in troy ounces, is here.
---
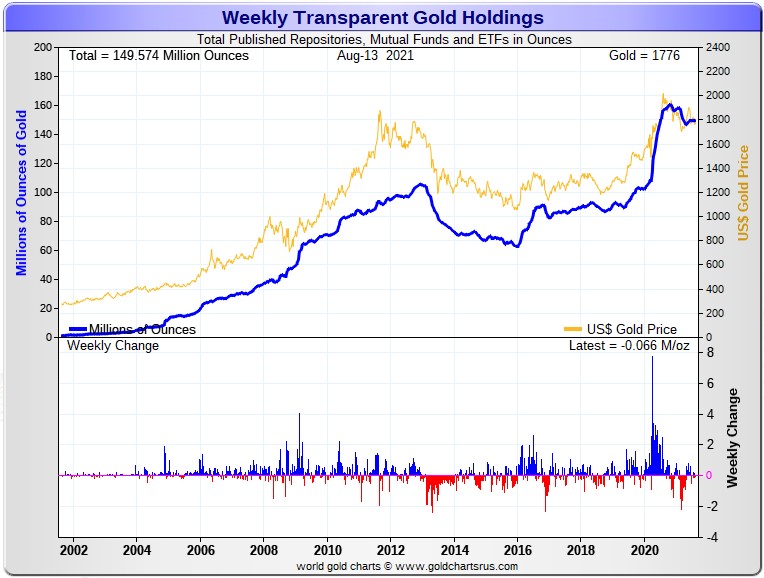
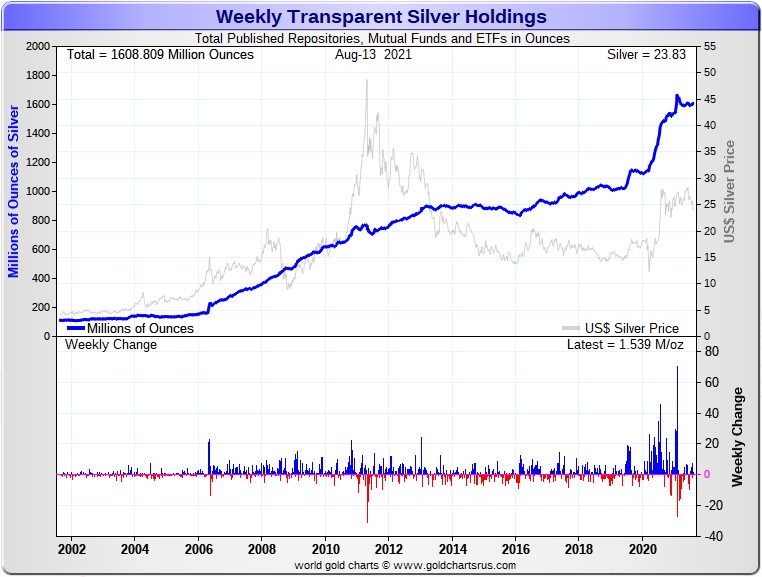
Here are the usual two 20-year charts that show up in this space almost every Saturday. They show the total amount of physical gold and silver in all know depositories, ETFs and mutual funds as of the close of business on Friday.
For the week just past, there was a net 66,000 troy ounces of gold removed -- and in silver, there was a net 1,539,000 troy ounces added.
Considering the price action in the precious metals this past week, the above numbers are simply astounding.
The silver number is particularly impressive, although that's mainly because of the 2+ million ounces that was added to SLV a couple of days ago. But even taking that into consideration, that's an incredible number as well.
Looking at the above two charts, one would never know that eye-watering engineered price declines had ever occurred in silver and gold during the last two weeks.
In fact, since late April in silver -- and the start of May in gold, there have been very slight increases in the total amount of gold and silver held in all known depositories, ETFs and mutual funds. That's despite the fact that gold and silver prices have been beaten into the dirt by the Big 8 traders since June 1 for gold -- and mid-June for silver.
That shows you just how tightly held the physical precious metals are -- and investors are hanging onto them with both arms and legs, despite the punishment handed out by the Big 8 shorts over that time period.
They're not fooled, as they know what's coming at some point in the near future.
----
The Commitment of Traders Report, for positions held at the close of trading on Tuesday, August 13 was the blockbuster that both Ted and I were expecting...and then some!
In silver, the Commercial net short position fell by 12,321 COMEX contracts, which equates to 61.6 million troy ounces.
They arrived at that number by increasing their long position by 9,166 COMEX contracts -- and also reduced their short position by 3,155 contracts. It's the sum of those two number that represents their change for the reporting week.
Under the hood in the Disaggregated COT Report, it was all Managed Money traders, plus a bit more, as they reduced their net long position by 13,670 COMEX contracts. Of that amount...9,423 contracts were new short positions put on. Ted wasn't overly happy about that, but I guess it should have come as no surprise.
The Nonreportable traders also decreased their net long position, them by 656 contracts. But the Other Reportables went in the other direction, as they increased their net long position by a fairly hefty 2,005 contracts.
Doing the math: 13,670 plus 656 minus 2,005 equals 12,321 COMEX contracts, the change in the Commercial net short position.
The Commercial net short position now stands at only 199.2 million troy ounces, down from the 260.8 million troy ounces they were short in last week's COT Report.
The Big 8 are short 271.9 million troy ounces of silver in this week's COT Report, compared to the 309.9 million troy ounces they were short in last week's Report...so they improved their short position by a fairly decent amount...38.0 million troy ounces.
However, the Commercial net short position in the headline number in silver dropped by 61.6 million troy ounces during the reporting week...so where did the other 61.6-38.0=23.6 million troy ounce decrease come from?
It came from Ted's raptors, the 31-odd small commercial traders other that the Big 8...as they are all long the silver market. They bought that amount during the reporting week -- and I'll continue the discussion on this in the 'Days to Cover' commentary a bit further down.
The short position of the Big 8 traders is larger than the Commercial net short position in silver by about 136 percent, compared to the 119 percent they were short in last week's COT Report. That increase is because of all the long contracts that Ted's raptor bought, as they're in the Commercial category as well, despite the fact that they're small, as it all adds up.
Here's the 3-year COT chart for silver, courtesy of Nick Laird as always -- and the change should be duly noted.
So, are we done to the downside? One would think so, but as Ted continually points out, one can never underestimate the treachery of the Big 4 shorts.
I would suspect that yesterday's rally in silver involved big selling by Ted's raptors, the commercial traders other than the Big 8, who are mega long the COMEX silver market. They would be locking in decent profits. And since silver's current price is well below any moving average that would cause the Managed Money traders to buy, it's a given that the Big 4/8 shorts were buying every long that the small traders have been selling since the Tuesday cut-off.
---
In gold, the commercial net short position fell by a chunky 35,643 COMEX contracts, or 3.56 million troy ounces.
They arrived at that number by increasing their long position by 3,371 contracts -- and also covered 32,272 short contracts. It's the sum of those two numbers that represents their change for the reporting.
And as impressive as the numbers for silver were in the Disaggregated COT Report, the changes under the hood in gold in that report were simply staggering!
The Managed Money traders reduced their net long position by an absolutely eye-watering 54,470 COMEX contracts, of which 33,442 contracts was new shorting. The Nonreportable/small traders also decreased their net long position by a huge amount...7,714 contracts. 'All of the above' means that the traders in the Other Reportables category had to go long big time -- and they did just that...to the tune of 26,541 contracts.
Doing the math: 54,470 plus 7,714 minus 26,541 equals 35,643 COMEX contracts, the change in the commercial net short position.
The commercial net short position in gold now sits at 19.57 million troy ounces, down big from the 23.13 million troy ounces they were short in last week's COT Report.
The short position of the Big 8 traders stood at 22.10 million troy ounces in this week's COT Report, compared to 22.83 million troy ounces they were short in last week's COT Report...down only 730,000 troy ounces from last week's COT Report.
What?
The headline number showed that that commercial net short position decreased by 3,560,000 troy ounces...a difference of 3,560,000-730,000=2,830,000 troy ounces from the number in the previous paragraph.
That meant that Ted's raptors, the small commercial traders other than the Big 8, were hugely aggressive buyers during the reporting week...increasing their long position by that amount...around 28,300 COMEX contracts!
The Big 8 traders are short about 113 percent of the commercial net short position in gold...up from that 99 percent that they were short in last week's report -- and that's entirely due to the monster long-buying by the small commercial traders during this reporting week.
Here's Nick Laird's 3-year COT chart for gold, updated with Friday's data -- and the weekly change should be noted.
But between these raptors and the Other Reportables, who also went mega long in gold during the reporting week, it's my opinion that all their long-buying was most likely insider trading of one type or another...friends, relative and business associates of the Big 4/8 shorts who knew these engineered price declines were coming. I brought this up with Ted -- and he thought that was most likely as well.
Of course the flip side to this is the fact that despite their huffing and puffing, the short position of the Big 4/8 traders improved by a negligible amount -- and Ted is of the opinion that this is the best they're likely to do considering how aggressively the Raptors and Other Reportables are buying longs against them.
However, as he most succinctly pointed out in his mid-week commentary on Wednesday..."Not for a moment would I underestimate the treachery and guile of the COMEX commercial shorts. But regardless of how skilled and corrupt they may be, they are still bounded by the realities that exist."
Those realities may have been reached this week.
Now, all that matters is whether these same Big 4/8 will go back on the short side when the next serious rally in the precious metals is allowed to begin.
Ted thinks not -- and so do I. But there are no guarantees.
----
In the other metals, the Managed Money traders in palladium increased their net long position by a fairly healthy 440 COMEX contracts during the last reporting week -- and are net long the palladium market by 2,981 COMEX contracts...around 29 percent of the total open interest...up about 5 percentage points from last week's report. In platinum, the Managed Money traders increased their net short position by a further 4,749 contracts -- and are now net short the platinum market by 8,879 COMEX contracts. In a strange twist they, along with the Big 4/8 traders, are the only categories that are short platinum right now. The other three categories are mega long, including the rest of the commercial traders. In copper, the Managed Money traders decreased their net long position by a further 7,544 COMEX contracts -- and are net long copper by only 31,102 COMEX contracts...about 778 million pounds of the stuff -- and about 16 percent of total open interest...down about 2 percentage points from last week.
---
Here’s Nick Laird’s “Days to Cover” chart, updated with the COT data for positions held at the close of COMEX trading on Tuesday, August 10. It shows the days of world production that it would take to cover the short positions of the Big 4 — and Big '5 through 8' traders in each physically traded commodity on the COMEX.
I consider this to be the most important chart that shows up in the COT series -- and it deserves a minute of your time.
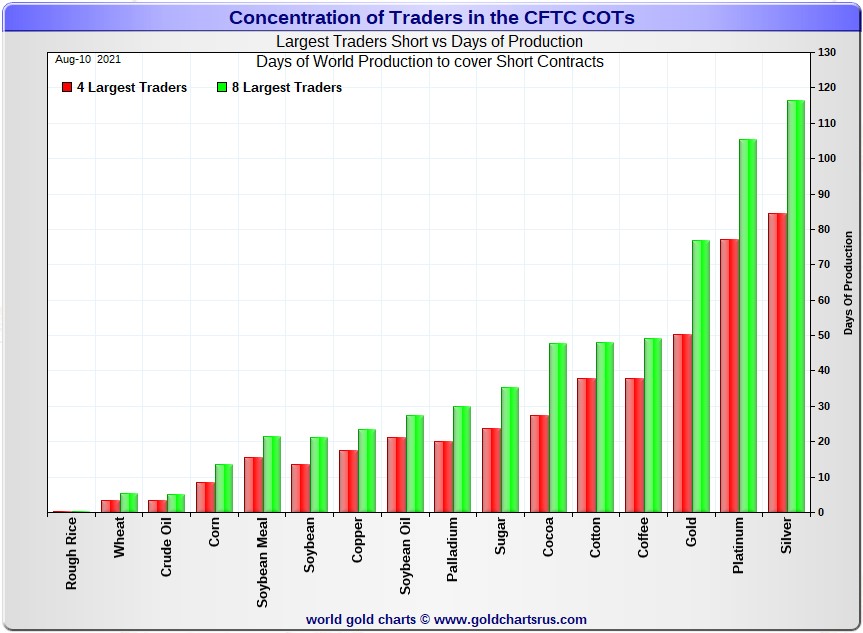
In it, the Big 4 traders are short about 84 days of world silver production, down about 16 days from the prior week's report. The ‘5 through 8’ large traders are short an additional 32 days of world silver production...down about 1 day from the prior COT Report for a total of about 116 days that the Big 8 are short...down a whopping 17 days from last week's COT report. [In the prior reporting period they were short 133 days of world silver production.]
That 116 days that the Big 8 are short, represents just under four months of world silver production, or 271.9 million troy ounces of paper silver held short by the Big 8.
In the COT Report above, the Commercial net short position in silver was reported by the CME Group at 199.2 million troy ounces. As mentioned in the previous paragraph, the short position of the Big 4/8 traders is 271.9 million troy ounces. So the short position of the Big 4/8 traders is larger than the total Commercial net short position by 271.9-199.2=72.7 million troy ounces...up about 23.6 million troy ounces/4,720 COMEX contracts from last week's report.
This long buying by the small commercial traders was in direct competition with the buying by the Big 4/8 shorts.
The reason for the difference in those numbers two paragraphs ago...as it always is...is that Ted's raptors, the 31-odd small commercial traders other than the Big 8, are net long that amount...72.7 million troy ounces.
Another way of stating this [as I say every week in this spot] is that if you remove the Big 8 shorts from the commercial category, the remaining traders in the commercial category are net long the COMEX silver market. It's the Big 8 against everyone else...a situation that has existed for almost five decades in silver, platinum and palladium -- and now in gold as well.
As per the first paragraph above, the Big 4 traders in silver are short around 84 days of world silver production in total. That's about 21 days of world silver production each, on average...down 4 days from last week's COT Report. The four big traders in the '5 through 8' category are short 32 days of world silver production in total, which is 8 days of world silver production each, on average...down a bit from last week's COT Report.
I don't remember the last time that the short positions of the Big 8 was this low, but I know that Ted will have that data in his weekly review this afternoon.
And it's also obvious that the Big 4 shorts were much more aggressive in their short covering than the Big '5 through 8' shorts during this past reporting week...although much more in silver than in gold.
The Big 8 commercial traders are short 35.2 percent of the entire open interest in silver in the COMEX futures market, which is down a knee-wobbling amount from the 42.4 percent they were short in last week's COT report. And once whatever market-neutral spread trades are subtracted out, that percentage would be a bit over the 40 percent mark. In gold, it's 46.3 percent of the total COMEX open interest that the Big 8 are short, which is down only a tiny amount from the 47.0 percent they were short in last week's COT Report -- and something over the 50 percent mark once their market-neutral spread trades are subtracted out.
In gold, the Big 4 are short 50 days of world gold production, down about 3 days from last week's COT Report. The '5 through 8' are short 27 days of world production -- up about 1 day from last week's report, if you can believe it...for a total of 77 days of world gold production held short by the Big 8 -- and down about 2 days from the prior COT Report. Based on these numbers, the Big 4 in gold hold about 65 percent of the total short position held by the Big 8...down about 2 percentage points from the prior week's COT Report.
The "concentrated short position within a concentrated short position" in silver, platinum and palladium held by the Big 4 commercial traders are about 72, 73 and 67 percent respectively of the short positions held by the Big 8...the red and green bars on the above chart. Silver is down about 2 percentage points from last week's COT Report...platinum is also down 2 percentage points from a week ago -- and palladium is down about 1 percentage point week-over-week.
And as I keep saying month after month, despite the recent improvements in the short positions of the Big 4/8 traders...including the price bombings last Friday -- and again on Monday, they're still hugely short in all four precious metals in the COMEX futures market. But it's now mostly the Big 4...or probably just the Big 2 or 3...Citigroup, Bank America and HSBC -- and the above chart tells you all you need to know about their current plight.
They're still stuck on the short side -- and that's for the very simple reason that the Managed Money traders are no longer willing to go mega short like they used to in the past. Yes, they did increase their short positions by notable amounts during this past reporting week, but not enough to make any material difference to the short positions of the Big 8 traders...particularly in gold. And because of that, the Big 4/8 traders can't cover.
The situation regarding the Big 4/8 shorts continues to be beyond obscene, twisted and grotesque...especially the Big 2/4 -- and as Ted correctly points out, its resolution will be the sole determinant of precious metal prices going forward.
********
share
share
share
share
share
More from Gold-Eagle


