Identifying Winners in the Business of Gold - Part II, Top Picks


 Last week we looked at a methodology for identifying select equities that have the potential to rise thousands of percent after a market crash. The technical criteria involves finding a market sector that has undergone a severe Stage IV decline (stage analysis, see graph below) and then scanning for individual companies that are significantly outperforming during the final parts of the crash (relative strength). These are the companies showing signals similar to Amazon in 2008, which has risen 1,100% since the crash of that year.
Back to Gold Miners
The precious metals complex is now bottoming at the end of its nearly five year decline. Thus, we are looking for the next major opportunity to find high relative strength candidates at the end of a bear market. Since the high for gold in 2011 at $1,917 per ounce, the price of the yellow metal has fallen approximately 44%, to $1,075. The final absolute low may not be in yet, but we believe the commodity is in a bottoming process-- a technical term for a pattern that indicates a change in trend is pending.
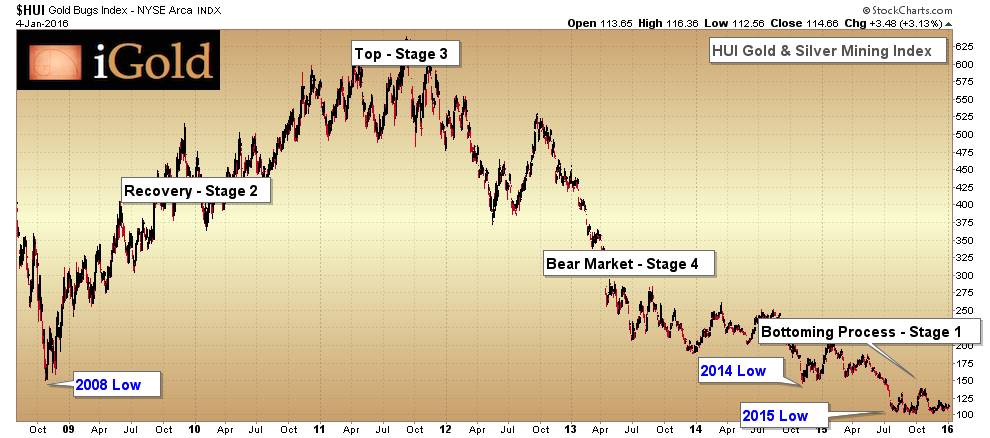
For most of my work, I focus on the HUI Gold & Silver Mining Index, because between it and the related XAU index, the HUI is the better performing. When looking for strong individual stocks, I want to compare my candidates to the strongest index possible.
For reference, below is a standardized chart showing stage analysis, and then a chart of the HUI Index since the crash of 2008 showing the same stages: a recovery, a top, a bear market and now a bottoming process.

Just as the examples of Amazon / Citibank in the last article used relative strength compared to the S&P 500, the methodology used to find our top mining stocks will use the relative strength of each gold miner compared to the HUI Index. In this way we will see which companies are outperforming or underperforming as the decline has unfolded.
We are primarily concerned with the strength relative to the three lows labeled above in blue: 2008 Low, 2014 Low, and 2015 Low. Those mining companies that have a 2014 or 2015 Low above the 2008 Low are strong candidates, because the HUI Index itself recently fell lower than the 2008 Low. Moreover, stocks that have a 2015 low that is also higher than the 2014 low are the strongest of the strong, indicating that insiders are refusing to sell these stocks no matter what happens to the rest of the gold market. These are the stocks that are poised to take off and provide spectacular gains during the next leg of gold's surge.
Refining the Selection Process with Fundamentals
After performing technical analysis, we always confirm findings with fundamental analysis. We want to be sure that that companies we identify have legitimate metal deposits, with high grades of mineralogy, and sufficiently-low cash costs to extract ounces from the ground at a healthy profit margin. We also pay attention to the political situation in the country where primary mines are located, history of share dilution, and an ability to grow production over the years ahead. High organic exploration potential is the icing on the cake.
When both the technical analysis and the fundamental analysis reveal compelling cases, we place the company on our watch list. These are companies that we intend to add to our portfolio when we have sufficient confirmation that the broad HUI Index has bottomed and the individual stock shows the right technical setup for a high-probability investment.
We have evaluated hundreds of gold mining stocks, and bring to you here two of the strongest examples for consideration. These are the companies that are poised to provide tremendous gains once the price of gold and the HUI Index stabilize and begin uptrends.
In the future we will release additional reports on new selections in our mining watch list. As always, we provide free video updates on the latest action in gold and silver on our website.
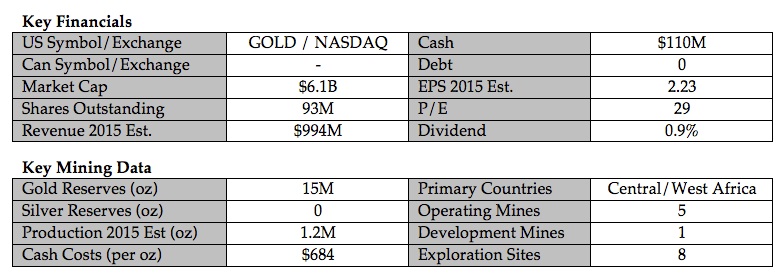
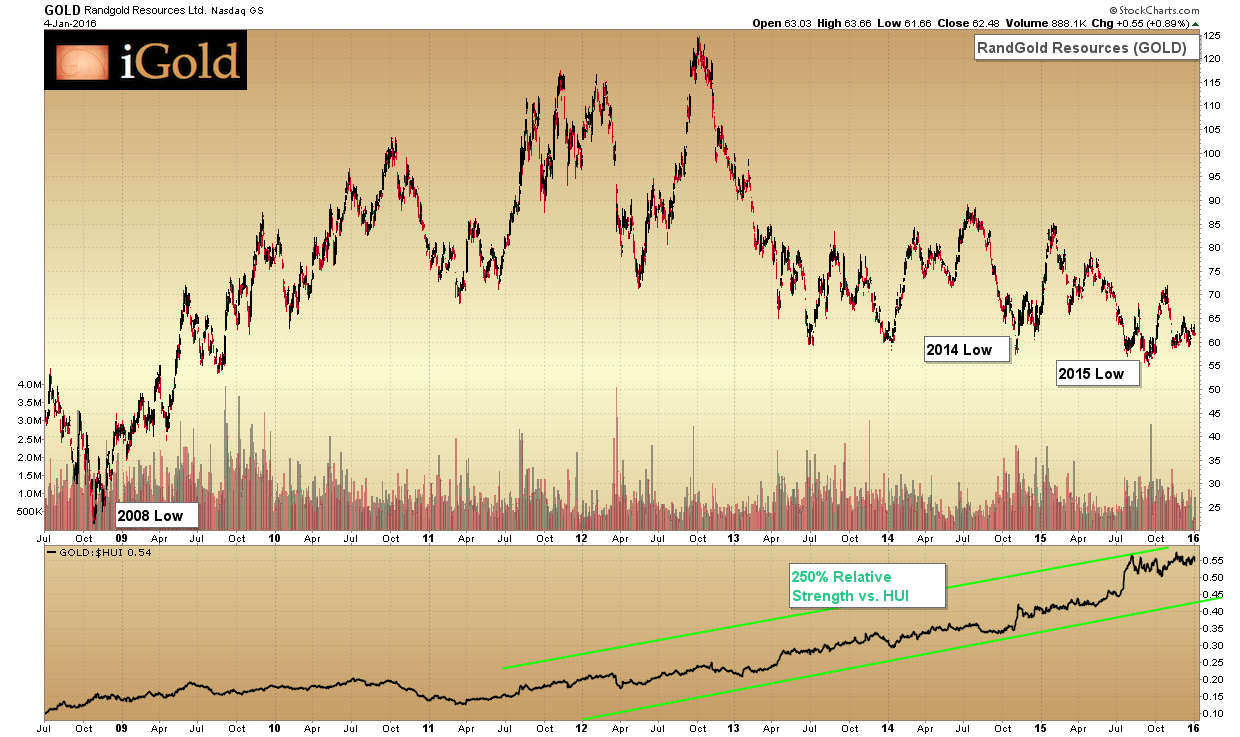
Company 1 - RandGold Resources

Analysis
RandGold -- achieved record gold production in 2014, up 26% from 2013. Fully retired all debt in 2013. Cash in the bank and in-house exploration ensures future production increases in the pipeline. Lowest cash costs of any major-tier miner. Extremely small float of shares for a company this size. All properties are located in Congo and West Africa, which have a history for moderate political risk.
Relative strength is 250% compared to the HUI, the highest of any major-tier pure miner (non-royalty). 2015 Low and 2014 Lows are well above 2008 Low, indicating significant insider accumulation as the gold bear market has progressed. The 12 and 36-month targets are conservative, and should be exceeded much quicker if gold prices begin to rise again.
12 Month Target: $90
36 Month Target: $120
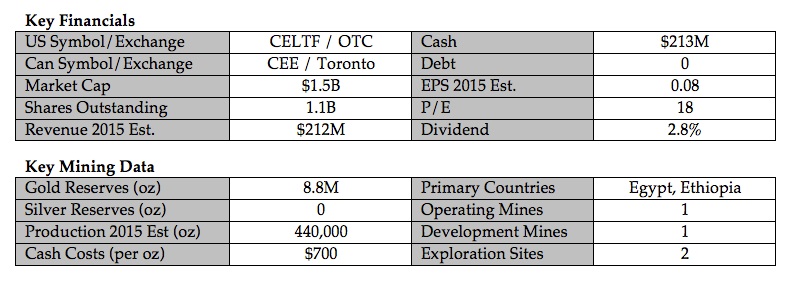
Company 2 - Centamin

Analysis
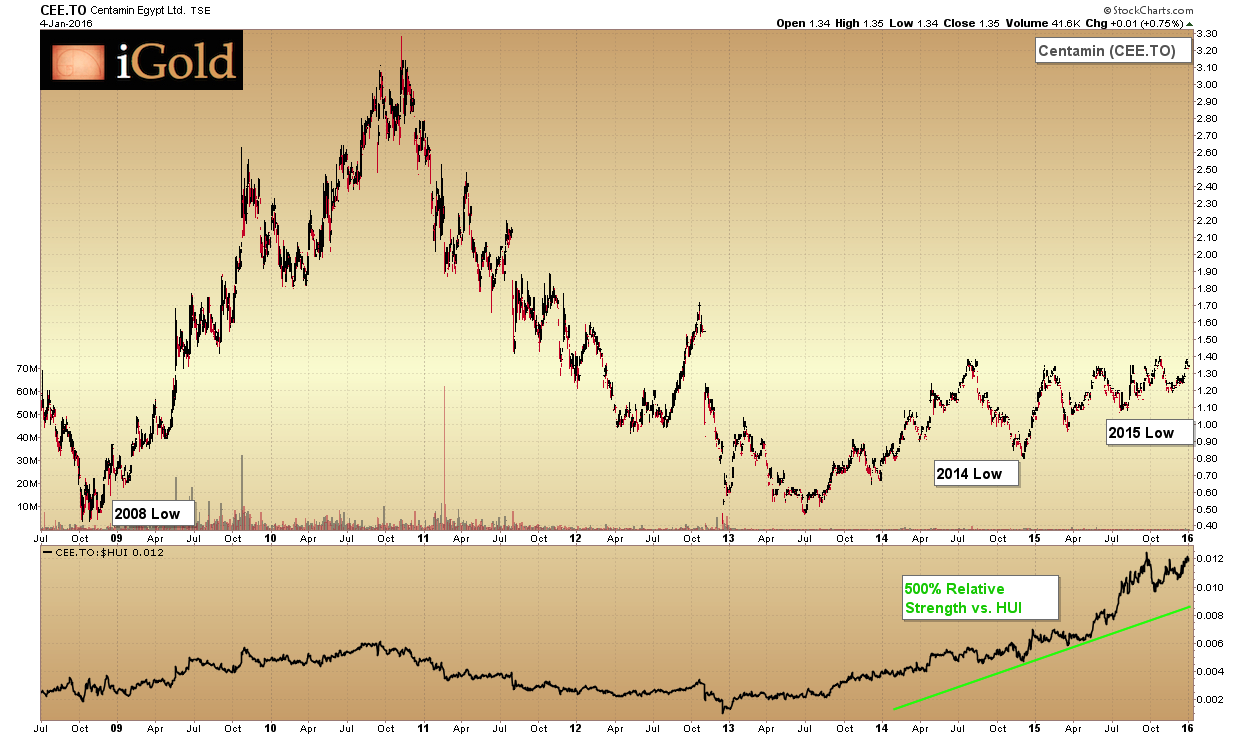
Centamin -- no debt and pays a dividend amongst the highest in the industry. Significant cash reserves and healthy operating margins ensure future organic growth. Production at primary Sukari mine expected to grow to 500K oz in 2017 even as cash costs continue to decline. Fell significantly due to political concerns after Egyptian Revolution in 2011. The country now stabilized, concession agreement with Egyptian government being appealed and likely to be reversed by the Supreme Court.
One of the strongest relative strength profiles of any mid-tier mining company at 500%. Significant outperformance since the 2008 Low compared to the HUI. 2014 and 2015 Lows are progressively higher, indicating insider refusal to sell even as other mining companies make lower lows. Anticipated that this company will exceed former all-time high ($3.30) well before gold re-challenges $1,900.
12 Month Target: $2.40
36 Month Target: $3.20
********
Disclaimer:
Always perform your own due diligence before making any investment or purchasing any security. Nothing in this article should be considered investment advice; rather, this is our proprietary methodology for selecting high quality gold and silver equities. At the time of this writing, we have no positions in these securities, but intend to establish positions for ourselves and/or clients once proper technical signals are given. We receive no compensation from any of the companies profiled in this article.

Christopher Aaron began his career as an intelligence analyst for the CIA and Department of Defense. He served two tours to Afghanistan and Iraq between 2006 - 2009, conducting pattern-of-life mapping for military leaders.
Mapping shares similarities with technical analysis of the financial markets because both involve the interpretation of repeating patterns found in human nature. He is the founder of iGold Advisor, providing independent research and analytics on all aspects of the precious metals markets.
He speaks regularly on the cyclical patterns found within the financial markets and on international policy. He has been featured in the New York Times and NPR news amongst other financial publications.


