Technical Analysis Of The Markets


Current Position of the Market
SPX: Long-term trend – The bull market is continuing with a top expected in the low 3000s.
Intermediate trend – The intermediate correction from 2872 should now continue until May.
Analysis of the short-term trend is done on a daily basis with the help of hourly charts. It is an important adjunct to the analysis of daily and weekly charts which discusses the course of longer market trends.
Ready for a Rebound?
Market Overview
Friday 03/16 close: 2752 – Friday 03/23 close: 2588! The bulls are crying: “Enough!”, and they must be heard because, as the title suggests, an oversold bounce should come as early as Monday. The cycles which predicted this decline are being validated (present tense) because there should be more to come. This will be an oversold bounce which is not even governed by a cycle low, but by structure and by positive divergence in the hourly indicators. The next cycle low is due on 3/29, and another a week later. After that, we could have a decent rally (in a downtrend) with the correction most likely ending in May in conjunction with the bottoming of the 40-wk cycle.
Because of the congestion pattern which was created across the 2760 level over the past month, the P&F chart has given us a potential count which has been mostly filled for the current cycle phase, but a little more remains on the downside which should be completed over the next week or so. After that time, we should get an idea of how much of a rally we could achieve before the 40-wk cycle pressures the market into the final phase of this correction.
Chart Analysis (These charts and subsequent ones courtesy of QCharts)
SPX Daily Chart
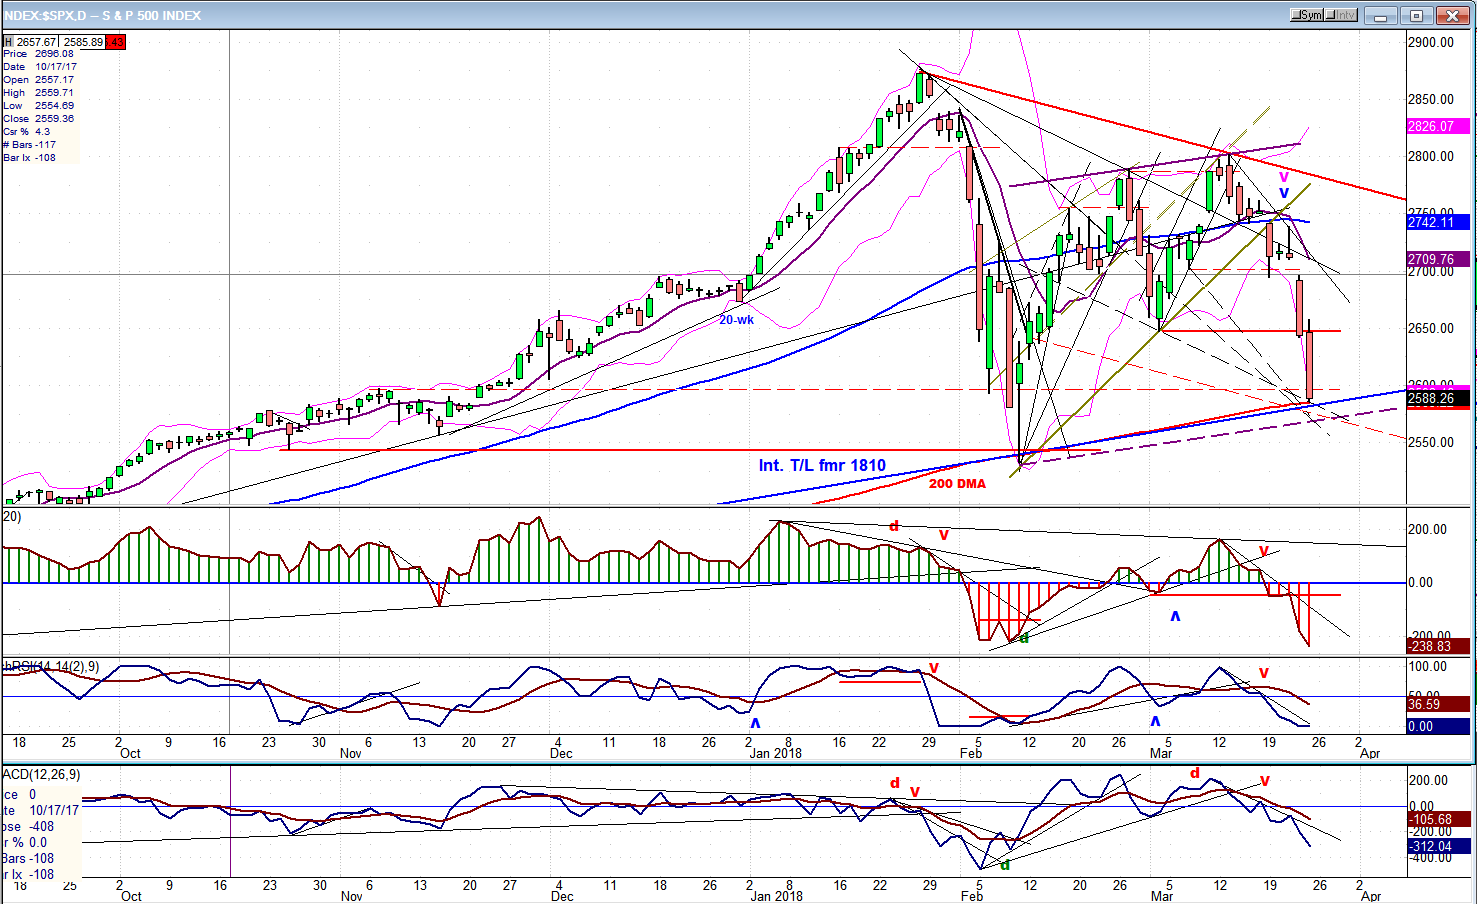
A week ago Friday, SPX closed on a support level consisting of trend lines and MAs. On Monday, the index broke below that level and after hesitating for a couple of days, decided to fall apart! Thursday and Friday were particularly brutal with respective adjunct declines of 70 and 42 points. The 3/02 low of 2647 held prices for less than two hours before giving way, and by Friday’s close, we had arrived at the support which had previously contained the first price avalanche on 2/09: the 200-DMA and the intermediate trend line from 1810. Reaching that level, and the fact that we are very oversold with hourly indicators showing good positive divergence, besides having probably completed a 5-wave structure from our last rest stop high of 2739, strongly indicates that an imminent bounce is coming. But that support is not expected to hold for very long because some cycles will be bottoming over the next week or 10 days, and this should cause the index to move a little lower and complete the projection count accrued for this phase of the decline. But considering the near-term conditions at Friday’s close, it’s likely that we will first have a bounce.
Why not more than a bounce? Because all three oscillators are still in a declining stage, and with this kind of weakness, a little repair work lasting a few days should be expected. If you look at the pattern of the CCI at the previous low of Feb 9th, it formed a double bottom with positive divergence showing on the second bottom as SPX dropped to a new low. Something along those lines would lead us to suspect that the index is ready for a corrective rally. Over the near-term, I would not expect anything more than an upward correction of limited scope because the 40-wk cycle low is still ahead of us and I just don’t see any way that a move to a new high could even be attempted until after it has bottomed.
SPX Hourly Chart
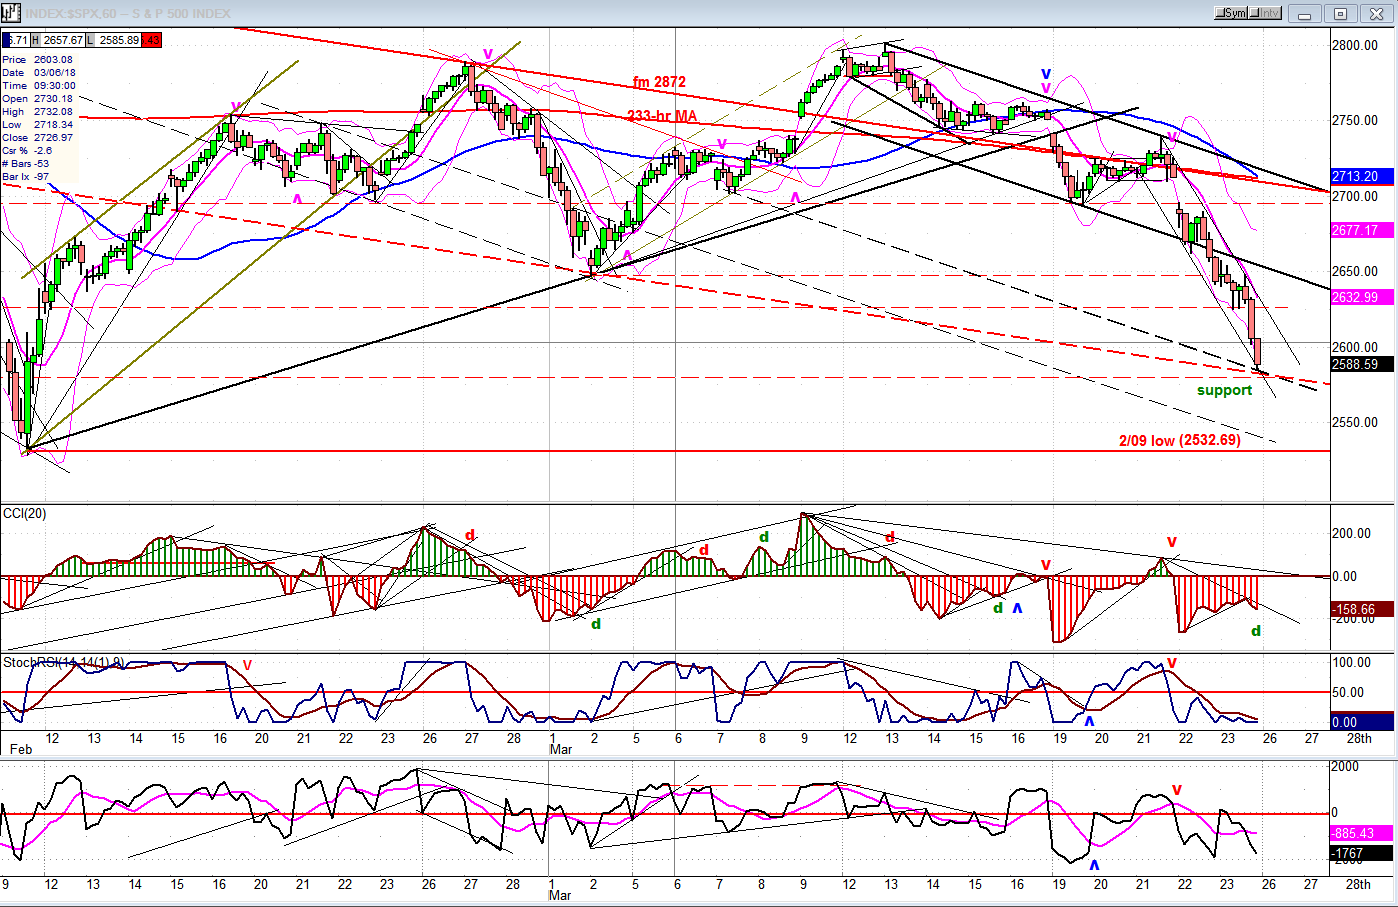
I have mentioned before the value of trend line parallels when trying to determine support and resistance levels. We have a couple of examples, here. In the first one, by drawing a parallel to the red trend line at the 2847 low and extending it to Friday’s date, we find that it crosses just below the low of the day. This could provide temporary price support. The second example concerns the short black channel line connecting the two points of the current downtrend. I have drawn a parallel at the 2709 level to create the bottom line of that channel. If I double the width of the channel (dashed black line below) I find that the dashed line connects the March 7 low to Friday’s low, which should also create support. When the price is weak enough to go through the bottom channel line of an existing channel, it frequently creates a new price channel twice the width of the original one. (I have shown examples of this before).
So we have here two bottom channel lines adding their support to the level at which SPX made its low on Friday. Considering the various conditions listed which suggest that we are due for a bounce, I would find it surprising if we did not rebound from here before going lower. As an analyst, I try to find clues which have some value in forecasting future price moves. Several clues point to a bounce as early as Monday morning, but that does not mean that the market will heed them -- at least right away. We could extend the decline first, and then bounce. Either way, I think we have the conditions necessary for a short-covering rebound.
TRAN, IWM, SPX (Daily Charts)
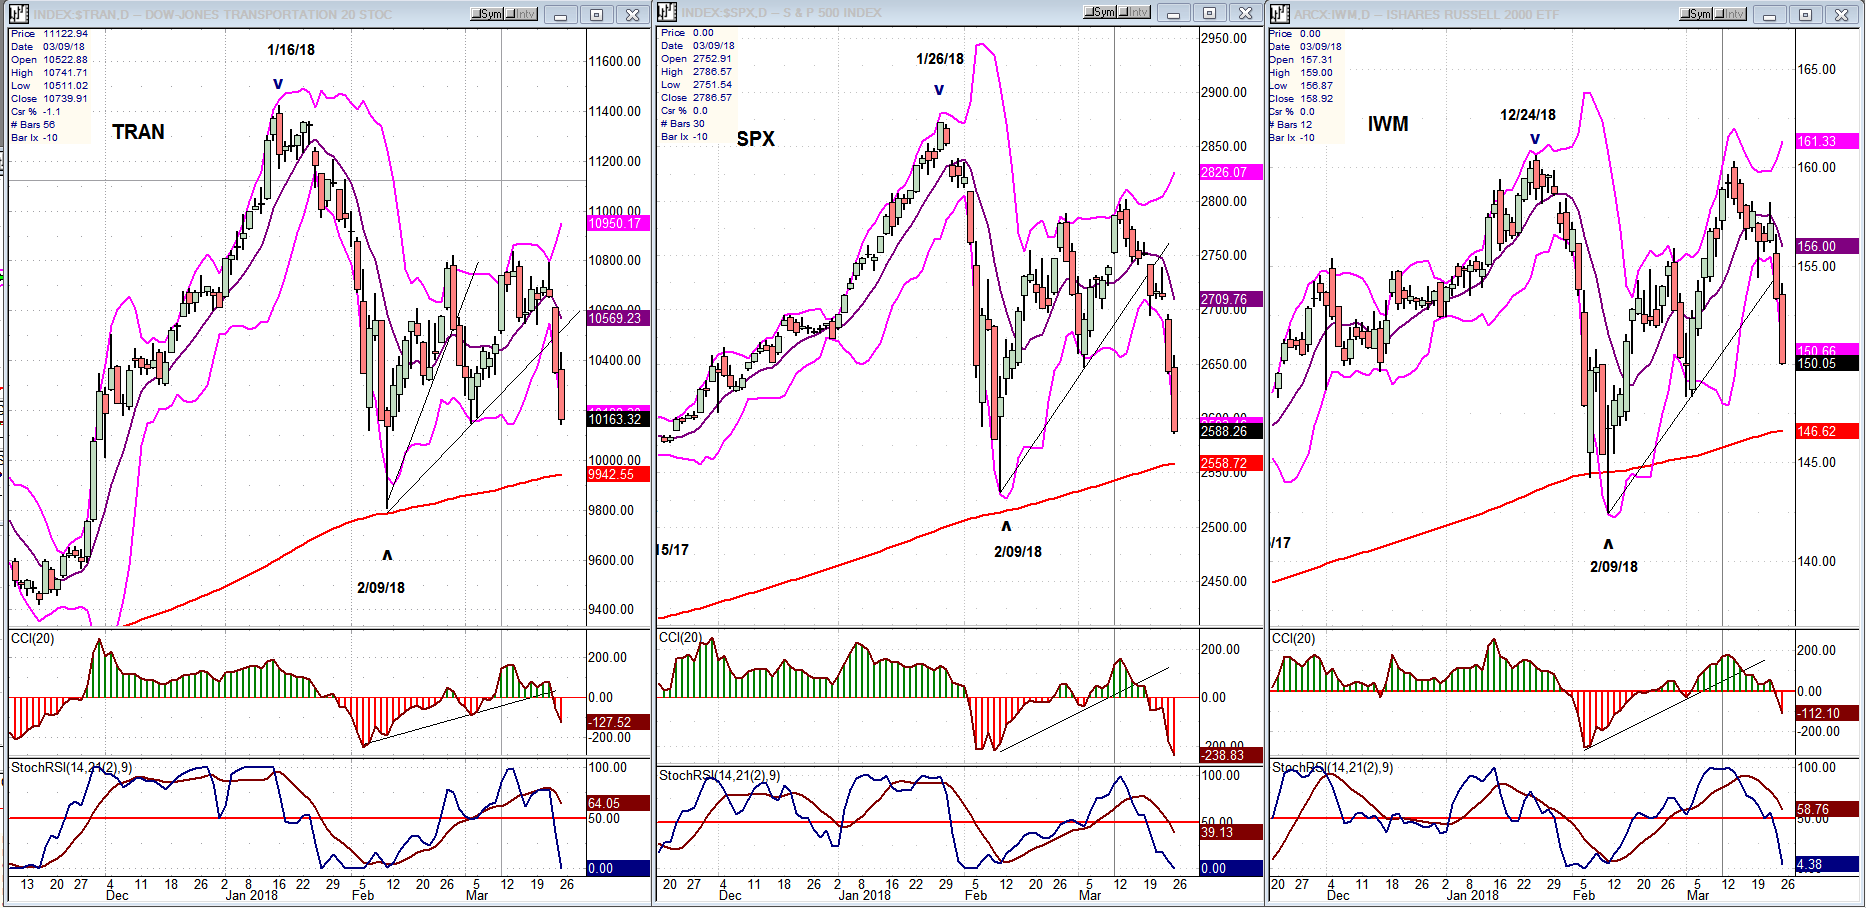
Over the years, market conditions change and the relationship between SPX and these two “leading” indexes has changed. There are now many volatile high flyers which are part of the S&P 500, and it makes that index more volatile than it used to be. You can see it on the chart below! Helped by all the selling that has taken place in the overbought tech sector, SPX is now leading the other two on the downside. But in spite of its near-term weakness, IWM still remains the strongest of the three, which I interpret as telling us that this is a corrective move and not the beginning of a major decline.
UUP (Dollar ETF)
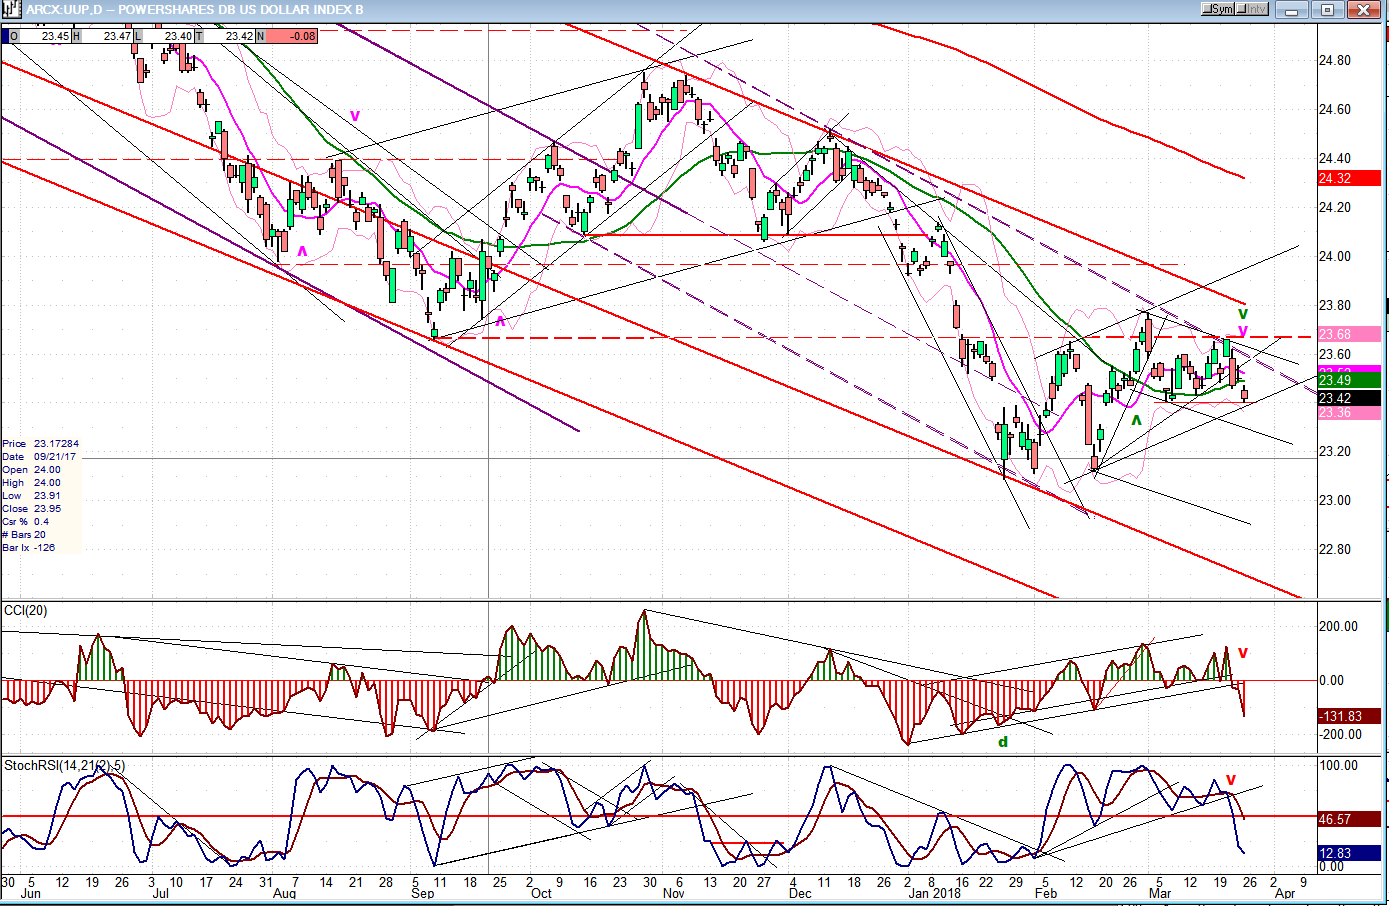
UUP found good support at 23.09 and rallied, but its advance was stopped on three separate occasions by resistance incurred at the last short-term low of ~23.70. After the third attempt, it has given up and is starting to retrace. The oscillators have already given a sell signal and it has closed below below the 30-DMA. This suggests that it is ready to resume its long-term decline, and the larger structural pattern points to the start of a possible wave 5 from the 24.70 high. If so, a new low for the move should be expected, especially since the P&F chart gives us a target of about 22.50.
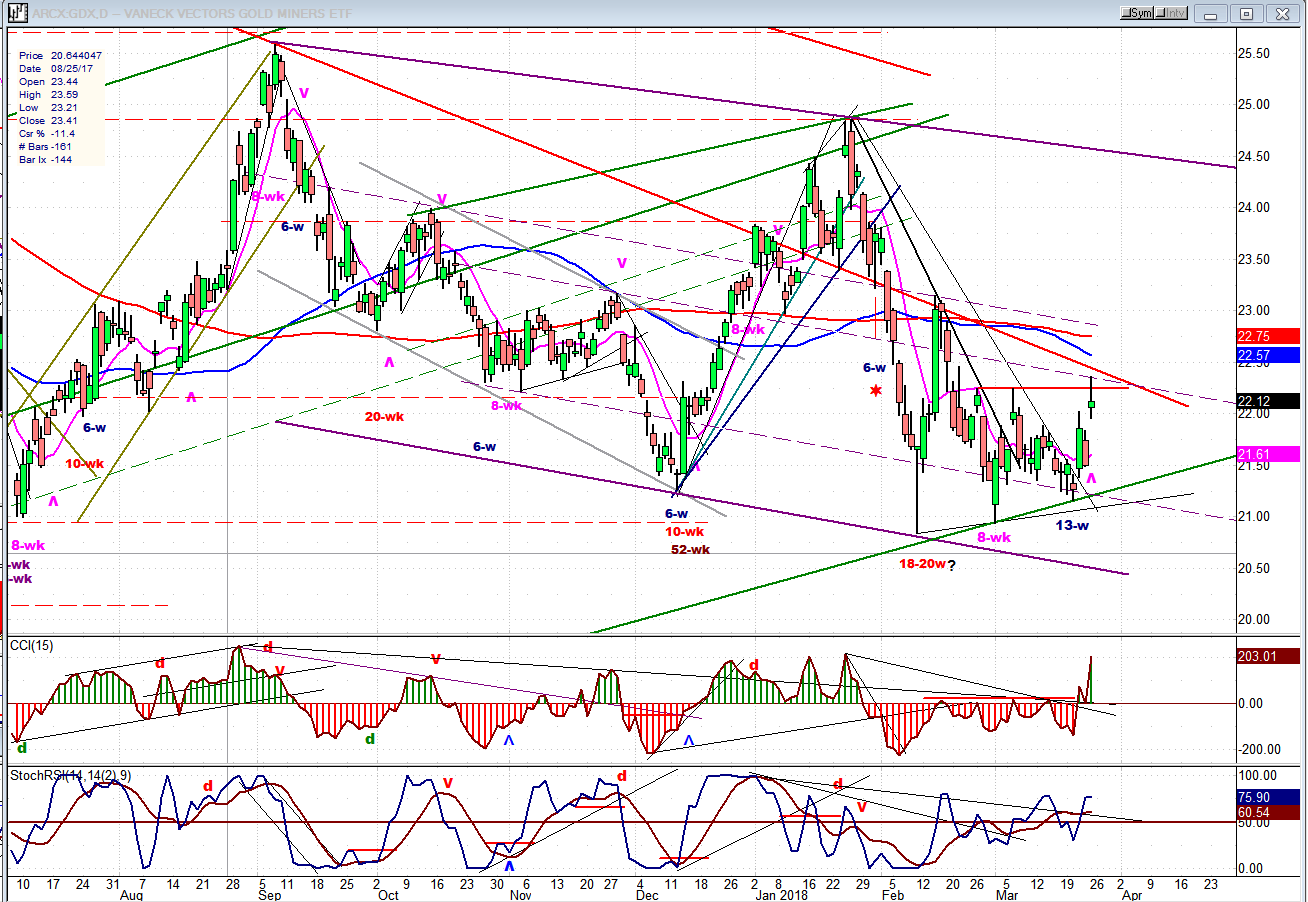
GDX (Gold Miners ETF)
GDX has responded to the bottoming of its 13-wk cycle with a trend reversal which has moved the price to the top of its congestion base pattern. That pattern gives it a potential move to 25.50, providing it can overcome the resistance which lies just above Friday’s close. It has until May to accomplish this feat, so the odds seem to be favorable, especially if UUP has already started to move in the opposite direction.
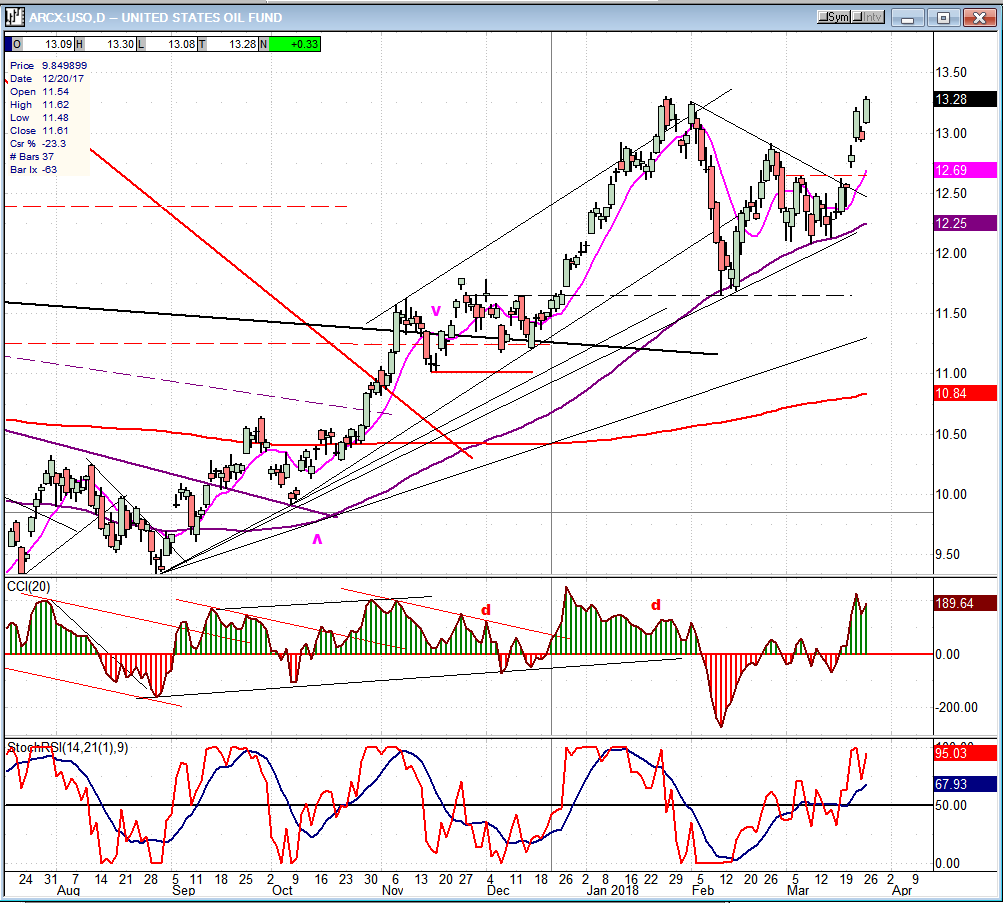
USO (United States Oil Fund)
USO held on to its 89-DMA while consolidating, and is attempting to resume its uptend. It is already challenging the former high, but will need to get past it to fulfill the promised target of 14.50-15.00 over the short-term.
Summary
SPX continues its intermediate correction which is expected to last until May. Last week was characterized by severe weakness which has left the index very oversold, near-term. For the reasons given above, I expect a short-covering rebound to take place, followed by a base-building period of a week or so which could see slightly new lows before a good counter-trend rally takes hold.
*********
FREE TRIAL SUBSCRIPTON
With a trial subscription, you will have access to the same information that is given to paid subscribers, but for a limited time period. I think you will find that knowing how far a move can carry is one of the most useful benefits of this service, whether you are a trader or an investor -- especially when this price target is confirmed by reliable indicators which give advance warning of a market top or bottom. Furthermore, cycle analysis adds the all- important time element to the above price projections.
For a FREE 4-week trial, further subscription options, payment plans, and for general information, I encourage you to visit my website at www.marketurningpoints.com.
The above comments about the financial markets are based purely on what I consider to be sound technical analysis principles. They\represent my own opinion and are not meant to be construed as trading or investment advice, but are offered as an analytical point of view which might be of interest to those who follow stock market cycles and technical analysis.

When Andre Gratian was a stock broker years ago, a friend introduced him to technical analysis of the market. Consequently, it is not an exaggeration to say that Andre fell in love with this approach! Ever since then, it has become an increasingly important part of his professional life. Gratian has studied the works of Wyckoff, Edwards & Magee, Edward J. Dewey (cycles) and many others. However, one of my most profitable undertaking has probably been to study Point & Figure charting, which he finds invaluable in analyzing stocks and indices. If he were restricted to one methodology, this is the one that he would choose. This well-rounded background has given him what he feels to be a special insight into the stock market, facilitating the recognition of meaningful patterns and the ‘turning points’ in all trends, whether they be short or long term. Andre feels very comfortable discussing the stock market and passing on meaningful information to others. His subscribers include individuals and money managers throughout the world. Moreover, his Newsletters are currently published on several financial sites, here and abroad.


