Technical Analysis Of The Markets


Current Position of the Market
SPX: Long-term trend – There are no signs that the long-term bull market is over.
Intermediate trend – Correction over? Resuming uptrend?
Analysis of the short-term trend is done on a daily basis with the help of hourly charts. It is an important adjunct to the analysis of daily and weekly charts which discusses the course of longer market trends.
Market Review
Point And Figure Overview of SPX
Long-term trend: The bull market which started in 03/09 shows no sign of having run it’s course. A rough count taken on the long-term Point & Figure chart gives us a potential target to as high as 4080. P&F does not predict time, only price. (no change)
Intermediate trend: If this develops into an intermediate uptrend, the next projection is 3630. This projection will not change if another pull-back first occurs.
Important Cycles
There are an infinite number of cycles of all magnitude. It is impossible to identify them all. Eric Hadik is the cycle expert and even he does not always predict their influence precisely 100% of the time. I follow only a few cycles which have shown consistency, and use them as part of my analysis.
The 20-wk cycle is due on about 2/26.
Market Analysis (Charts courtesy of QCharts)
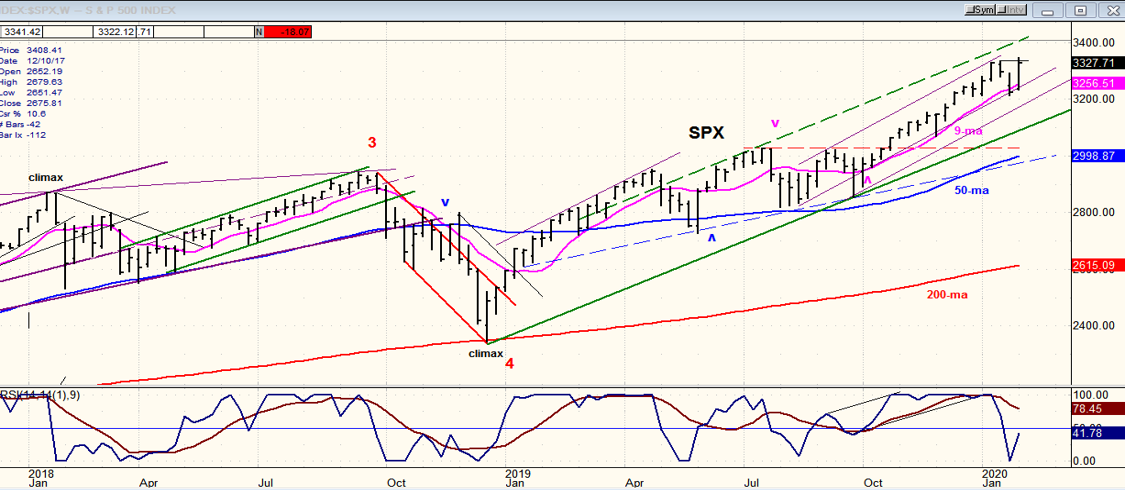
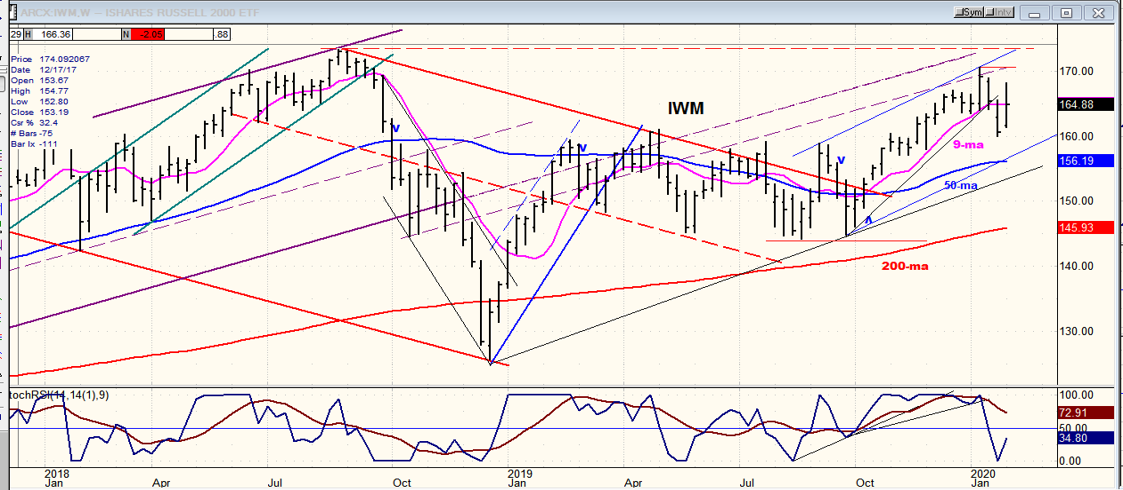
SPX-IWM weekly charts
With the bottoming of the 2-yr cycle, SPX should be starting another intermediate uptrend. Last week it made a slightly higher all-time high of 3348, but IWM did not make a new high -- which caused some significant relative weakness. It is not the only one! The Transportation index is also lagging heavily. SPX is benefiting from super-strong, large tech stocks which has sent QQQ soaring the past few days, but the latter appears to be reaching a projection target which can cause it to retrace at any time.
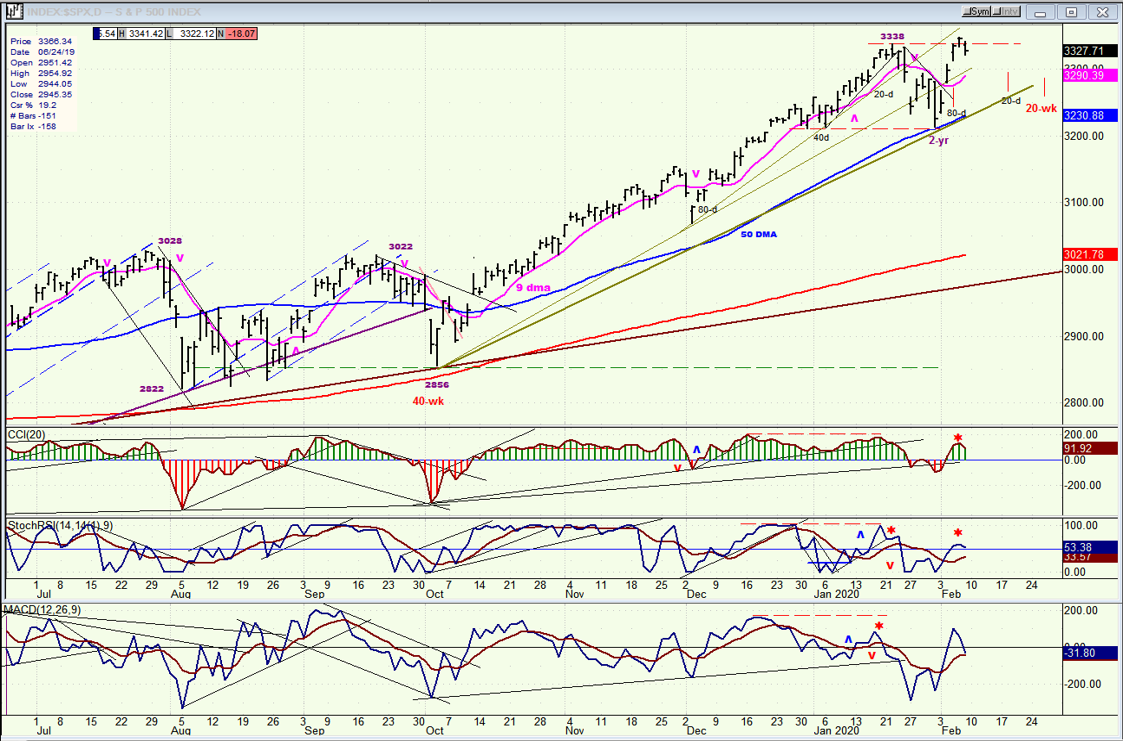
SPX daily chart
The 2-yr cycle bottomed last Monday and created a rally which immediately took the SPX to 3348, surpassing the former high by 10 points. By Friday, the index had become overbought and started to correct. Actually, the pull-back could be due to structure which should cause only a modest retracement, followed by a new high in a bullish scenario. If, however, we drop back beyond 3290 instead of making a new high, we would be left with an incomplete corrective wave which would put a totally different slant on the market position, and could take the index down to the original projection of ~3150 before rising to a new high.
Before we call for a new intermediate uptrend, let’s see what transpires over the next few days. There are several reasons for caution! To start with, the SPX oscillators do not look all that great. Divergence is showing in all three with the SRSI being the worst performer -- particularly telling since this is the index which usually leads the CCI.
Above, I already mentioned several other negatives including the relative weakness in both IWM and TRAN, and the fact that QQQ is near (at) a short/intermediate projection target. The DJIA and QQQ indicators are also calling for caution. Given this background, it may be wise to let the market define itself a little better over the next week or so.
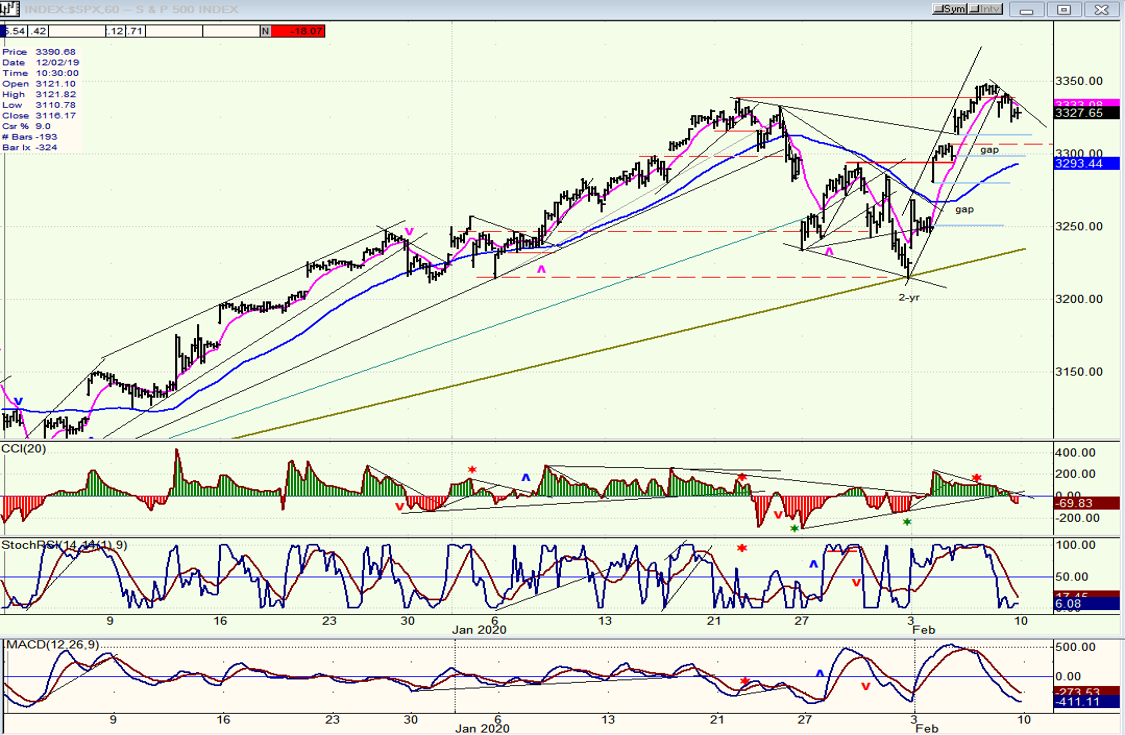
SPX hourly chart
I had expected a lower correction to about 3150, but it was curtailed by the bottoming of the 2-yr cycle, which was expected in the first couple of weeks of February, but made its low on the first trading day of the new month.
The last small phase of the rally which took the index to a new all-time high by ten points, showed deceleration. And, after being unable to go higher for 8 consecutive hours, it finally rolled over and gave a sell signal which remained in effect at the close. If Monday continues the correction, we’ll see what happens after it reaches 3310. That would partially close a gap and find support at the dashed red line. It would also fill a near-term projection.
3310 should therefore end a near-term correction and start a move to a new high. If we do not hold that level, red flags should be deployed!
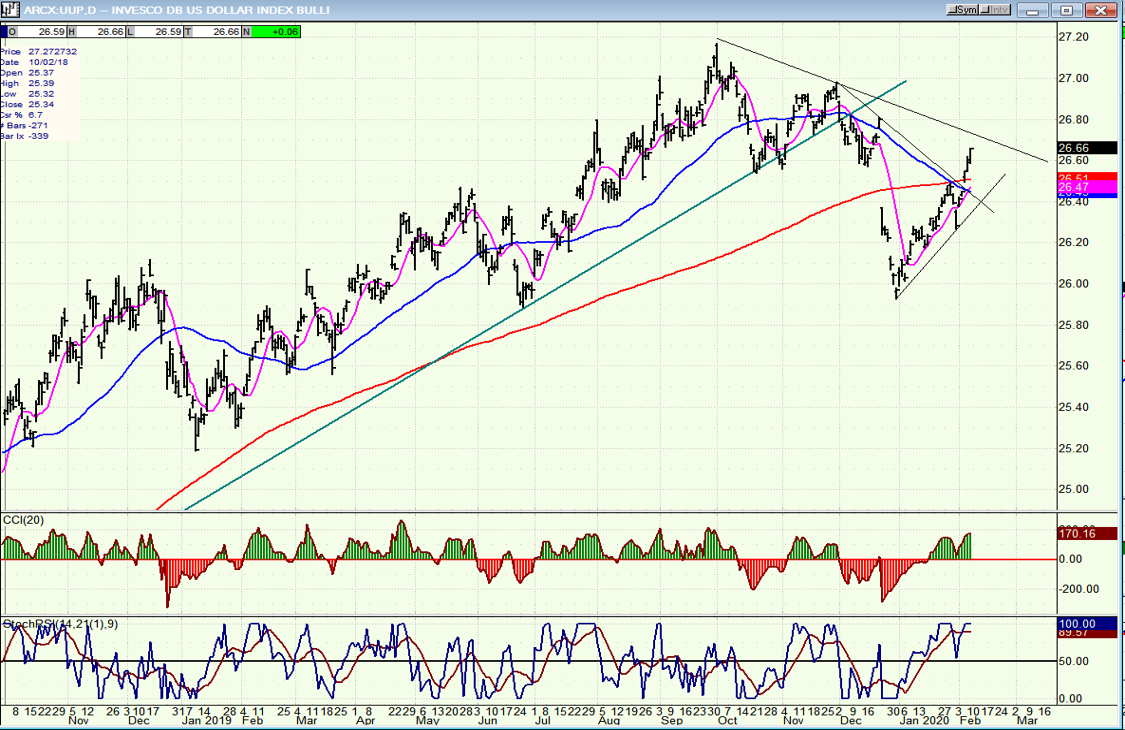
UUP (dollar ETF) daily
UUP has continued to rally from its early January lows, but but may be close to toping, short-term. The indicators show an overbought condition with minor negative divergence. It also looks as if the $USD has reached a short-term projection on its P&F chart.
GDX (Gold miners ETF) daily
Since its 31.00 top in September, GDX has been consolidating and this has formed an important secondary base which may be close to ending over the next few days with a final dip to about 27.50. A reversal from that level could lead immediately to a rally to 35.00 and higher.

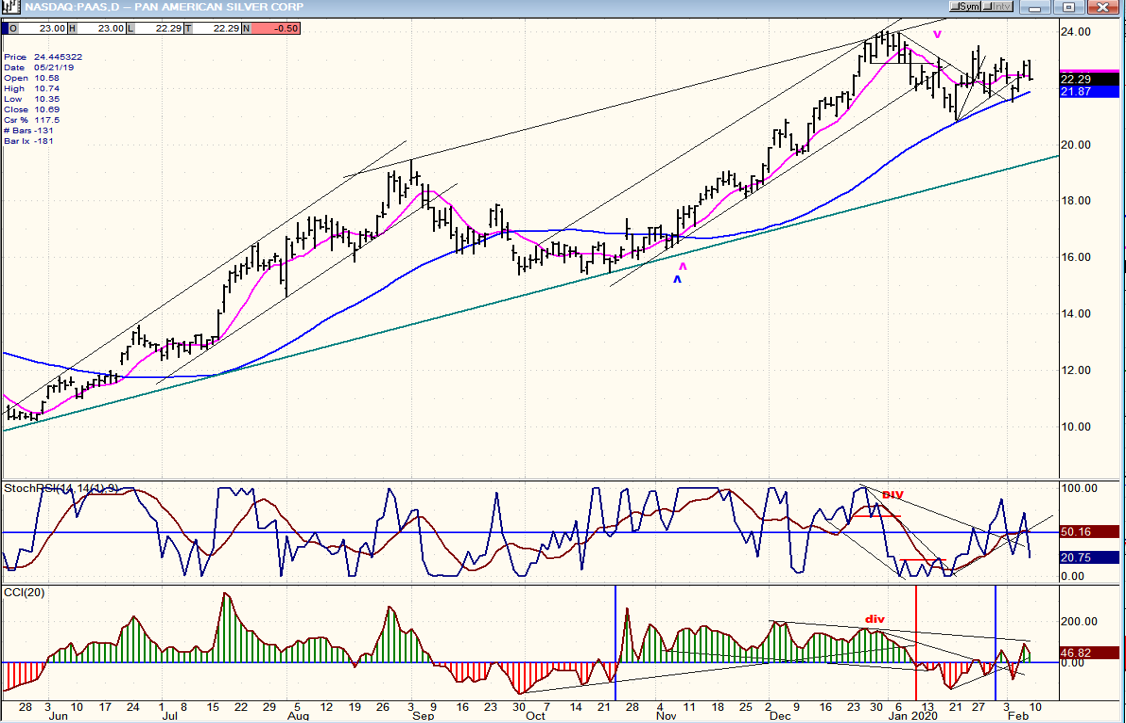
PASS (Pan American Silver Corp.) daily
PAAS has a stronger pattern than GDX but moves pretty much in tandem with it. This means that the timing for a reversal will be about the same as GDX, and that PAAS could also make a low in the next few days. A reversal in this time frame could lead to its next objective of ~30.
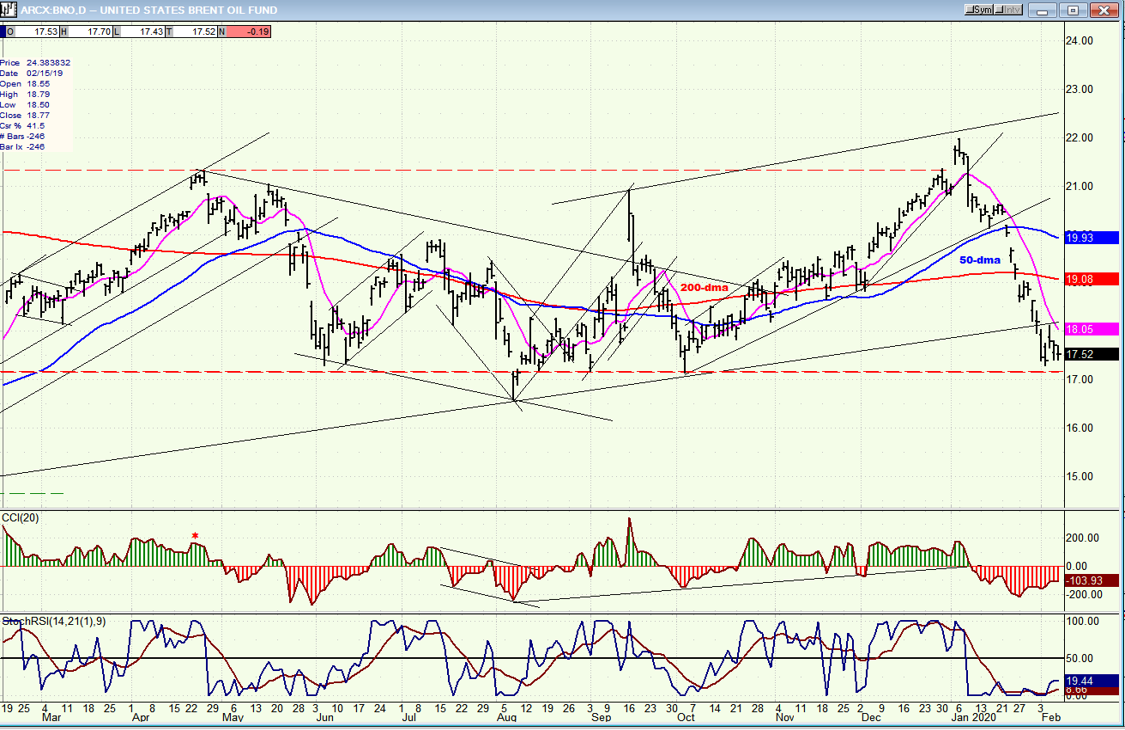
BNO (U.S. Brent oil fund) daily
This time, BNO did not rally with the market. Is it also giving us a warning that the market is going nowhere fast before completing the correction started from 3338?
Summary
The correction continues as anticipated and its end may come as early as this week if the two-year cycle makes its low in conjunction with the 80-day cycle.
In spite of the bottoming of the 2-yr cycle, it is possible that this will not prevent an extension to the correction for the reasons given above. It behooves us to let the market clarify its intention over the next week or so.
FREE TRIAL SUBSCRIPTON
With a trial subscription, you will have access to the same information that is given to paid subscribers, but for a limited time period. I think you will find that knowing how far a move can carry is one of the most useful benefits of this service, whether you are a trader or an investor -- especially when this price target is confirmed by reliable indicators which give advance warning of a market top or bottom. Furthermore, cycle analysis adds the all- important time element to the above price projections. For a FREE 4-week trial, further subscription options, payment plans, and for general information, I encourage you to visit my website at www.marketurningpoints.com.
The above comments about the financial markets are based purely on what I consider to be sound technical analysis principles. They represent my own opinion and are not meant to be construed as trading or investment advice, but are offered as an analytical point of view which might be of interest to those who follow stock market cycles and technical analysis.
********

When Andre Gratian was a stock broker years ago, a friend introduced him to technical analysis of the market. Consequently, it is not an exaggeration to say that Andre fell in love with this approach! Ever since then, it has become an increasingly important part of his professional life. Gratian has studied the works of Wyckoff, Edwards & Magee, Edward J. Dewey (cycles) and many others. However, one of my most profitable undertaking has probably been to study Point & Figure charting, which he finds invaluable in analyzing stocks and indices. If he were restricted to one methodology, this is the one that he would choose. This well-rounded background has given him what he feels to be a special insight into the stock market, facilitating the recognition of meaningful patterns and the ‘turning points’ in all trends, whether they be short or long term. Andre feels very comfortable discussing the stock market and passing on meaningful information to others. His subscribers include individuals and money managers throughout the world. Moreover, his Newsletters are currently published on several financial sites, here and abroad.


