Gold Target Met - Key Resistance Overhead


 Last week's trading saw gold forming its low in Monday's session, here doing so with the tag of the 1765.60 figure. From there, a sharp rally was seen into late-week, with the metal running all the way up to a Friday peak of 1844.60 - before backing slightly off the same into the weekly close.
Gold's Short-Term Picture
For the near-term action, as mentioned last weekend the most recent decline came from the 10 and 20-day cycles, with the larger 20-day cycle shown again on the chart below:
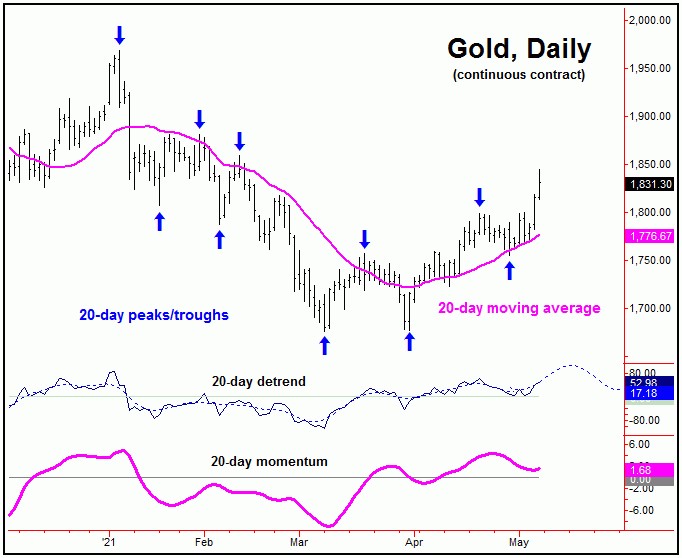
From last weekend: "the short-term picture is looking for the next low to form with this 20-day wave, a low which could even have been registered with Thursday's tag of the 1754.60 figure. Having said that, this is too early to say with any degree of certainty, though we are awaiting confirmation - with the exact upside ‘reversal point’ (i.e., confirmation figure for gold) noted in our Gold Wave Trader report."
As noted above, the last short-term bottom was expected to come from the combination of the 10 and 20-day cycles. In terms of patterns, we expected this decline to end up as a countertrend affair, due to the position of the larger 34 and 72-day cycles - which were seen as pointing higher into mid-May or later.
In terms of price with the above, the last decline phase was favored to drop Gold back to its 20-day moving average - with key support noted at or near the same. With that, we were able add to our long position in the GLD right at that 4/29/21 low - and near that same 20-day moving average.
Going further with the above, in our Gold Wave Trader report, we noted the 1790.00 figure (June, 2021 contract) as being the upside ‘reversal point’ for the 10 and 20-day cycles. Taking that number out to the upside - which was seen last Tuesday - was an 85-90% confirmation that these waves had bottomed - and that a sharp rally was in the cards, which we obviously saw playing out with the action into late-week.
With the above said and noted, we are coming due for the next short-term correction phase, expected to come from the smaller 10-day wave, and shown on the next chart:
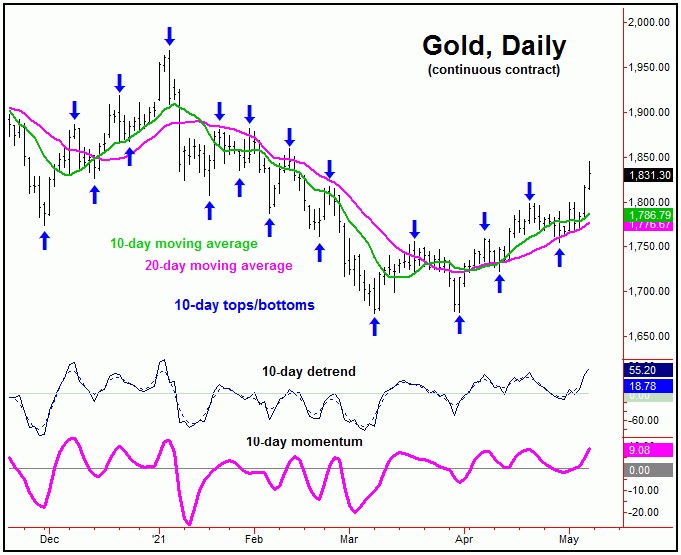
In terms of price, gold is likely to see a quick drop back to the 10-day moving average in the days ahead, as the next short-term bottom forms. Right now, it is too early to confirm a new downside ‘reversal point’ for this wave, though one should ideally materialize in the near-term, with the exact numbers always noted in our market report.
Gold's Stepped-Back View
From the comments made in past articles, the last good rally phase was expected to come from the 72-day cycle in gold, which is shown again on our next chart:
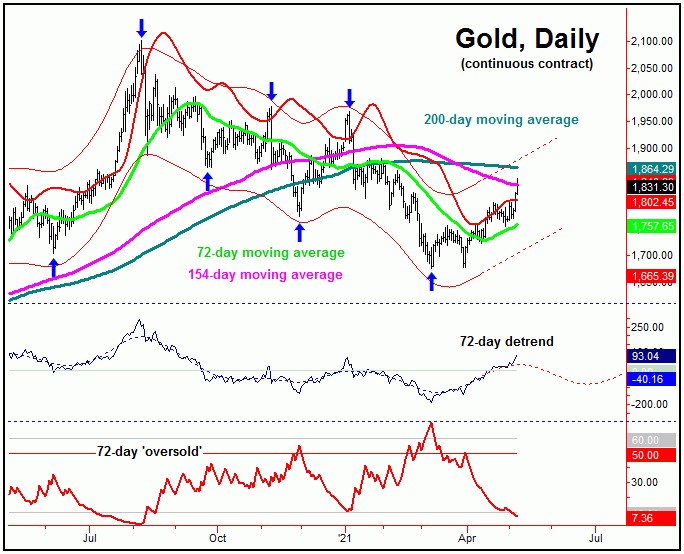
The last bottom for our 72-day cycle was made back in early-March of this year, doing so with the tag of the 1675.70 figure for gold. The next key swing top is expected to come from this same 72-day wave, and which is due to materialize at anytime.
From last weekend: "due to the position of a larger 154-day cycle that we track, my ideal path is looking for additional strength in the coming days/weeks, with the higher 154-day moving average acting as the potential magnet. That same moving average will also act as a key resistance level to the upward phase of this 72-day wave."
As mentioned above, the 154-day moving average was our ideal upside price target for the recent move up, once again due to a larger 154-day wave that we track (not shown). With the action seen into late last week, this moving average target has now been met, with the same being the lower-end of key resistance for the metal. The upper-end of resistance will be the declining 200-day moving average, which is currently at the 1864 figure (June, 2021 contract) and declining.
With the above, we are on the lookout for the next key swing top to form, expected to come from the aforementioned 72-day time cycle - and which is due at anytime. Once this peak is in place, a sharp decline is expected to play out in the weeks to follow. We are close to confirming a downside ‘reversal point’ for this 72-day wave, which will be noted in real-time our Gold Wave Trader market report, once it forms.
Gold, Mid-Term View
For the mid-term picture, we are favoring the next correction phase of the 72-day cycle to end up as countertrend - against the March low. This is due to the configuration of the larger 310-day wave, which is shown in the chart below:
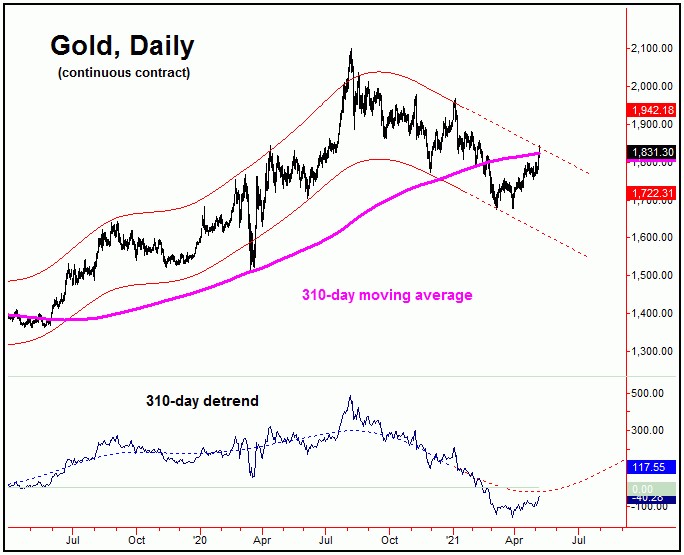
On our 310-day cycle chart, of particular note is that gold is now trading at or near both the 310-day moving average - as well as the upper 310-day channel. These - in addition to the aforementioned 200-day moving average - are key resistance levels for the metal, and which are a spot to be on the lookout for a turn with our smaller 72-day wave. What follows should be a decent decline phase with the latter, which is again favored to end up as countertrend - to be followed by the strongest rally of the year in the weeks/months that follow. More on all as we continue to move forward.
Jim Curry
The Gold Wave Trader
http://goldwavetrader.com/
http://cyclewave.homestead.com/
*********
More from Gold-Eagle


