A Glimmer On The Horizon?


It is often said that a journey of a thousand miles starts with the first step. What is not said is what goes on before that first step; does one stand frozen until the decision to start walking is made? Of course not; one ambles around busy-busy, but essentially without clear direction. Until something changes to trigger the desire or need to begin the journey. In technical terms the same can be said to apply to markets.
In life it requires a hard decision to take the first step on what will be a long tough journey that will be the primary focus for a long period of time. Many people make a start with determination to succeed, but then find they are not yet fully prepared to take on the rigours of the intended trip. Some then just give up and continue with normal life; others take note of what is required for success and proceed to be better prepared when they try again. This is again similar to how markets behave.
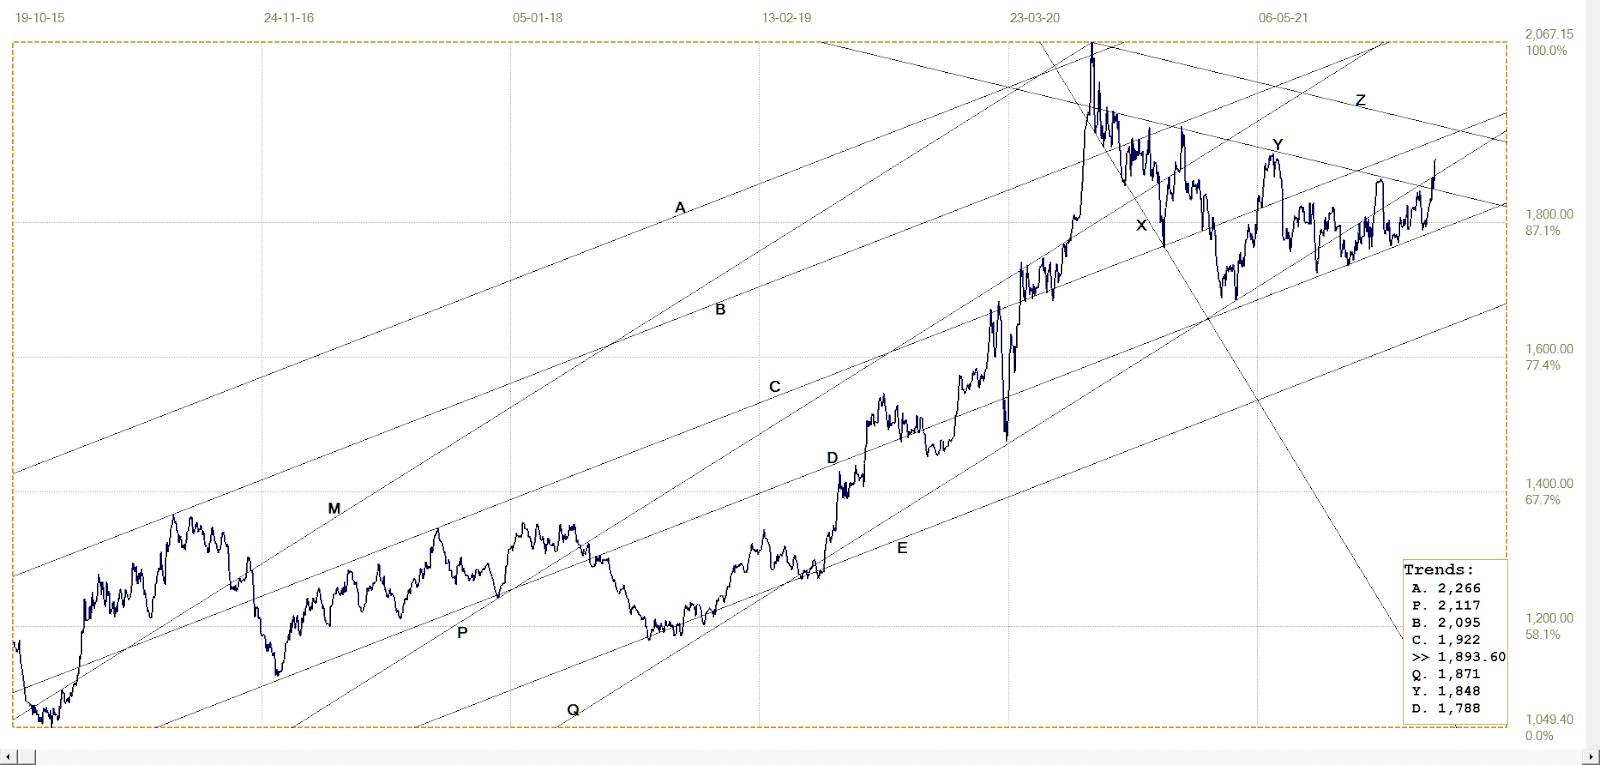
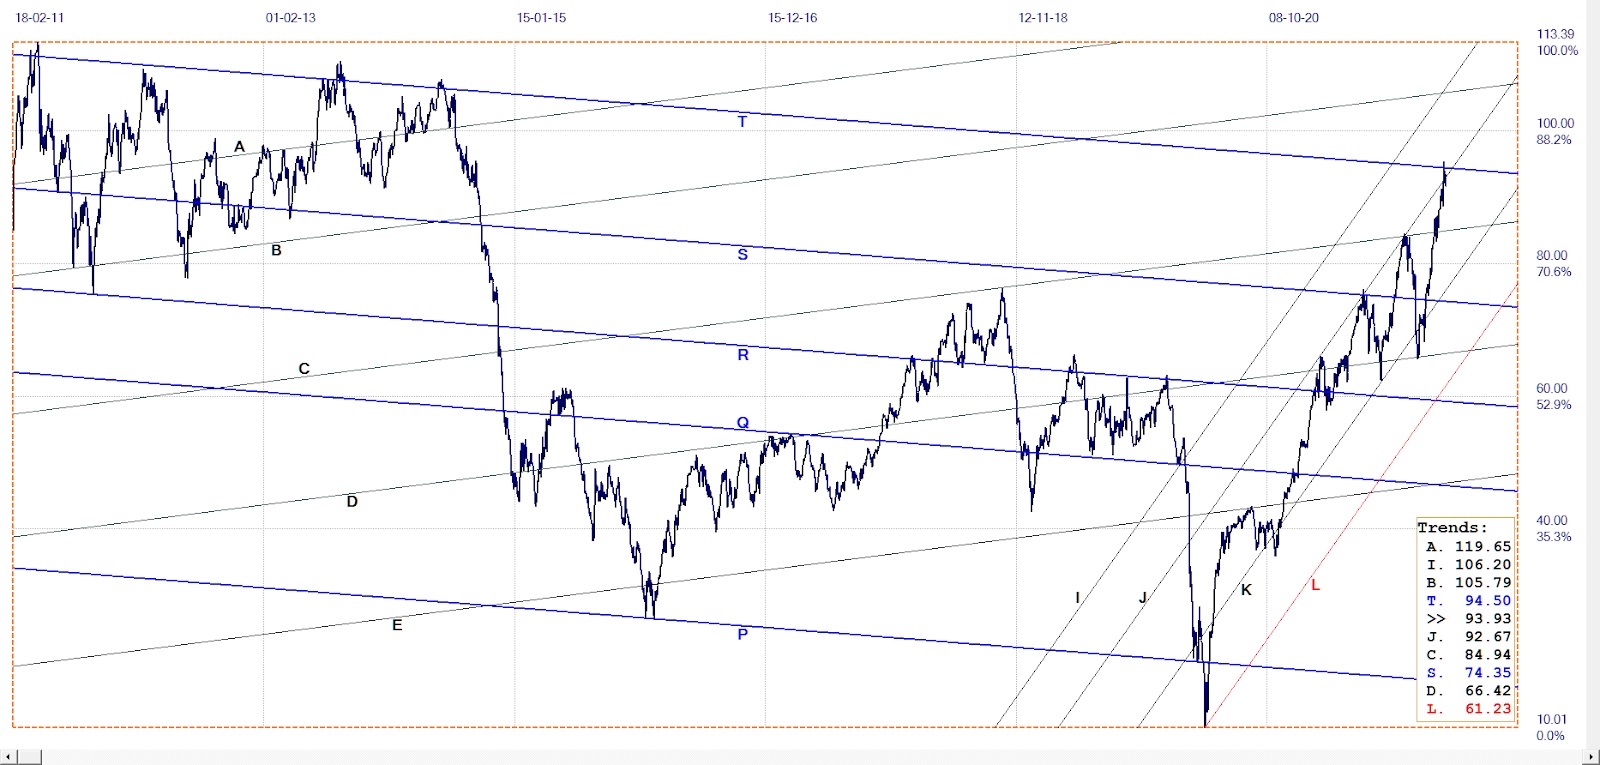
Take the price of gold as an example of what could be the first behaviour described above; where one ambles around without clear direction until finally the first step is taken with the destination in mind. The monthly chart of the price of gold illustrates this?
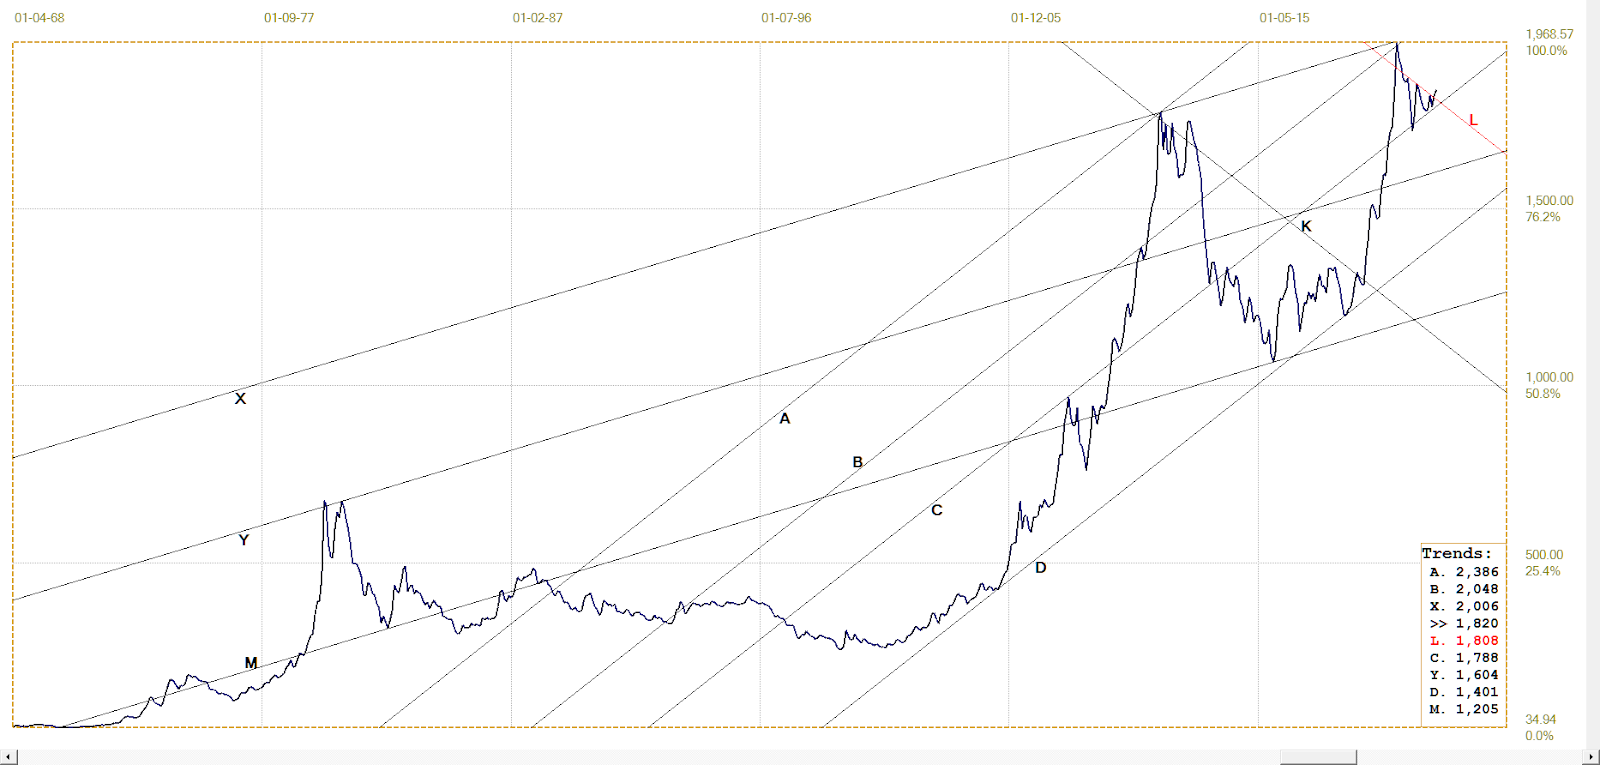
Gold price. London PM fix (Mave). Last = $1835.40 (Feb: month to date)
Following the 2011 high and subsequent squelching of the price of gold, the price was trapped in channel CD and remained in a sideways directionless drift also contained in channel MY. Then it reached the point where it either had to break higher through the resistance of line K to remain in the bull channel or to break sideways and continue with more clear direction. The break higher was the start of a steep rally that took the price to a new all time high.
Again the powers that be forced a retreat followed by a time of consolidation between lines C and L. As the space between the new trend lines became narrower, the waves in the price also became smaller to hold to the support and resistance. Now, at last, we have a step in the right direction – a minor step in January when the average PM fix was $1820.30 with the resistance of line L at $1812.50, and now the average for February to date with about $15 improvement over January; promising, but still with the month end problems to surmount.
So far the channel BCD of potentially broader channel ABCD has held pretty well since way back in 1993. Two attempts to break above line B have failed; at least on the first occasion the break into channel XY did hold to launch the rally to the 2011 high. Then the recent new high had just failed to make it to line X, which now remains the target for the next phase of the journey. It all depends really on whether the gold price is going to have the resilience and stamina to continue the journey by holding in channel BC following the break above line L.
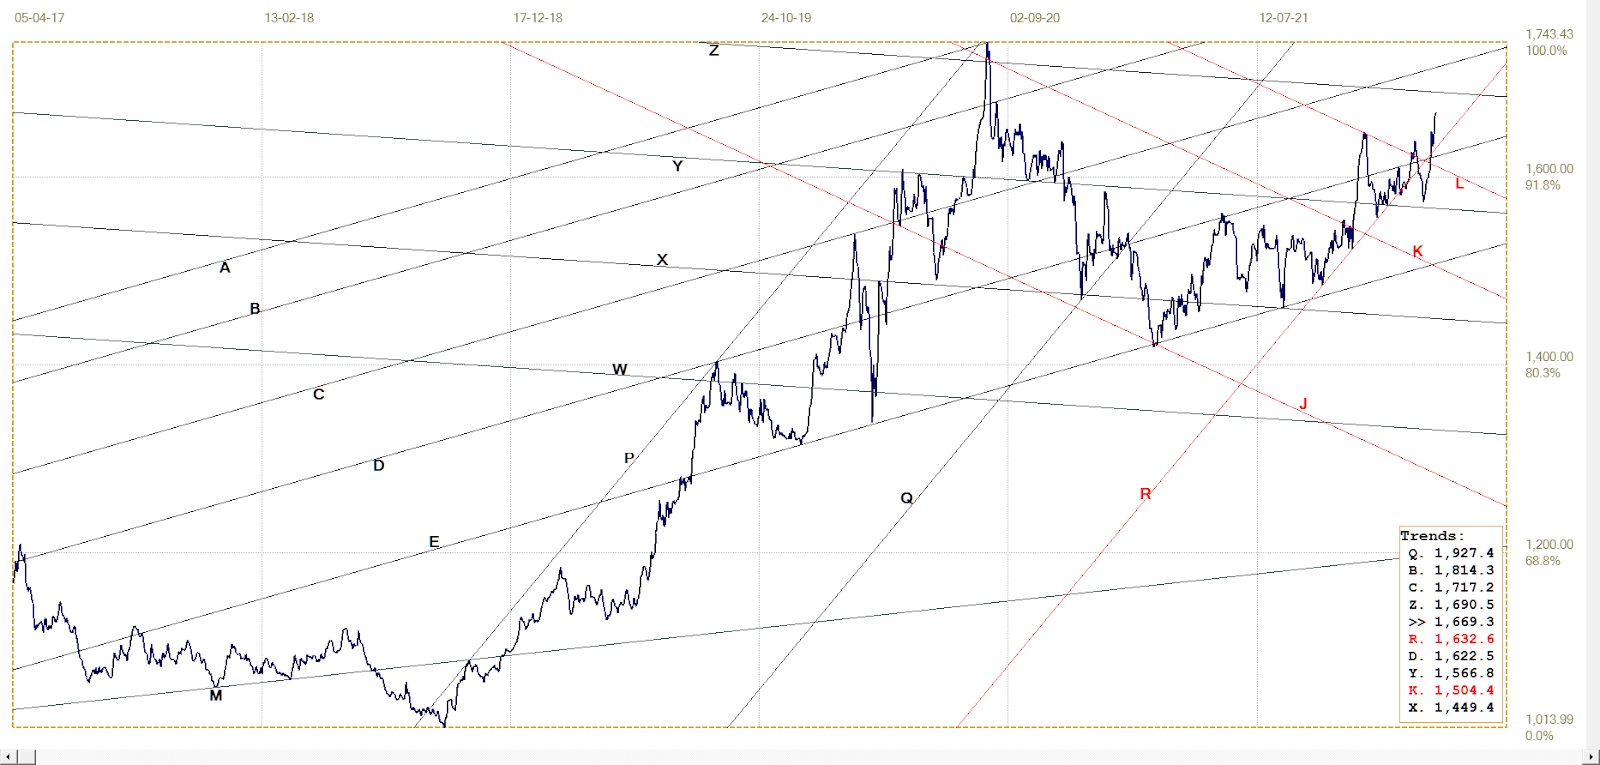
The price of silver had a different experience as its monthly chart illustrates.
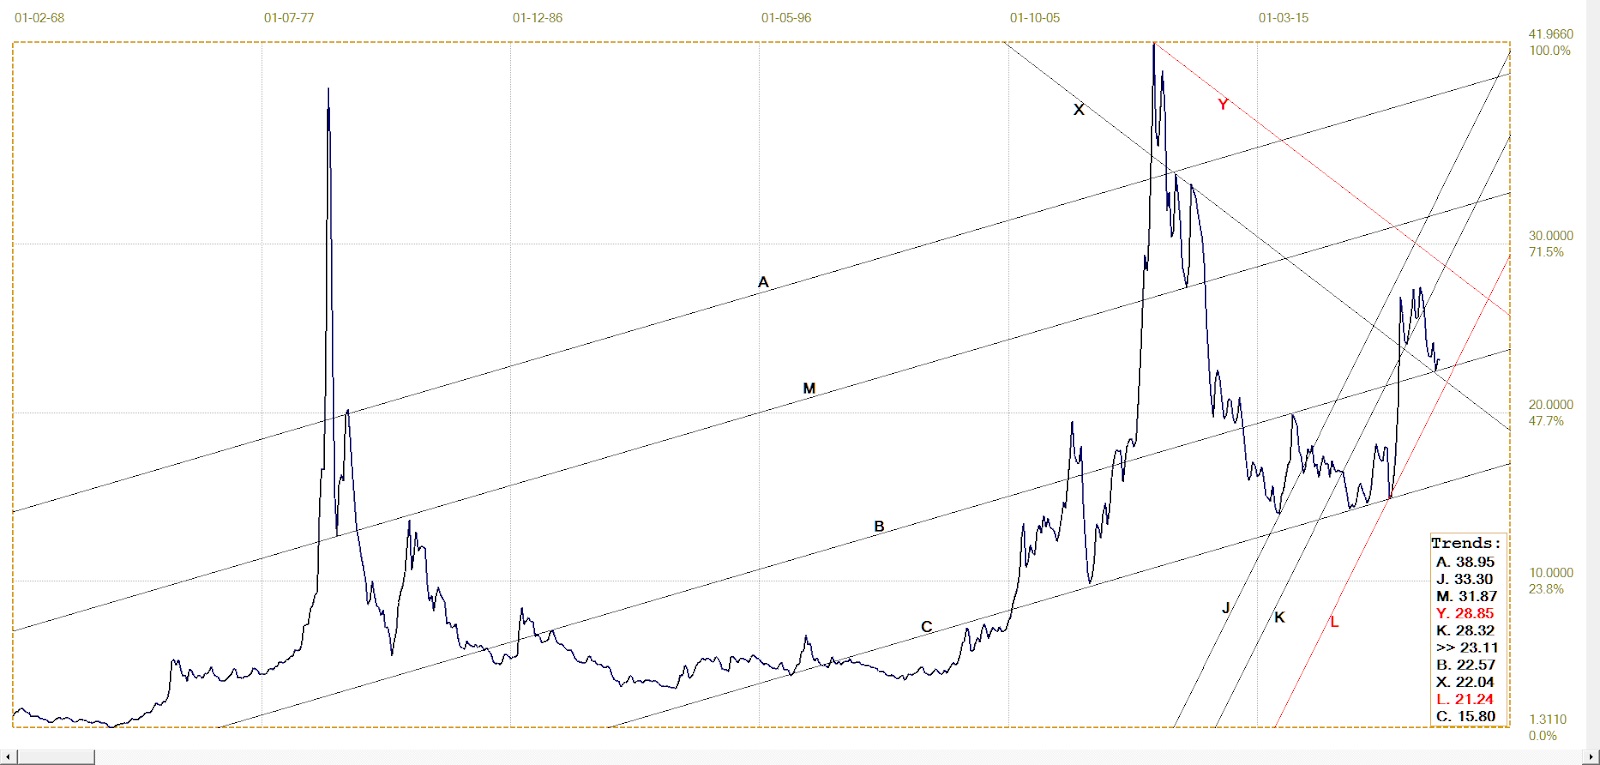
Silver price. London fix (Mave). Last = $23.11 (Feb: month to date)
Like the price of gold, silver since 1971 also followed a shallower bull channel that more recently transformed into a steeper bull channel. Trying to catch up to gold, the new channel is proportionately narrower and much steeper than the gold channel. The price of silver had also achieved a new high in 2011, accelerating more than gold could manage, but then plummeted lower far more than gold did when the plug was pulled on the market and the price ended up at the bottom of the old bull market.
The sideways consolidation in channel BC then lasted from 2014 to March 2020 when the price fell steeply to the support at line C only to reverse steeply higher again. The steep decline was when the shorts who had written a massive number of options had to act quickly or pay out $billions if these options matured in the money at the ruling price. It is rumoured that by taking the price down to $12.50 on 19 March 2020 the options expired worthless. Whether true or not, that date is also the date when the sudden Covid panic ended on many markets, Wall Street included, which bottomed on Monday the 23rd.
Whatever confounded the silver market up to that time must have ended, since the price rocketed higher to almost reach the top of the new steep bull channel at line J, first topping out in August 2020 at an average of $26.9. The daily peak was higher, as it was during August when the Banks clamped down on the rally of the precious metals to bring prices back under control. Silver managed to hold on in channel JK until July 2021 and even achieved new highs on the monthly average.
The break below channel JK heralded a steep retreat that fell back to find new support from the old shallower channel MB and nearby support from bear channel XY. Now the price has revised slightly off the support and time will tell whether silver will continue its sideways drift within channel KL, with a slight bullish bias for the time being. Or will silver again catch fire if the price of gold extends higher after the new break. It is as if silver behaves like someone who is caught up in the mundane affairs of daily life and with no long term ambitions or even just objectives.
Then, when something happens to disrupt their lives, they react with vim and vigour to resolve the issue and achieve a great deal of improvement in their situation, only to lapse into another round of barely doing enough to keep going. For these people a destination a thousand miles away is not a journey of a thousand miles, but a series of many almost day trips of 10 to 50 miles at a time, with a sudden final spurt of 200 miles.
Whereas gold seems set for a more consistent move after the break higher, the future for silver appears less certain for the near term. The potential for a steep rally to try again and catch up to gold is there, it also could require quite a long period of mostly inaction before the rally begins.
It would appear that the strength of the dollar correlates quite well with the state of Wall Street – when equities come under attack the dollar undergoes a reflex power boost and strengthens. There is of course insufficient information on whether there is any distinct economic cause-effect relationship between the two events, whether it is purely coincidental or whether a stronger dollar is custom designed and stimulated by intervention to assist in the propping up of Wall Street. Or is it done more to stop the increase in inflation expectations? All of which, like most currency manipulations fail sooner or later; just ask Soros and the UK monetary authorities about the pound.
Just in: Australian police confirm use of a sonic weapon to control the “well behaved” protesters against the Covid mandates in Canberra –from other reports with quite serious effects on the people. Is this the start of Chinese and other despotic practices to make sure that people in western democracies “behave better” by not questioning what the government does or requires of them to do? Just doing it. We have long had use of the water cannon and now a sonic weapon is no longer taboo in a (so-called?) democracy. What comes next: scalding lasers and if that is too slow, then bullets?
Euro–dollar. Daily close
The break back into channel JKL and above line Q failed to extend above the recent high to form a double top and retreat back below channel KL. The break back below descending resistance of line G also adds a negative note to the odds for a euro rally soon. At the moment, as noted above, the fortunes of the euro could be linked to the state of Wall Street – further weakness in equities therefore should see the euro at best sideways to slightly lower.
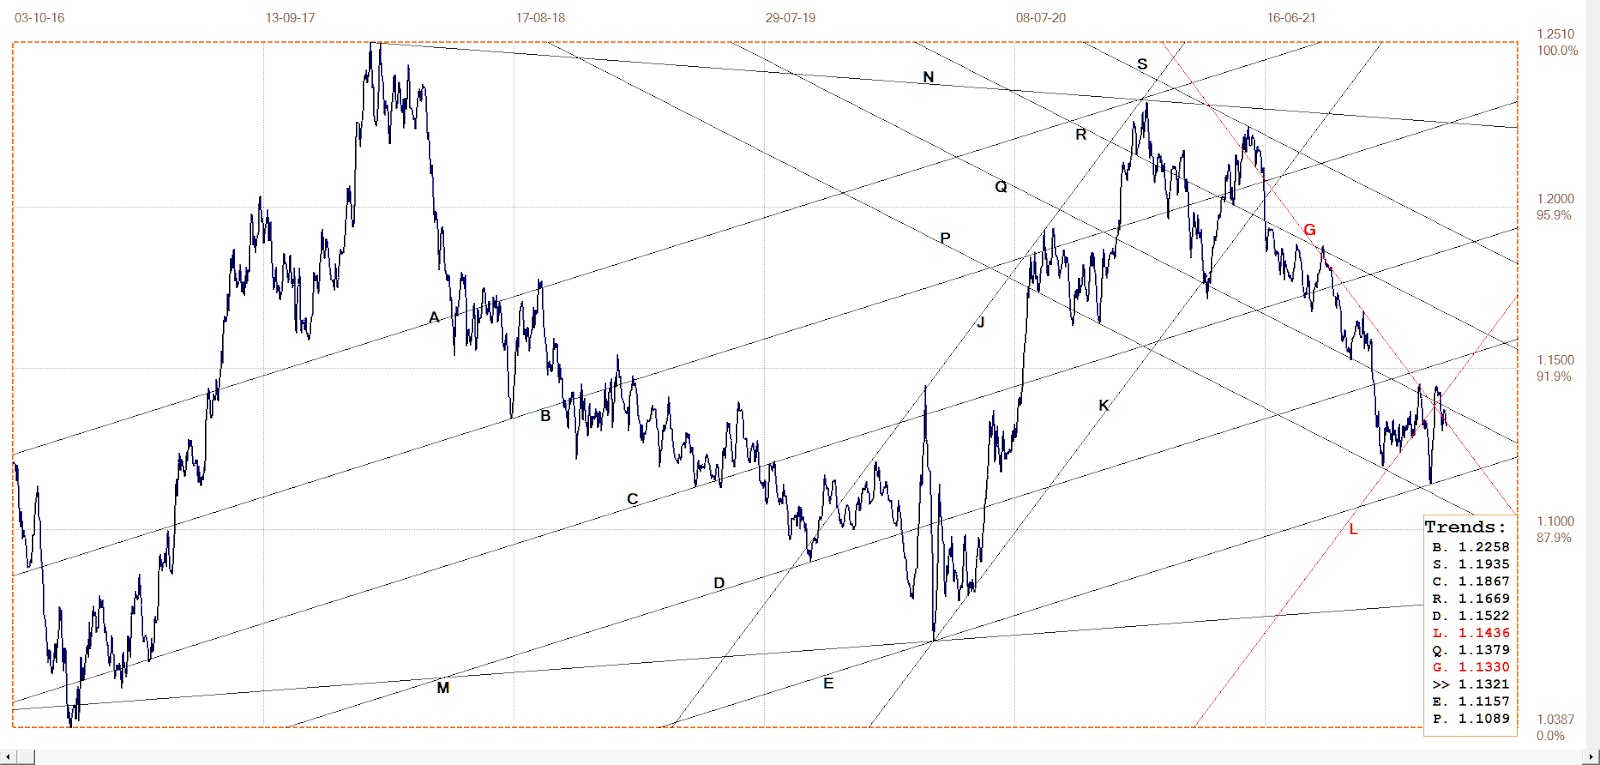
Euro–dollar, last = $1.1321 (www.investing.com)
DJIA daily close
Last week the DJIA lost close to 1000 points to break below the 35 000 level and is now testing the 34 000 psychological support – which is acting as real support, because the round numbers are quite clearly being strongly defended.
When the level of 34 000 is penetrated, one cab can predict that 33 500 and later also 33 000 are to materialise as firm support. Given the accelerating upward curve in the daily turnover in the 30 DJIA stocks, selling has increased the past few weeks and it is requiring more and more funds to effectively “buy and hold” as there is no sign of any high volume selling in less active times on the market to allow accumulated purchases to be redistributed back to fresh buyers in the market, of which there are not many.
It does not take a market expert to know that the persistent buying, without waiting for the price to stabilise or at least to reach a possible low point, then accumulating shares carefully so as not to push up the price too fast is not natural market action – at least not with profit as a motive. So, two guesses who the persistent buyer is!
Note, however, despite all the support the DJIA has broken below key support. There can be no guarantee – given the degree of covert financial support for equities – that the index won’t recover back above lines P and A; but there now has been at least a technical warning that the stock market can be vulnerable.
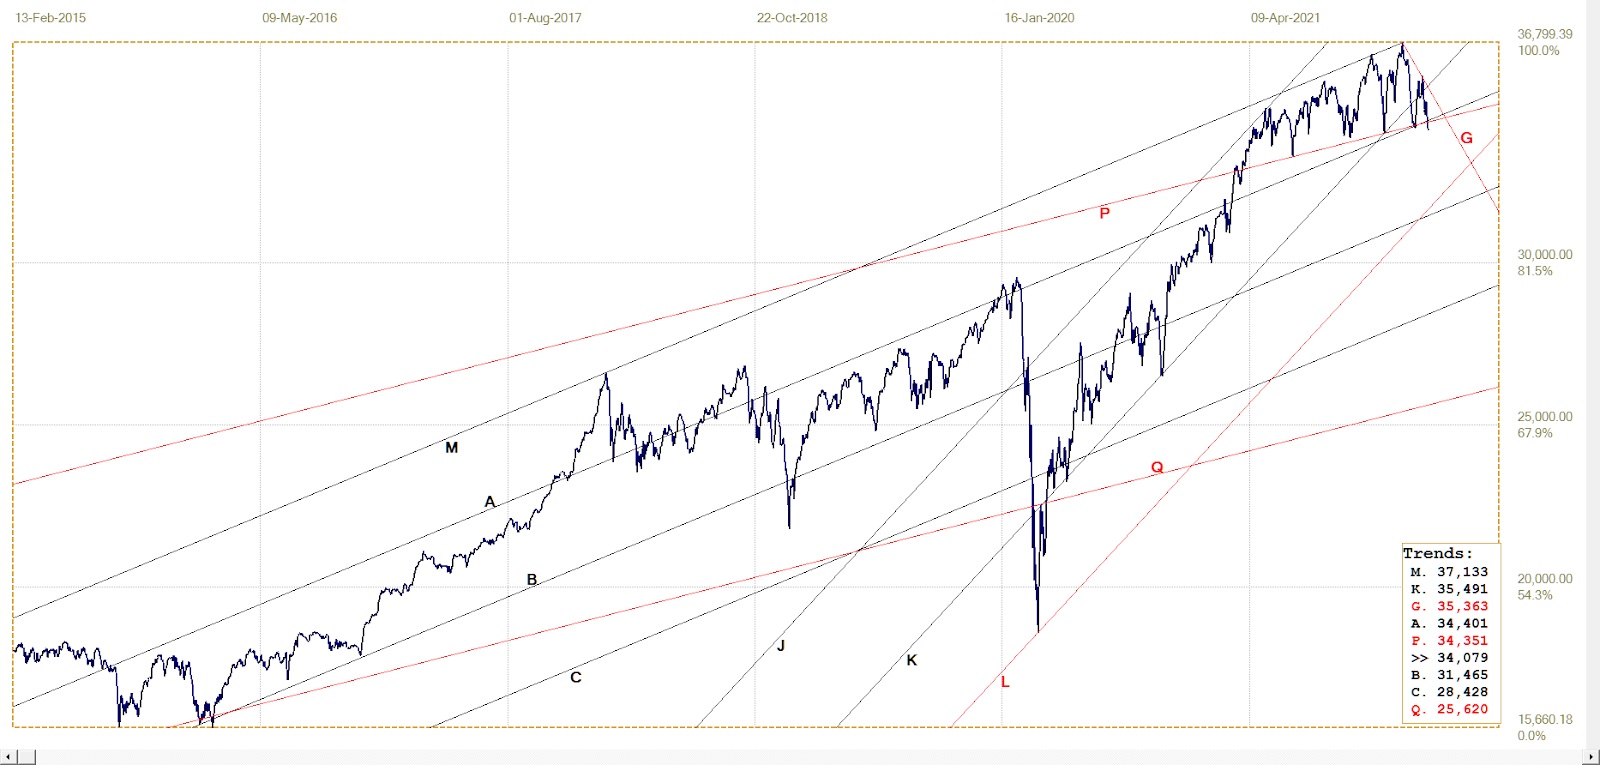
DJIA last = 34079.21 (money.cnn.com)
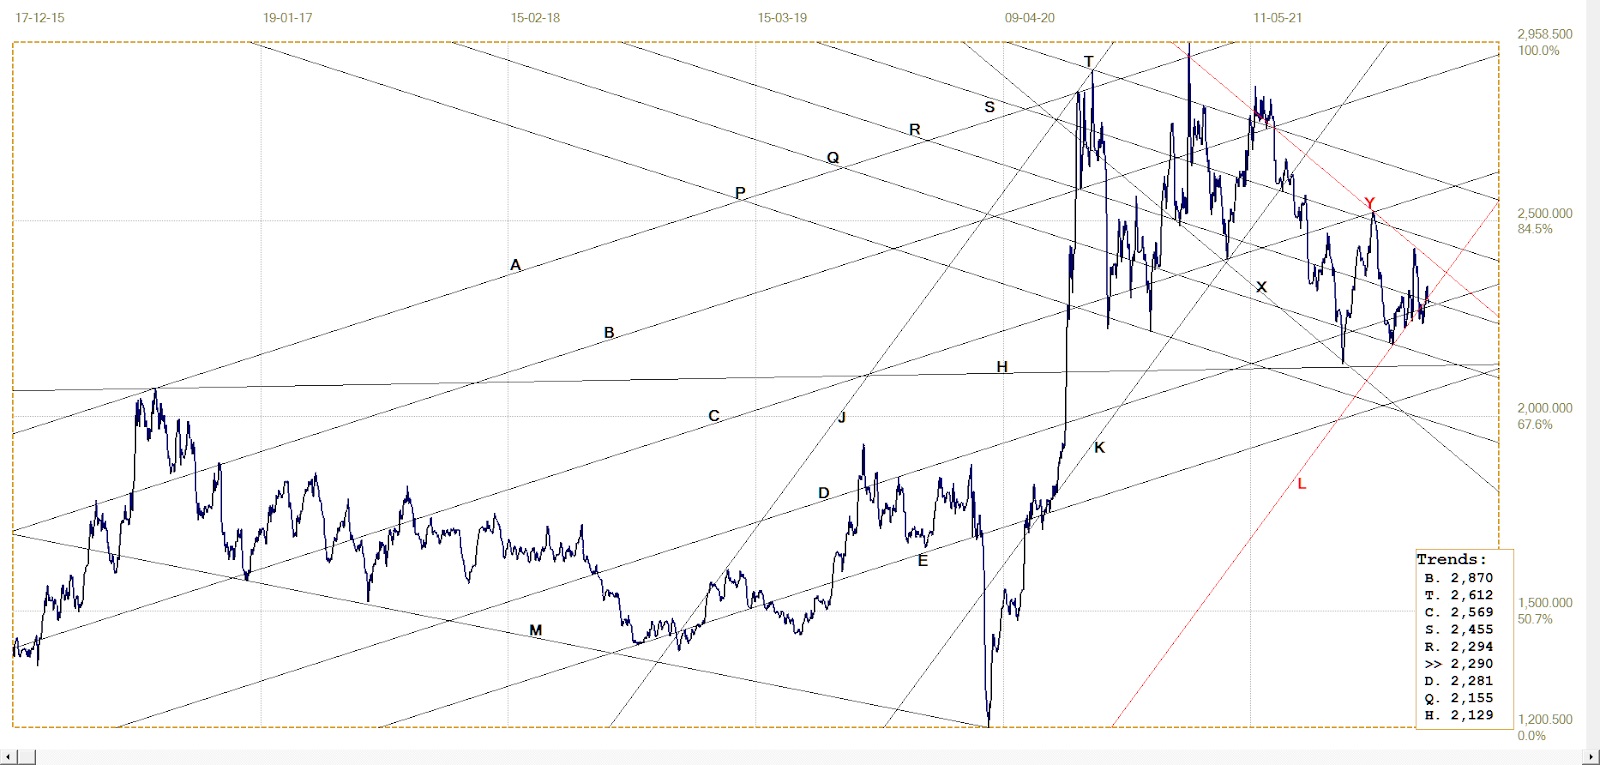
Gold London PM fix – Dollars
Gold price – London PM fix, last = $1893.60 (www.kitco.com)
After a gain of about $90 on the week – “What went wrong? is almost the logical question to ask – the price of gold now extended its marginal break above YD by a small amount. The price was challenging the $1900 ceiling at the close of US trading on Friday even while the PM fix was still quite some distance below that key level.
A couple of things are now of interest for this week and next. Will there be a follow through on Monday when US markets are closed? Will there be follow through right throughout next week? What will the last week of February and the month end bring? The future for gold will look a lot brighter should the break to above the sideways and extended triangle manages to hold – and perhaps even extends higher.
Euro–gold PM fix
Assisted by the weaker euro, the euro price of gold fared better than the dollar price by making quite a decent spike of €80 higher last week. It has broken decisively clear of the recent near double top and according to this analysis there is no nearby technical resistance. While there is room for sideways moves within bull channel QR, the price has good momentum.
The last week and a half of February poses the usual threat to the dollar price, but more weakness on Wall Street could favour euro gold by dragging the dollar stronger!
Euro gold price – PM fix in Euro. Last = €1669.29 (www.kitco.com)
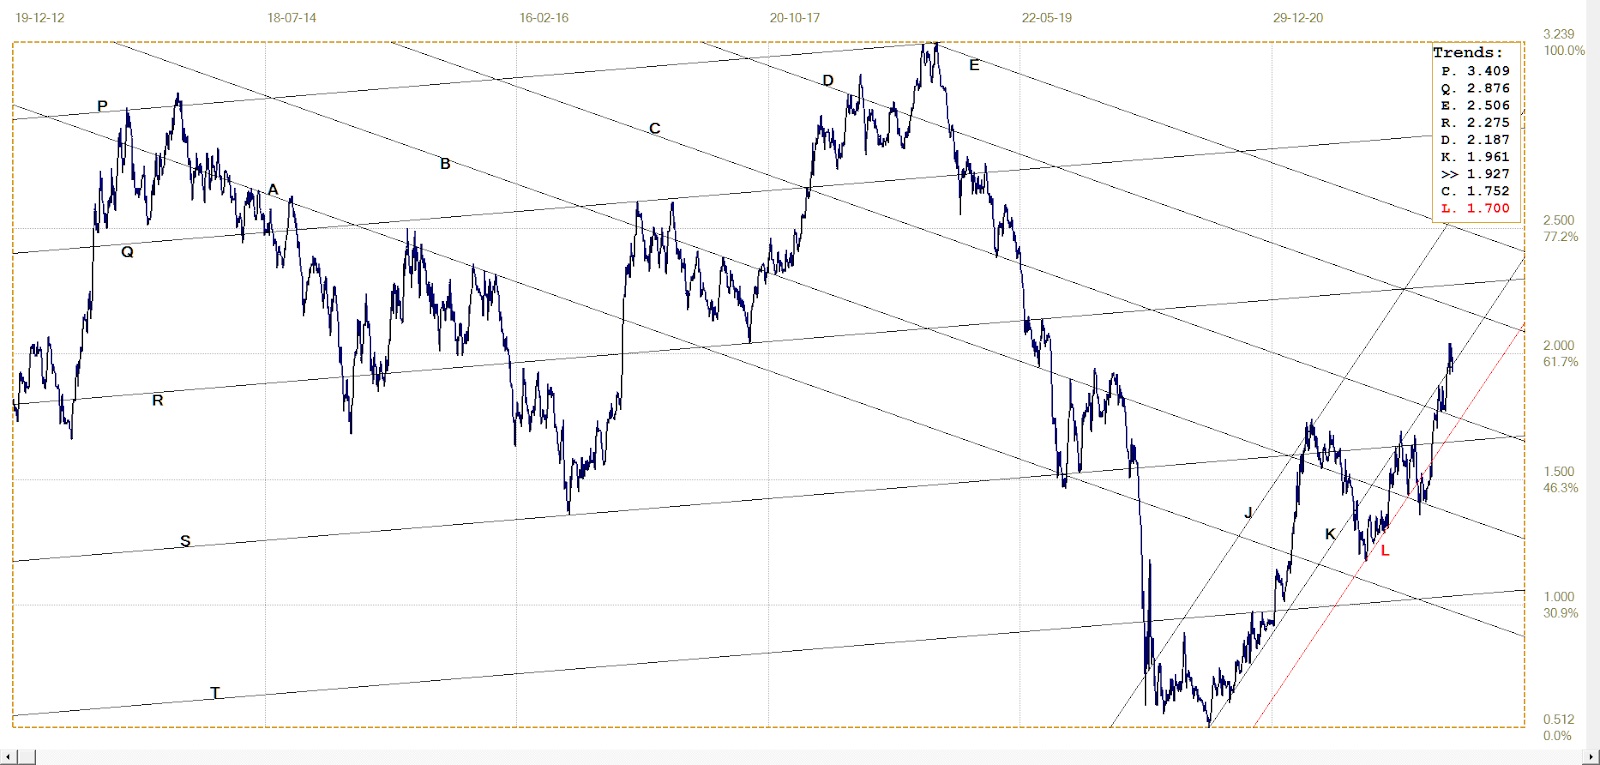
Silver Daily London Fix
Silver daily London fix, last = $23.77 (www.kitco.com)
85? The price of silver has again lost the battle to hold in bull channel KL, however, this time – so far! – by a smaller margin than when it recently briefly broke below line D. The break lower has to remain minimal and correct back into the bull channel before too much time has passed. Silver is naturally kept weak by the price suppression and it does not need to have a negative technical slant to its prospects as well.
As for a number of the counters discussed this week, silver too is facing a few quite critical days. As described earlier, the price of silver has reached quite good long term support and is now reversing off this. But as for gold, the next 10 days hold many pitfalls for silver as well. Perhaps, if the early momentum this month can hold, we could even see the key $2000 level being tested early in March?
U.S. 10–year Treasury Note
10–year Treasury note, last = 1.927% (Investing.com )
The yield on the US 10-year Treasury note has now twice broken in the upper band of the steep channel KL and both times it then failed to hold the break into the weekend. Once is happenstance; twice is coincidence and thrice is enemy action, as Gold Finger had said. If the same happens again, one can imagine that in high circles there is a belief that major decision makers in the financial world reserve their weekends to sit and pondering what the markets are doing and how to react!! Someone in high circles may have thought of a way to inform and convince decision makers higher inflation really will be transitory.
West Texas Intermediate crude. Daily close
WTI crude – Daily close, last = $91.80 (www.investing.com)
The base price of much of the energy used in the US failed to hold the break above the resistance of line T, but so far is still holding to the other important break above channel KL into the upper band of steep bull channel JKL. As long as channel JK holds and with a new and definite break above line T – “when” this happens rather than “if” – the odds of the inflation trend being transitory diminish sharply.
©2022 daan joubert.
********
More from Gold-Eagle


