Are We in a Bull or Bear Market?


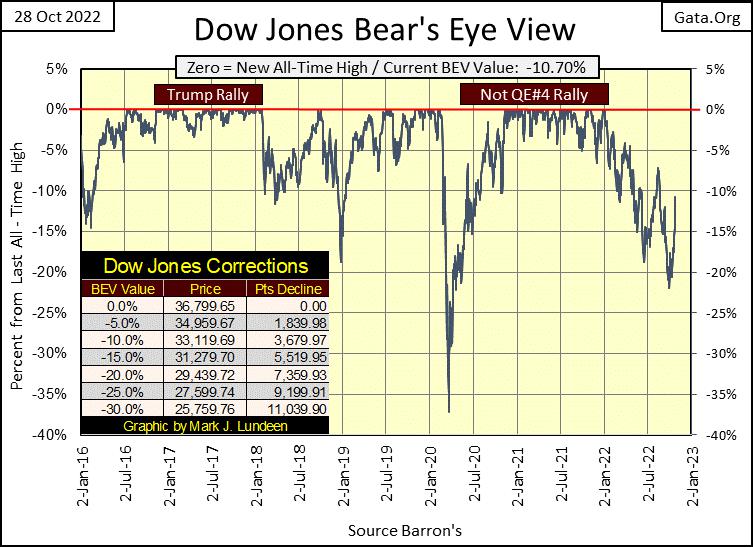
The low of our current bear market decline was last month; September 30th with a Dow Jones’ Bear Eyes View (BEV) of -21.94%. For the Dow Jones, a BEV of -21.94%, or a 21.94% decline from a bull market’s all-time high isn’t much of a bear market decline.
In my opinion, should the Dow Jones continue advancing to a new all-time high, our current decline that began on January 4th wouldn’t even be considered as bear market, but a correction in a bull market. Sorry, but in a bear market, seeing the Dow Jones deflate to a BEV of something below -30% is just something I’d like to see before I come back into market. And at this week’s close, the Dow Jones is about to break above its BEV -10% line.
So, what is it? Is the stock market in a bear market decline, or a correction in a bull market? Keep in mind the Dow Jones is only an average of thirty major blue-chip, dividend paying stocks. I, as well as others use the Dow Jones as a proxy for the stock market. And for well over a century, the Dow Jones has performed that function; that of testing the market, be it bull or bear for investors darn well.
But sometimes the Dow Jones can lead or lag the broad market, as I believe it is leading the market now, as seen in my table for BEV values for my major market indexes below.
This week’s data (top table), sees the Dow Jones at #2 in the table, and that is unusual. That thirty boring, old blue-chip stocks have become the darlings of Wall Street is a bit of a stretch. So it seems, with the Dow Jones advancing 12.31% in the past month, with 4% of that just this week.
What happened to last year’s glamor issues trading in the NASDAQ market? They are stuck at the bottom of this table, down in rows #17-19. And they aren’t up 4% this week. From Monday’s close, they were lucky advancing 1% by Friday’s close. Seeing high-tech NASDAQ being outperformed by the old smoke-stacks in the Dow Jones is a bit odd.
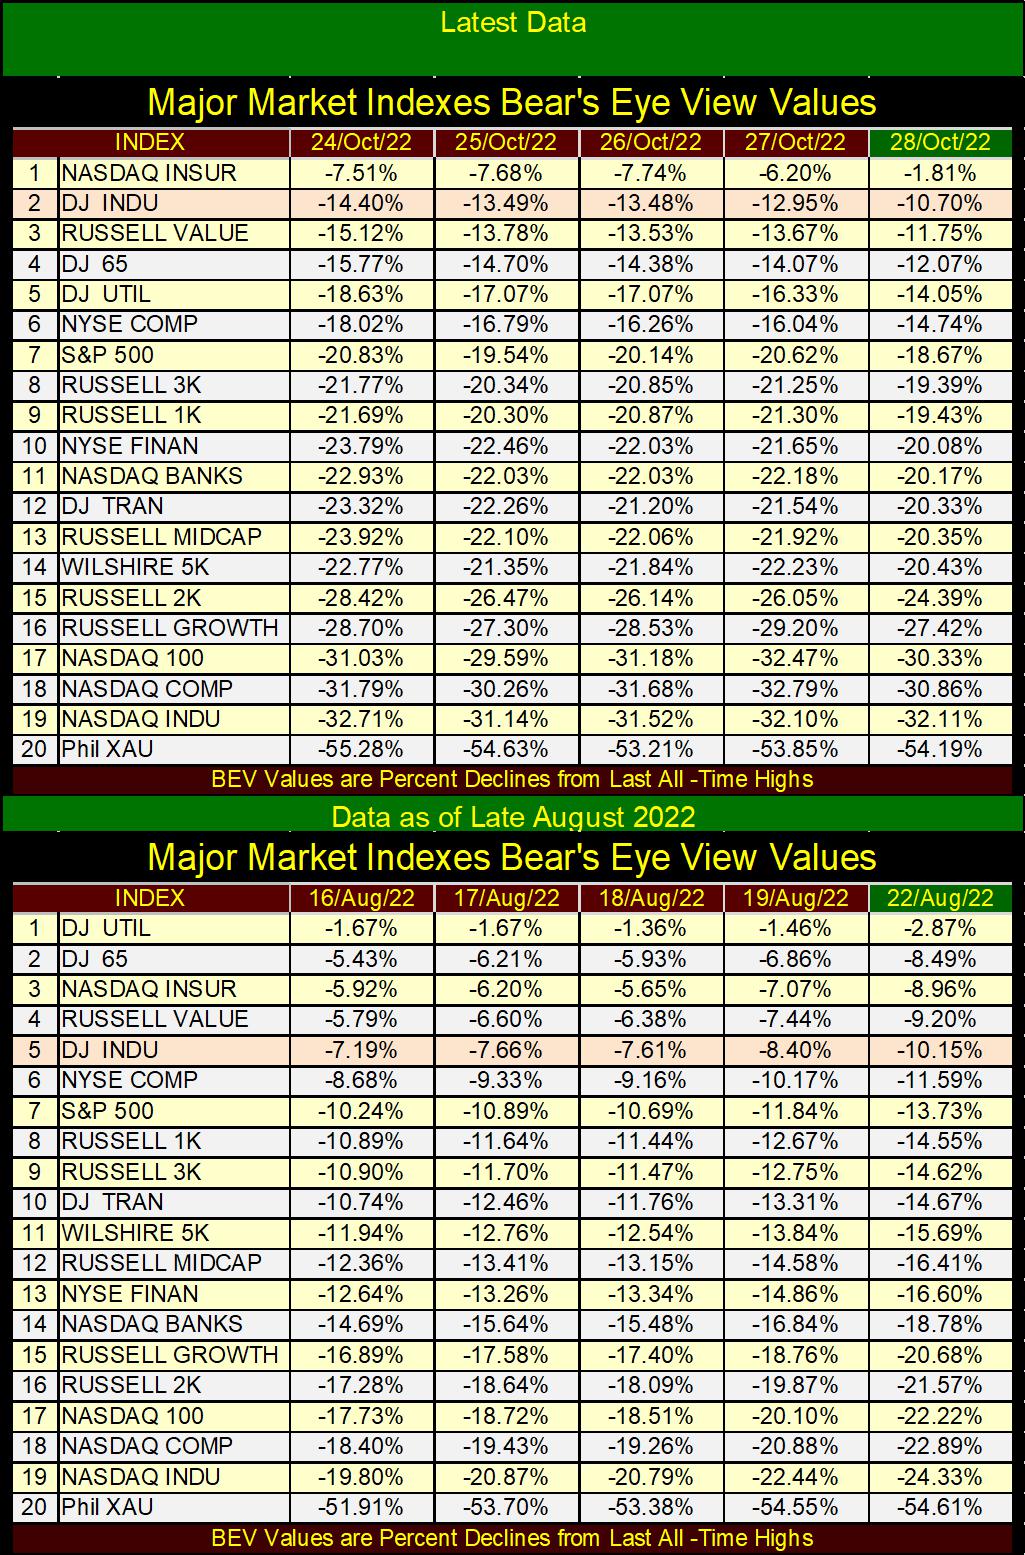
In the table above, same dataset, but from two months ago as the stock market was deflating towards its lows of September 30th. I chose these days as they’re the last time the Dow Jones saw a BEV of around -10%. I wanted to see what the BEV values were for the other indexes when the Dow Jones last had a BEV of -10%.
This is more like it, with the Dow Jones at #5. Looking at the stock market as a horse race, seeing a plow horse, like the Dow Jones even at #10 is something to be expected. But a #5 is good too.
But the point I want to make in the two tables above are; when the Dow Jones last had BEV of -10% (last August) none of the hot NASDAQ indexes had BEVs below -25%. One month later, September, the Dow Jones would bottom with a BEV of -21%. The formerly hot NASDAQ indexes would bottom with BEVs of -35% at the end of September. In the past month, note that none of them were able to break above a BEV -30%.
As someone who would like to be bullish, I don’t like this weakness in the formerly hot NASDAQ indexes. Since the early 1990s, has Wall Street seen a strong market advance where these same NASDAQ indexes didn’t lead the other indexes upward? No, it hasn’t. Maybe it’s only a matter of time before these indexes catch up to, and then surpass the Dow Jones. If so, then buying the NASDAQ’s former highflyers at their current lows would be something one could brag about in the years to come.
But I doubt this will prove to be so, for reasons seen in Mr Bear’s Report Card below. Since October 3rd, the Dow Jones has seen six days of extreme-market volatility, or Dow Jones 2% days, days where the Dow Jones moved 2%, or more from a previous day’s close. That five of these six 2% days were positive daily advances makes no difference.
In bull markets, we’d see maybe one or two of these days of extreme volatility in a year, but below we see six in less than a month. Five BIG DAILY RALLIES PLUS A BIG DOWN DAY in a month are exactly the sort of market high-jinks to expect from Mr Bear during one of his relief rallies in a bear market. It draws the suckers’ money back into the market, where sometime in the future they’ll wish it wasn’t.
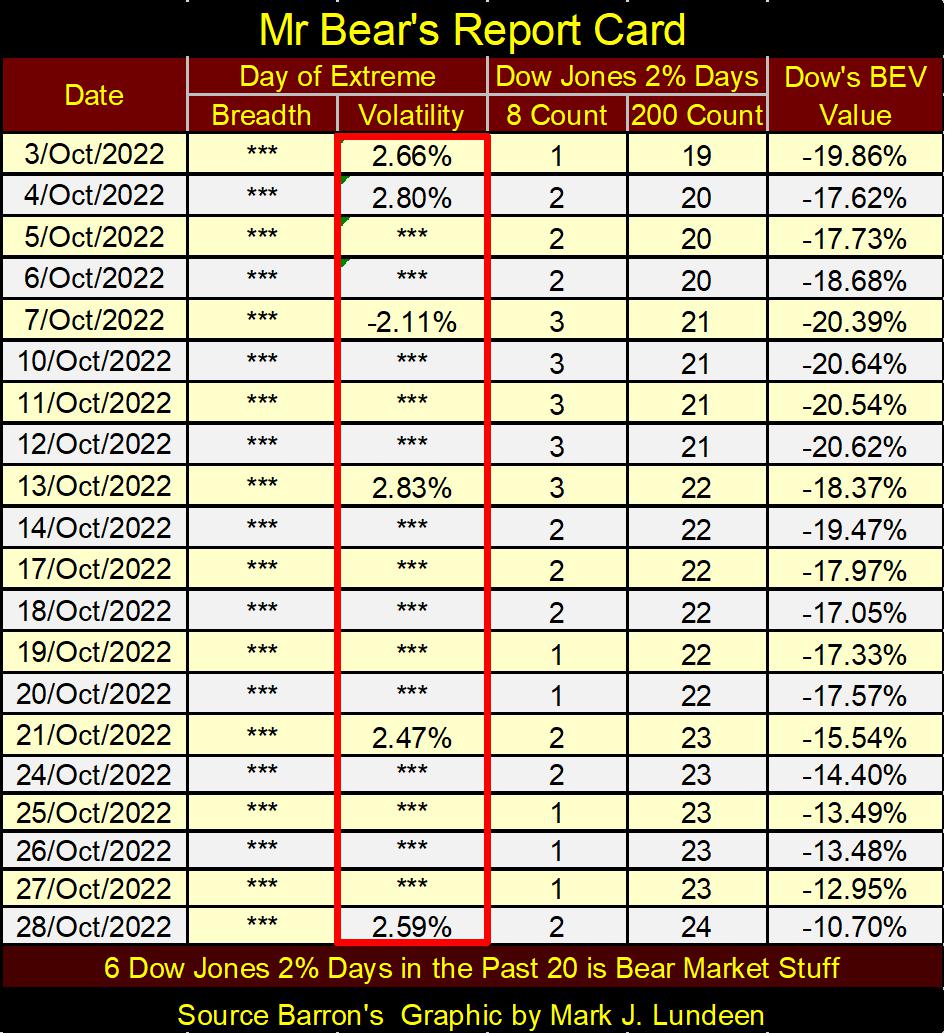
Another thing not seen in bull market above are the Dow Jones counts; the number of Dow Jones 2% days in a running 8 & 200-day sample. For the Dow Jones’ 8-count, during bull markets this column is filled with Zeros, not with numbers larger than Zero. During bull markets, the Dow Jones 200-count should be counting down, not counting up as seen above.
I’ve back dated these indicators going back to January 1900, and since horses pulled taxis up and down Wall Street, seeing Dow Jones 2% days becoming common market occurrences, even positive ones are bearish, not bullish.
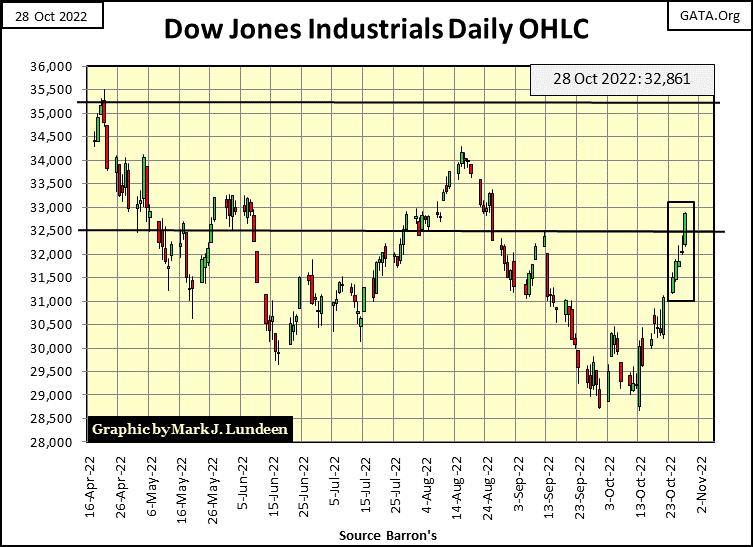
I’ll leave it at that as we move on to the Dow Jones in daily bars below. If the most bullish thing a market can do is go up, the Dow Jones has been doing exactly that for the past three weeks. If only the NASDAQ indexes would confirm this bullish action – which they aren’t.
For those of us whose only interest in this market is its entertainment value as we sit in the peanut gallery, high above the market, there is beer and hotdogs being wagered whether or not the Dow Jones will take out its highs of mid-August. Oh, what the heck, I’ll stick my neck out and wager a couple of hot dogs and a beer we’ll see the Dow Jones close above its 34,500 line by December.
Wish me luck the market doesn’t fall apart following the American mid-term election come this November 8th.
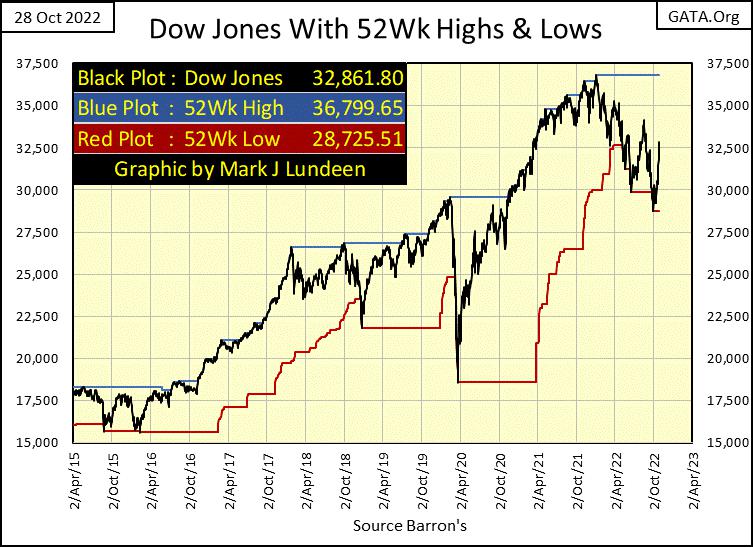
Here is the Dow Jones with its 52Wk High and Low lines. Just taking a quick look at the values given in the chart, the Dow Jones at week’s close has made up about half of its losses from its January 4th to September 30th decline.
Markets being markets, tells us the current advance is going to have to take a breather sometime soon. Meaning the Dow Jones didn’t go from January’s 36,799, down to September’s 28,725 in a straight line. I doubt it will make up those 8074 points in one smooth, continuous upward surge in the next few weeks.
On the coming pause in the market’s action, I wouldn’t be shocked seeing Mr Bear use this halt in advancing market momentum to make his next big move; DOWN. Taking the Dow Jones below 25,760 (BEV -30%), and then deeper into bear country. That’s not a prediction. I’m only considering a possibility.
Mortgage rates closed the week over 7%. So? Only that there is a big bear market going on in real estate for the past year or so. I did a quick check in the internet for articles on this bear market in real estate, but didn’t find any. However, looking at the table on the chart below, the difference in principle between what a $1000 a month mortgage could finance, between the lows of January 2021 (2.65%), and 6.00%, is down by 33%.
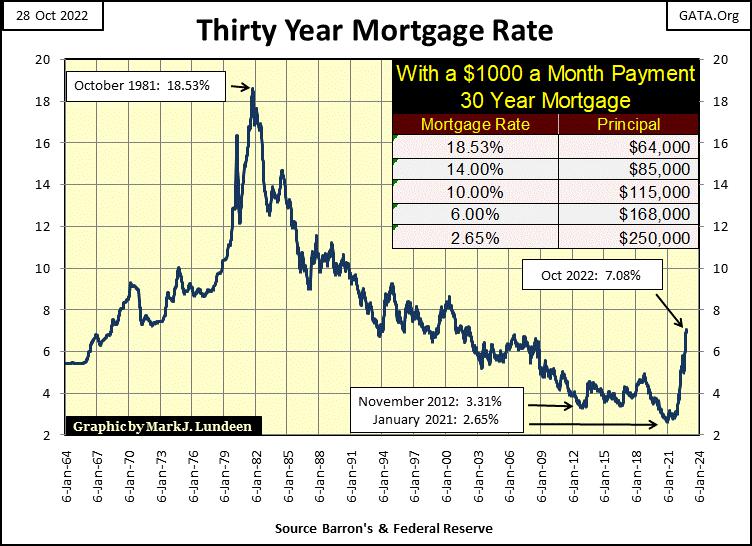
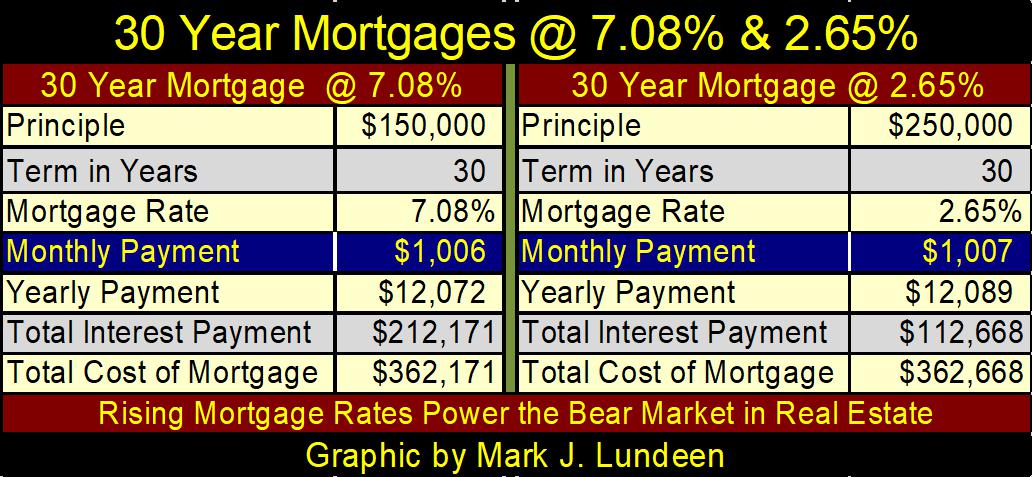
Using my mortgage amortization table (below), a rate of 7.08% for a 30-year term mortgage; a $1000 a month mortgage payment will afford only $150,000 in principle. That’s a decline of 40% from what a $1000 a month could afford from January 2021, when mortgage rates were 2.65%.
Think of this as rising mortgage rates has contracted the available pool of funds for the real estate market by 40%.
That mortgage rates have increased from 2.65%, to 7.08%, and not impact real estate valuations is simply not possible. There is a huge bear market in progress in American real estate, a massive bear market the main-stream financial media has for the most part, so far chosen to ignore. As mortgage rates approach 8%, I expect that will change.
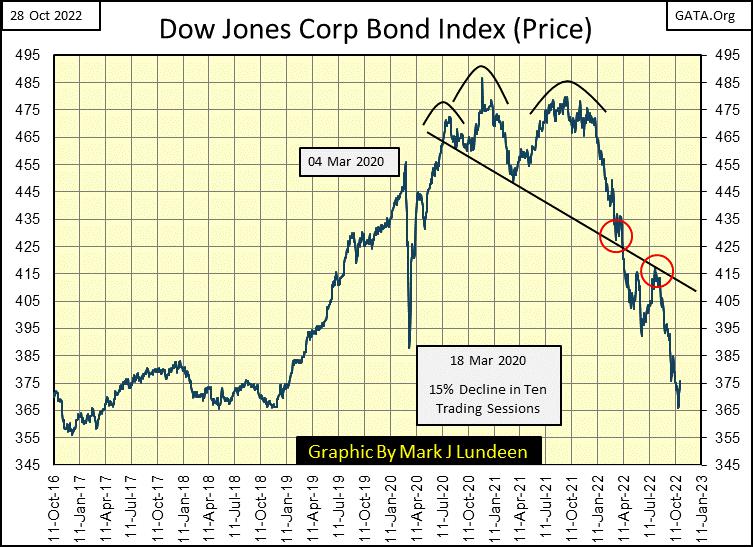
The performance for the bond market is very similar to what is happening above in mortgages, as both are fixed income financial instruments. Here’s the chart for the valuation for the Dow Jones Corporate Bond Index. It’s down 20% since January of this year.
This bear market in fixed income is really putting the squeeze on pension funds and insurance companies. And then there are the banks, who also use fixed income instruments for their reserves. It’s only a matter of time before we begin reading about specific performance issues with fiduciaries for other people’s money.
What are the idiot savants over at the FOMC doing? The idiots are still busy draining “liquidity” from the financial system. This week, the 10Wk M/A for their weekly QT fell to -$14.05 billion in the chart below.
This continuing program of Quantitative Tightening (QT) by a bunch of idiots, as they’re also committed in raising interest rates, are all by themselves reasons for believing the economy (and stock and bond markets) will crater sometime in the not-too-distant future.
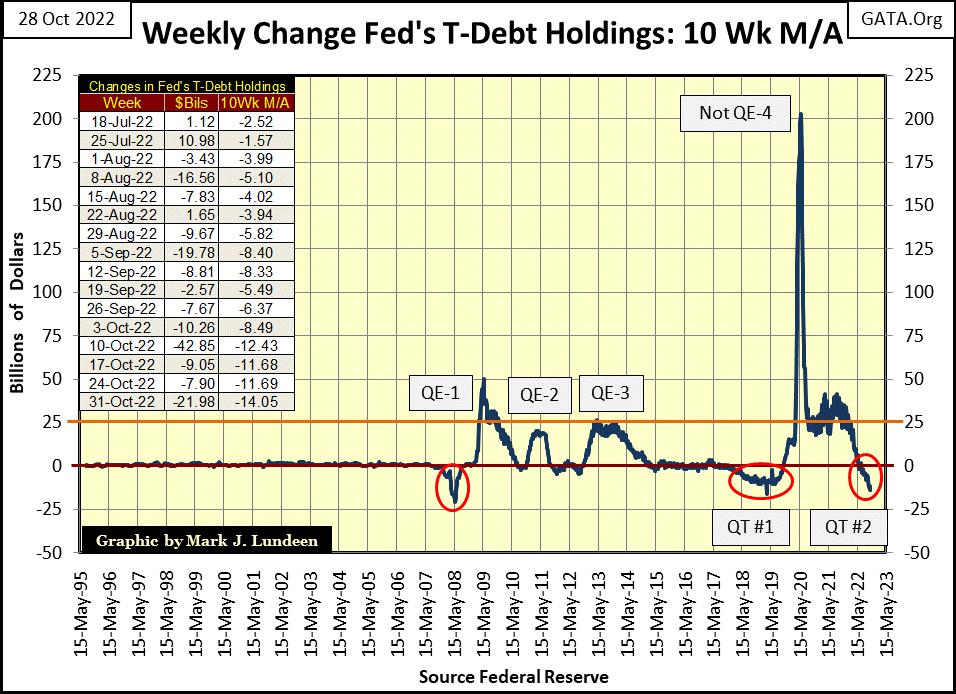
Don’t believe that? Look at the chart above where QEs make the stock and bond markets soar up to new all-time highs. And the QTs (declines below the red $0 line) result in market panics, though the panic for QT #2 is still waiting on the sidelines before coming on the ice to create total chaos for everybody else.
Look at the nasty plunge (above) below the red $0 line QT #2 has already achieved. The next panic on Wall Street will be historic. As we head into November 2022, the only safe place to be is either in the market’s peanut gallery, wagering hotdogs and beers on the stock market, or in gold and silver bullion and precious metals mining shares.
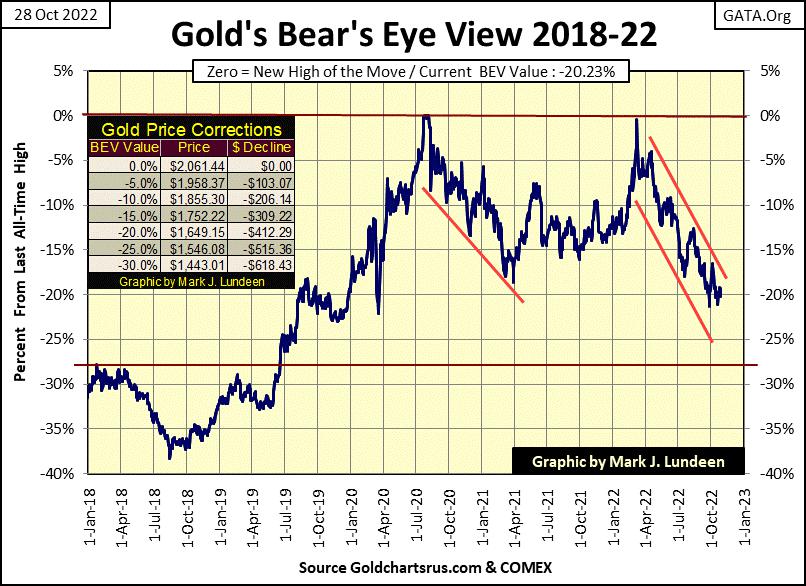
Let’s look at gold’s BEV chart below. Gold isn’t doing what I want it to do; surge up to its BEV Zero line, and stay there for a few years. But then it’s not doing what the “policy makers” want it to do either; breaking decisively below its BEV -27.5% red-line.
That is all going to change, as the multi-decade long price suppression in the precious metal markets is how one goes about creating a shortage in precious metals. Let’s look at COMEX silver inventories below, since February 2021 they have declined by 25%. A decline of 25% at the COMEX shouldn’t be all that big of a thing, until one realizes this is one, if not the only significant stockpile of silver in the world.
It didn’t use to be. During WWII, the US Treasury had billions of ounces of silver stored in its vaults. But since 2002, that silver is now all gone. The same was true for many countries’ inventories of silver, where once before there were many stock piles of silver bullion, to today where there is now only one.
No doubt there are private silver inventories of silver. Think of the new King of England; Charles III. I’m just speculating, but I’d be surprised if the British Crown didn’t have a few tens-of-millions of ounces of silver tucked far away from prying public eyes. And if so, King Charles has no intention of selling his silver, exchanging his metal for the flawed currencies now used in the markets.
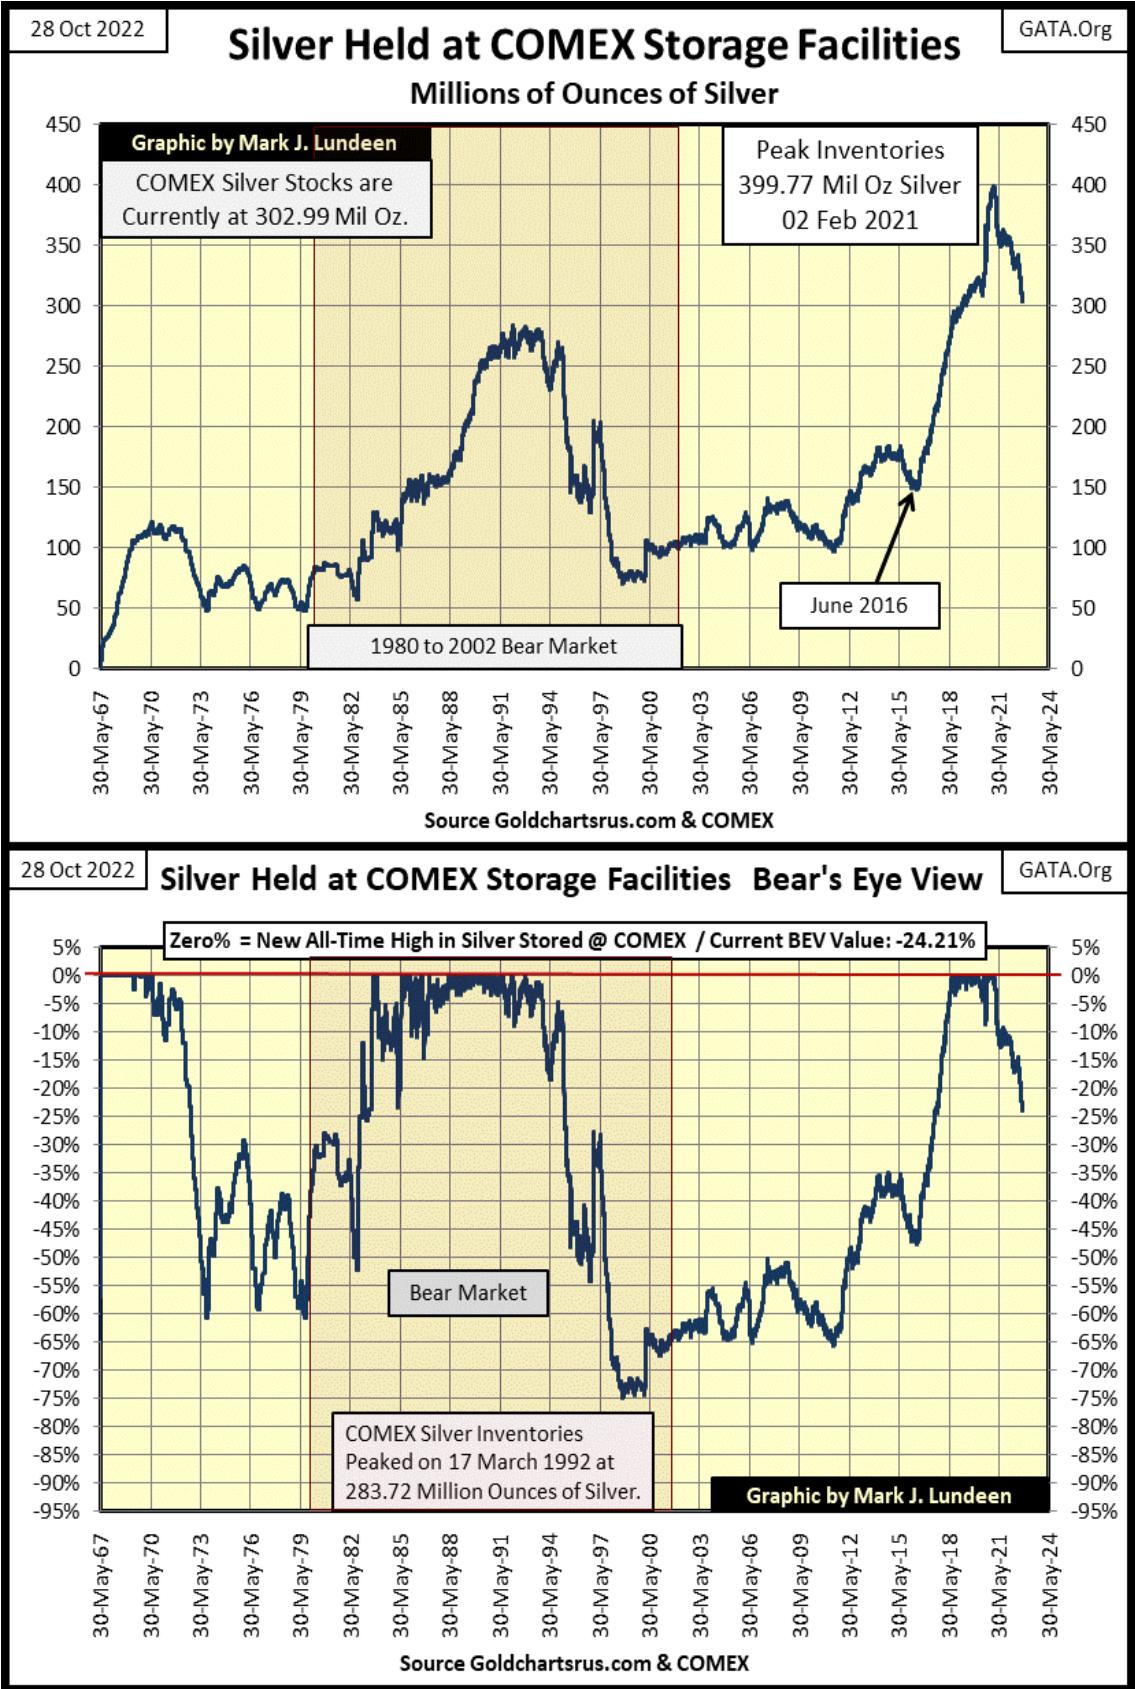
Looking at COMEX silver inventories BEV plot above, I wonder what the price of silver will be should (when) this BEV plot goes below -50%?
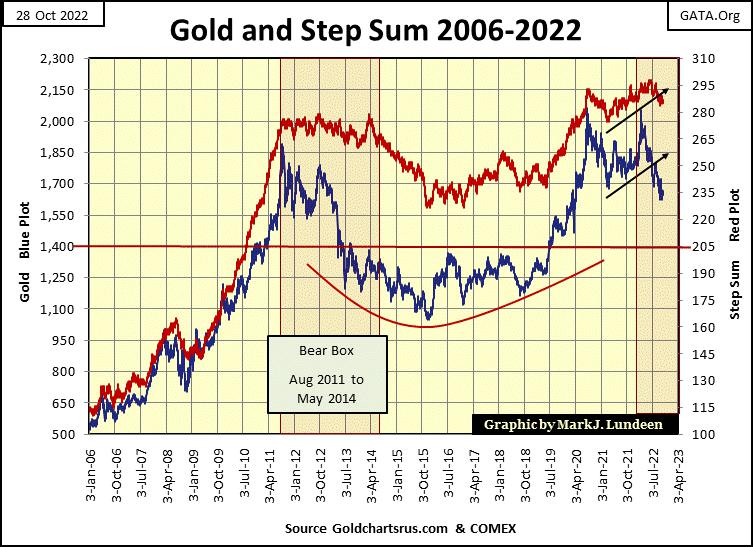
Here is gold’s step sum chart. Gold’s step sum (Red Plot) appears to be breaking down, but I’d like it to go below 280 before I close this box. That plus seeing the price of gold break below $1550. Can the price of gold go below $1550? It could, but I have my doubts that it will. This would be especially so should those “specific performance issues” mentioned above in the fixed income markets begin to become come matters of public knowledge.
Keep in mind, a bear box is a place where bulls go to be punished for being wrong; being bullish in a bear market. But I’m not so sure the gold bulls are wrong for being bullish in 2022. I think this box is going to fail; see the price plot break upwards, taking its step sum plot up with it.
I’m just going to take this bear box on a week-by-week basis, to see how it resolves itself.
If one wanted to see what a bear box looks like as it fails, go no further than the bear box in the Dow Jones below. The blue price plot is surging the wrong way; upwards, as the red step sum plot is also beginning to rise. Like gold’s bear box above, we were waiting for the step sum plot to collapse, as the price plot continued to go ever deeper into bear country. But that isn’t happening in the bear box below.
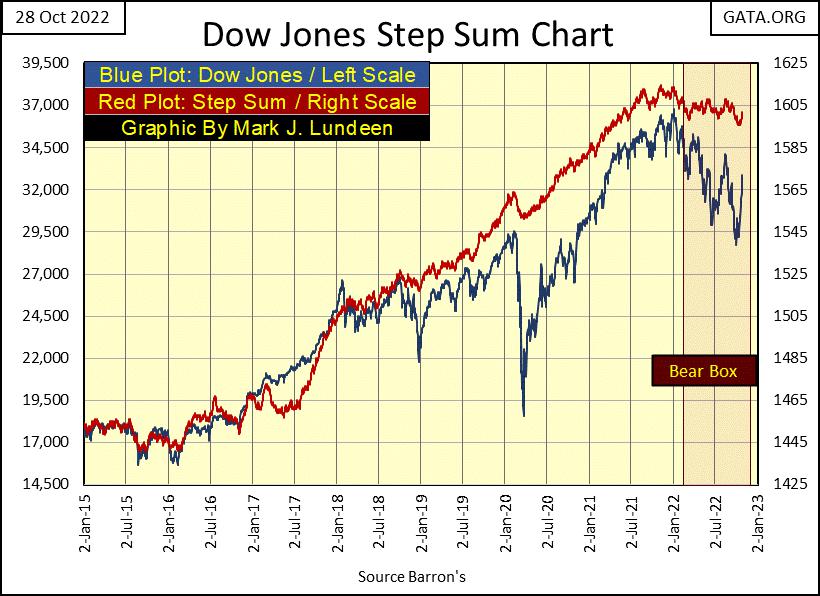
If a bear box is where bulls go to be punished for being wrong; for being bullish in a bear market, I believe that is exactly what is ultimately going to happen with the stock market bulls. It’s only a matter of time to know when Mr Bear is going to punish them.
So, I’m not so quick to give the above bear box a failing grade and close it. We still have two months in 2022. Given all the problems happening in the world today, as noted this week above, seeing the Dow Jones close below 24,500 by New Year’s Day is a real possibility. How the Dow Jones’ step sum above would respond to that is something best left to the market to see.
Let’s move on to gold’s step sum table below. Gold’s step sum closed the week exactly where it was on September 26th: at 285. The COMEX goons are going to have to generate more down days in the gold market to make this step sum collapse. The week closed with gold’s 15-count at a neutral -3, meaning the gold market is neither overbought or oversold.
So, looking at gold’s step sum table, what do the numbers below portend for the future? Heck, I don’t know what this mush of numbers are saying, except maybe we’ll have to do some more waiting before we see anything decisive about where the gold market is heading in the near-term future. Seeing gold’s daily volatility’s 200D M/A begin surging towards 1.00% would be a nice start. But so far, that isn’t happening.
But I still like gold and silver, for the same reasons I don’t like stocks, bonds and real estate; rising rates and bond yields, as well as a continuing QT by a bunch of idiots, has resulted in the financial system becoming pregnant with pending counter-party failure. When this pregnancy comes to term, and Mr Bear comes popping out and begins strutting his stuff, we’ll see yet unknown financial institutions, both large and small frog-marched to the chopping block. That will be very positive for gold and silver. Count on it!
But when? I don’t know when, just that it will. Sometimes patience is a real virtue in the market.
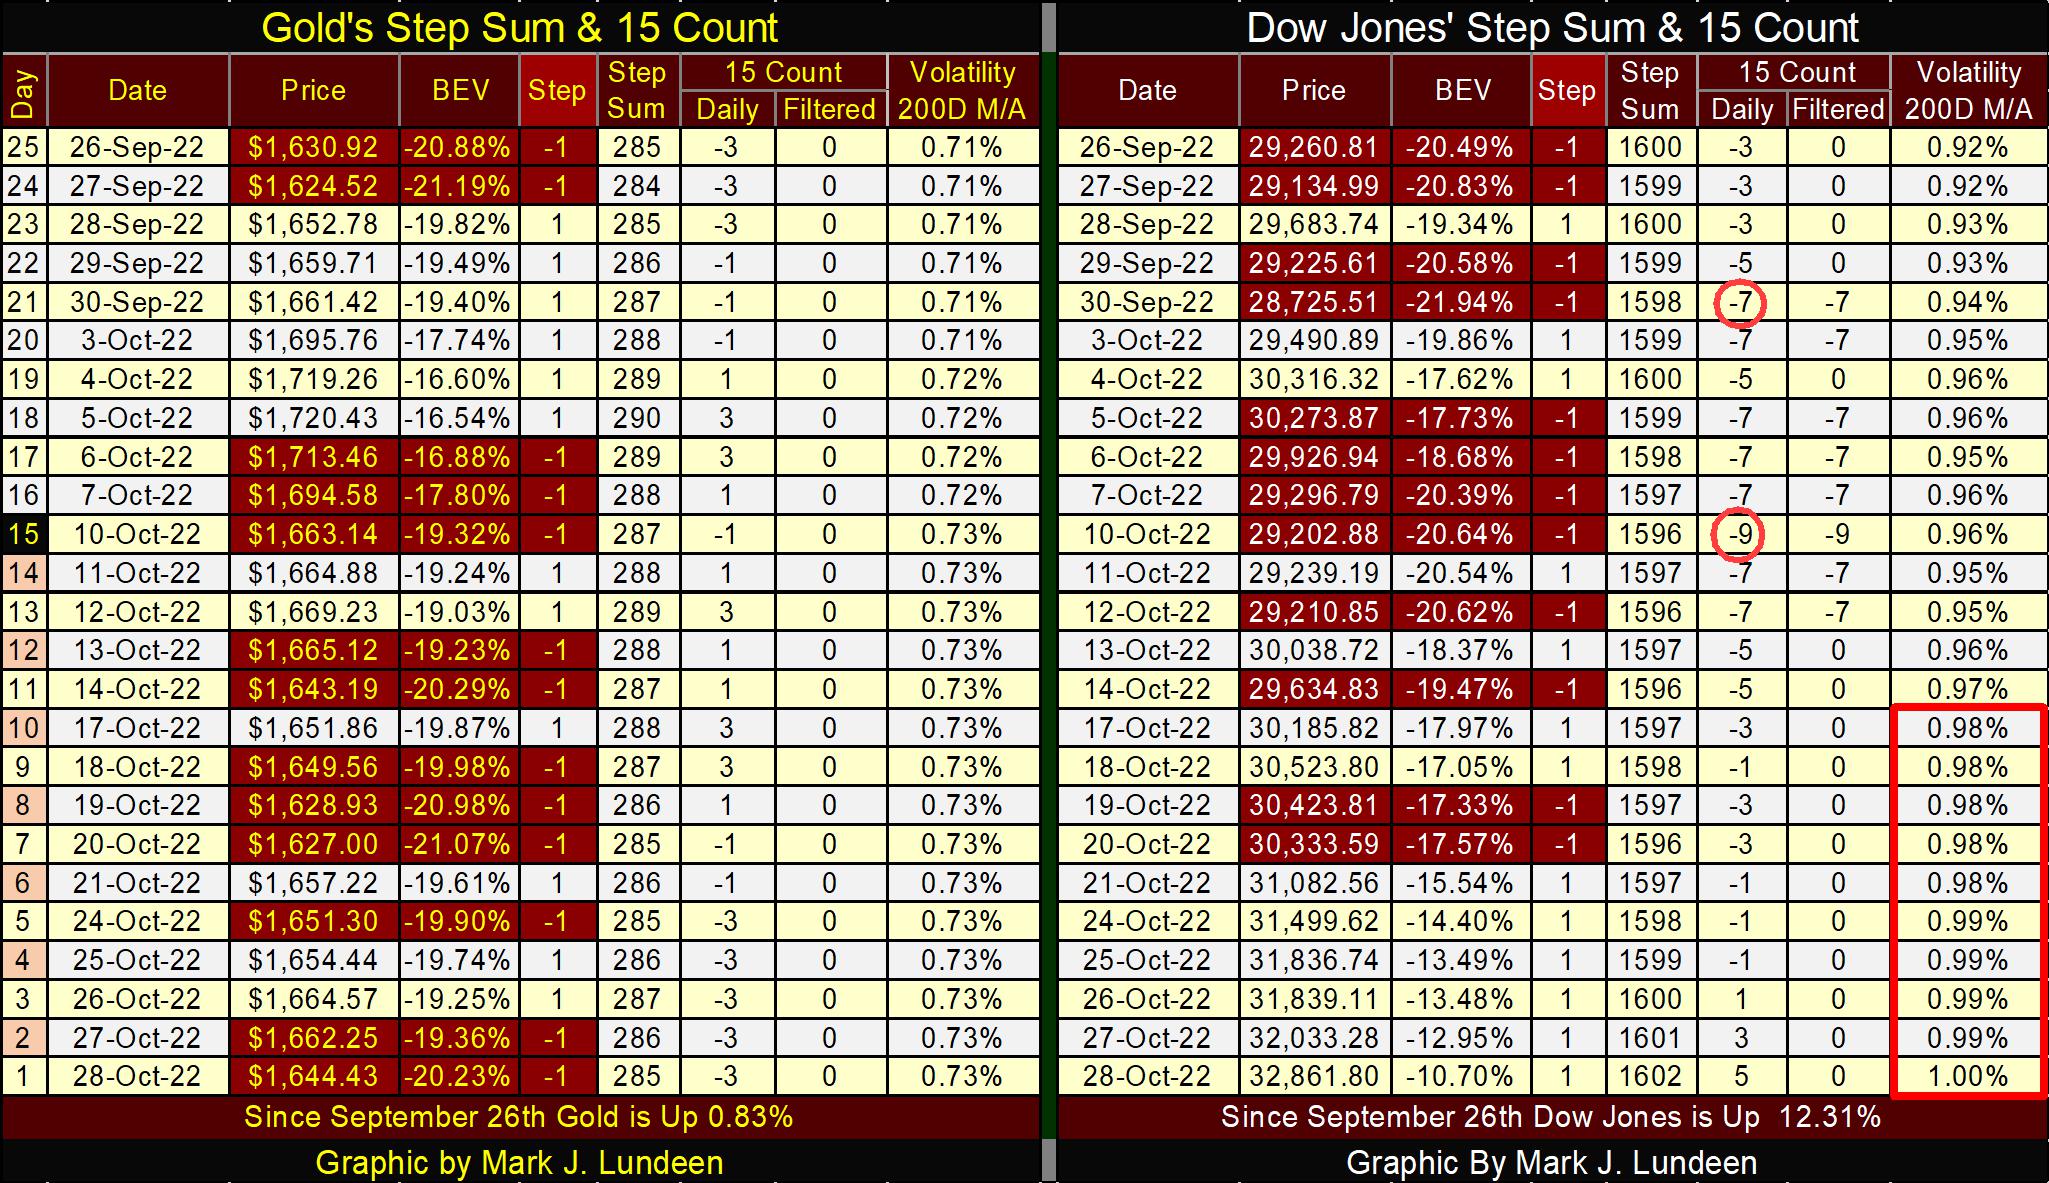
On the Dow Jones side of the table above, its 15-count became a -9 on October 10th, making the Dow Jones a very oversold market. Markets don’t like being very oversold. So, we shouldn’t be surprised seeing the Dow Jones advancing 3,659 points to work off that -9 by Friday’s close.
What is surprising is seeing the Dow Jones daily volatility’s 200D M/A hit a 1.00% on Friday, as the general perception of the stock market remains bullish. Typically, when this volatility indicator hits a 1.00%, the Dow Jones is going down in what everyone agrees is a big-bear market. Give it time, and this will happen.
But maybe we first need to see the Dow Jones 15-count become overbought with a +7. Looking at the table above, that is a strong possibility sometime next week or the week after. As we know; markets don’t like being overbought.
Mark J. Lundeen
*********


