The Gold Dust Settles


Dow “Sell In May” Chart
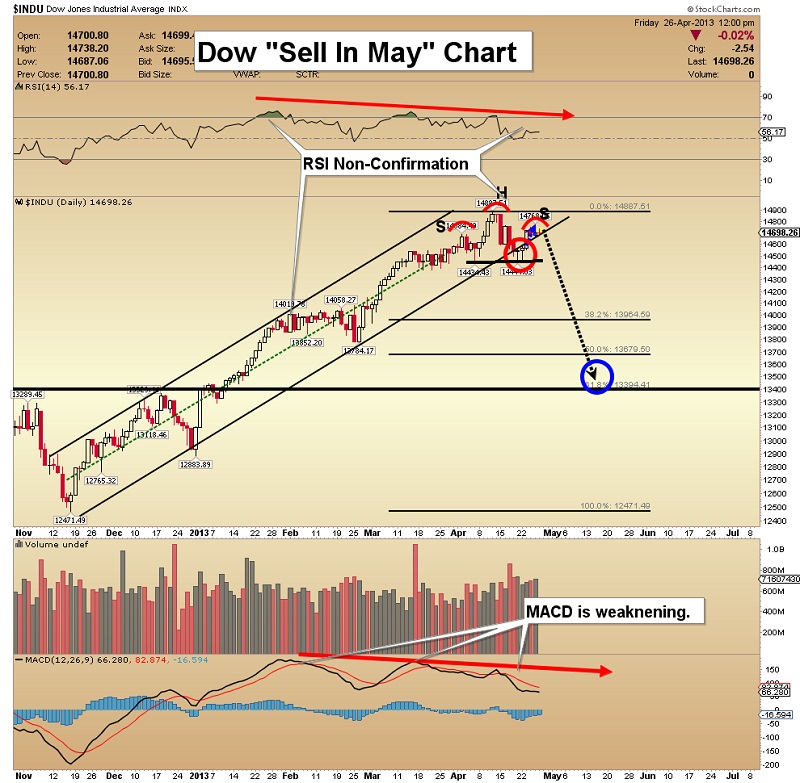
- The US stock market has been resilient, but technical warning signs are appearing now.
- Momentum and sentiment indicators suggest the market is peaking. The Dow has a head & shoulders top pattern in play, and volume patterns are turning negative.
- The market is also moving into a more challenging time of the year. “Sell in May and go away” is a time-tested stock market rule of thumb. If the Dows breaks 14,400, I see a tumble, to about 13,500.
- I have exited most of my positions in the general equity market over the past 2 months. Aggressive investors could buy put options for speculation, and conservative investors who are invested in the stock market should also buy them, for protection.
TLT (T-Bond Proxy) Consolidation Chart
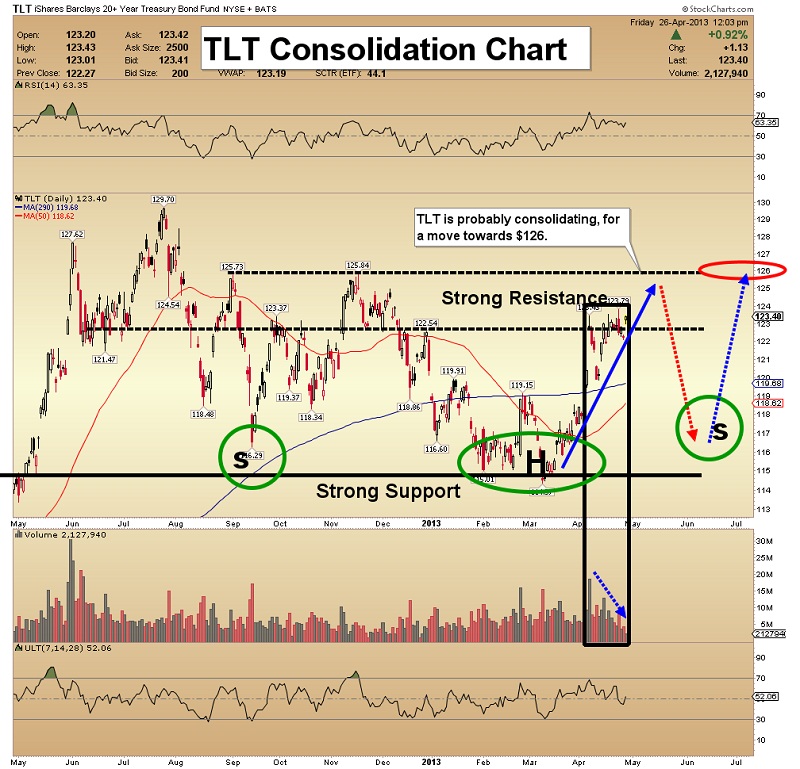
- Volume is bullish, and that suggests bond prices are consolidating. I think the market is getting ready to move towards $126. From that general price area, I see a decline to around $116.
- The ongoing decline in US economic numbers may force the Fed to cut interest rates again, and that could help create the right shoulder of a bullish inverse head & shoulders pattern on TLT.
- Gold has tended to rally when bonds rally, in this crisis. While a fall below $116 could send gold to about $1250, a major rally in the bond market could help gold climb back towards $1600.
Gold Sentiment Chart
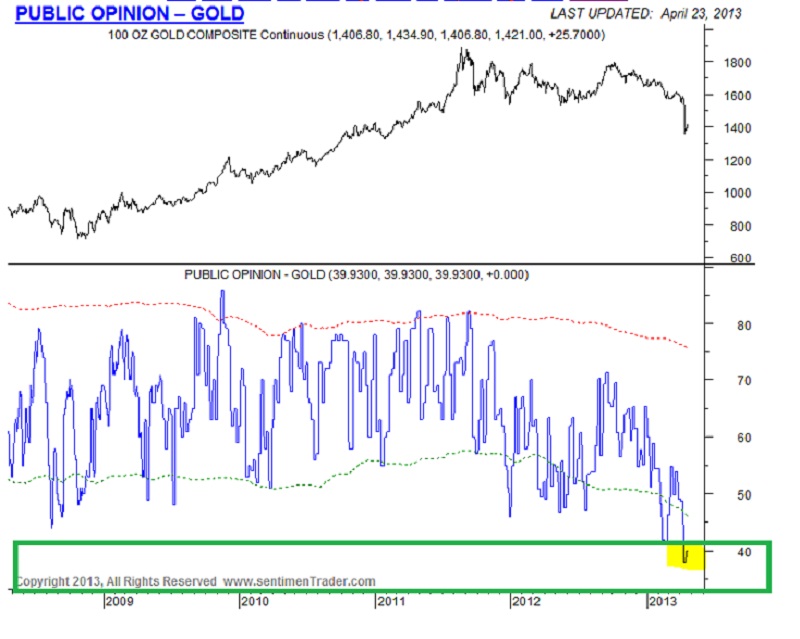
- The latest reading from Sentimentrader.com shows that the public in the West is more bearish now,than at the 2008 market lows.
- In the meantime, Asians are lining up to buy. Which group of investors is correct?
- Historically, the American public loses its appetite for gold near the bottom of a decline. I’m buying some gold now.
Gold $1600 Target Chart
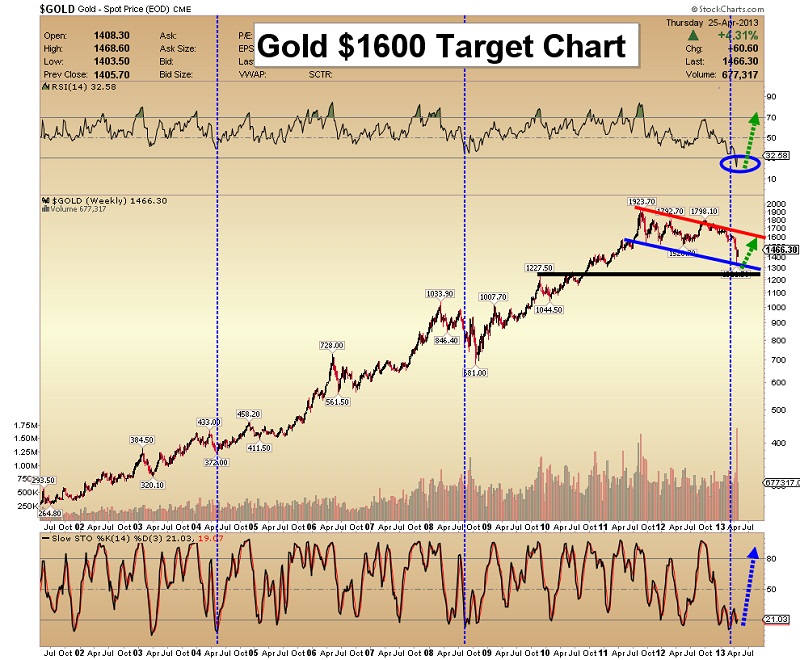
- Whether gold has bottomed or not, I expect the next rally to take it up towards the red trendline, on this chart. That would put it near $1600.
- Note the position of the RSI oscillator. On this chart, it’s at a record low. The Stokes oscillator is also very bullish.
- Asian value buyers tend to be attracted to this type of situation. They aren’t concerned about whether “the low is in” or not; they just believe gold offers good value, so they are strong buyers now.
- Their approach has been pretty successful, for thousands of years!
HUI Backtest Chart
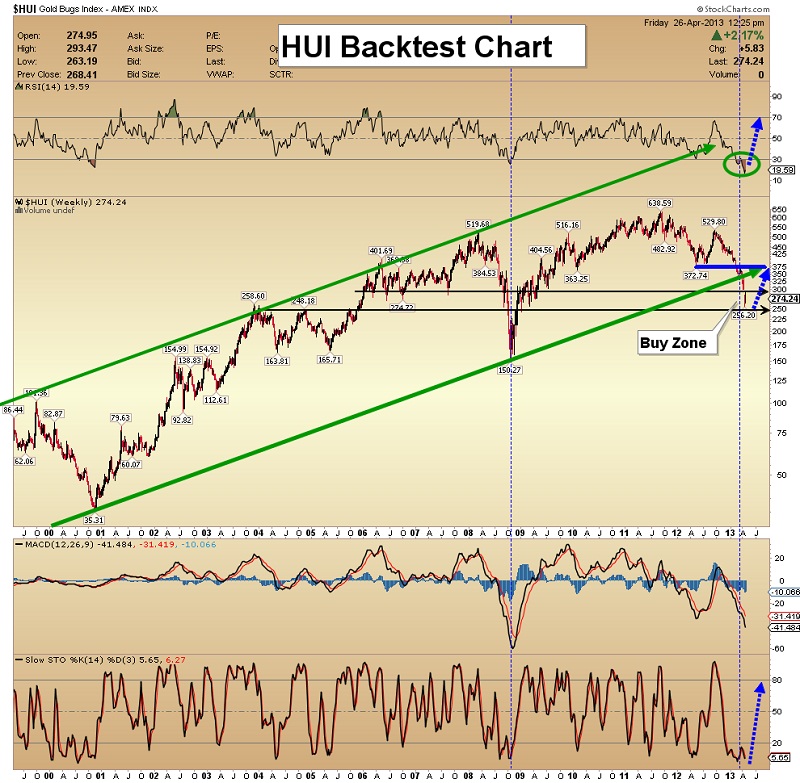
- Note the deeply oversold RSI and slow Stokes oscillators on this weekly chart. Even the most bearish investors should be alert for a strong rally that takes the HUI index back up to test the broken trend line,near 375.
GDX Gap Chart
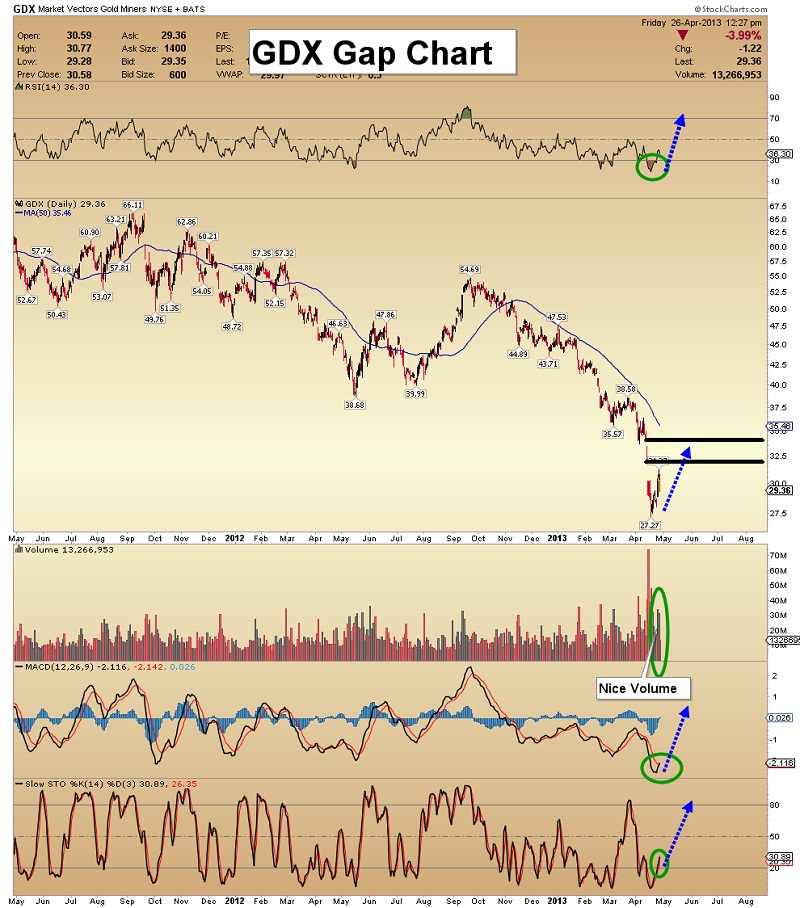
- There has been serious panic selling across the board in gold stocks, but the final low will only be determined by hindsight. Volume is increasing nicely on this rally, which indicates that further price appreciation is likely.
- In the short term, GDX looks good. My upside targets are based on the price gaps in the $32-$35 area.
- MACD is very close to a buy signal, and that could trigger additional buying from technical traders. Aggressive bulls could do a little momentum-based based buying here, with an eye on the $35 area.
GDXJ Backtest Chart
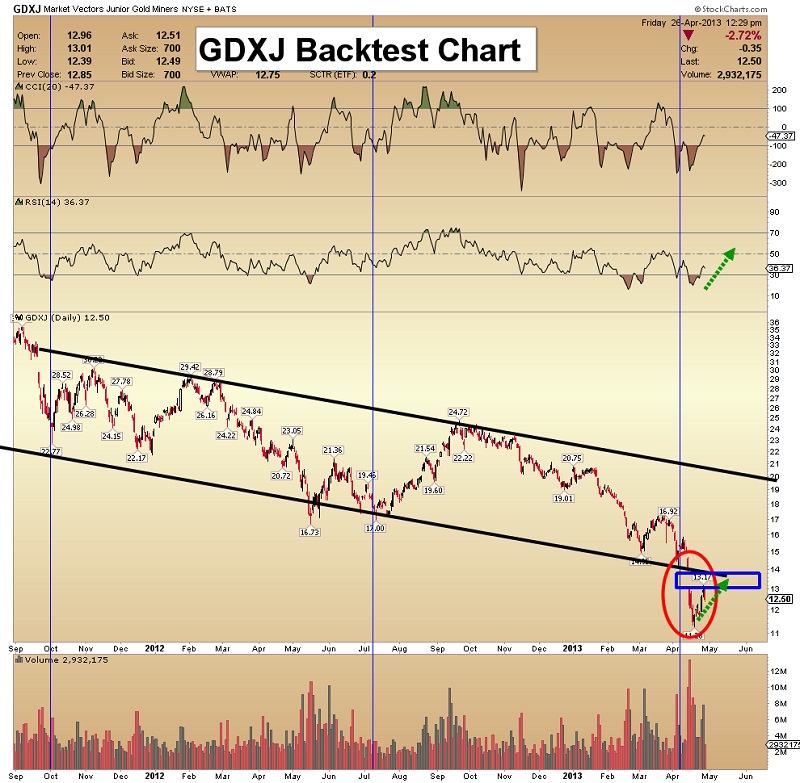
- I have suggested waiting for the (gold) dust to settle a bit, before rushing in to buy truckloads of junior gold stocks. The market is rallying, but the bears remain in control.
- Now, I would be a seller of GDXJ in the $13-$14 area. No matter how bearish the chart looks, I would be a “toe in the water” buyer at $11-$12.
- Until GDXJ can trade above $17, the bears will probably continue to dominate the bulls, but most people in the gold community are a special breed of investor. They don’t like quitting, and they are absolutely committed to a long term bull market in junior gold stocks, and so am I.
Silver $26 Target Chart
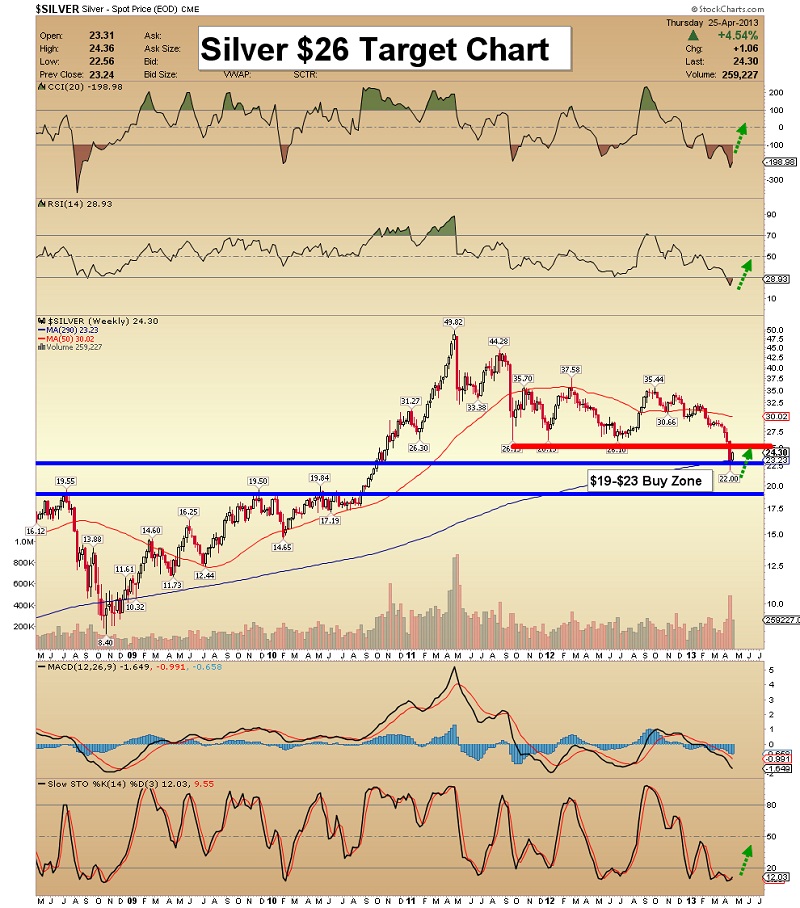
- Try accumulating silver in small tranches, rather than “backing up the truck”. I can put annotations on the chart that say, “buy now!”, but it’s not so easy to really buy, when the market is crashing.
- We all become scared that the price just won’t stop falling. One strategy that may interest physical metal accumulators, is shorting a bit of paper market silver near $26, and buying physical metal at $19-$23.
Unique Introduction For Gold-Eagle Readers: Send me an email to [email protected] and I'll send you 3 of my next Super Force Surge Signals, as I send them to paid subscribers, to you for free. Thank-you!
Stay alert for our Super Force alerts, sent by email to subscribers, for both the daily charts on Super Force Signals at www.superforcesignals.com and for the 60 minute charts at www.superforce60.com
About Super Force Signals:
Our Super Force signals are created thru our proprietary blend of the highest quality technical analysis and many years of successful business building. We are two business owners with excellent synergy. We understand risk and reward. Our subscribers are generally successful business owners, people like yourself with speculative funds, looking for serious management of your risk and reward in the market.Frank Johnson: Executive Editor, Macro Risk Manager.
Morris Hubbartt: Chief Market Analyst, Trading Risk Specialist.[email protected]
[email protected]Super Force Signals
422 Richards Street
Vancouver, BC V6B 2Z4
Canada


