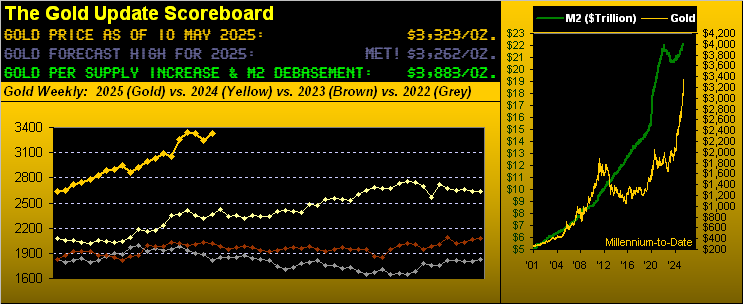
Gold Regains Ground (albeit Stumbles Around…)


Our missive’s title is ever so suitable for parsing… So let’s go!
Part Un: “Gold Regains Ground” for indeed it did in settling yesterday (Friday) at 3329 for a net weekly rise of +82 points (+2.5%). Heaven forbid price instead have suffered a third consecutive down week! Why, that hasn’t happened since those ending the 1st, 8th and 15th of November last year!
Part Deux: “(albeit Stumbles Around…)” for after reaching as high as 3448 on Wednesday — up +201 points (+6.2%) into mid-week — selling then ensued such as to settle Gold at the noted 3329, which all-in-all is now -181 points (-5.2%) below the All-Time High of 3510 recorded back on 22 April.
“And it made a record down move for an up week, right mmb?”
Spot on, Squire. Thus far in this 21st century-to-date there have been 1,271 trading weeks of which 708 (56%) have settled net up for Gold. And the record to which Squire refers is based specifically on points lost from the intra-week high to the end-of-week settle: Gold went down -119 points from Wednesday’s high in nonetheless finishing net up for the week. More realistically on a percentage basis, the high-to-settle drop of -3.5% still ranks 12th-worst for an up week so far this century, and by those -119 points, the worst for an up week since President Nixon nixed The Gold Standard back in ’71.
Thus in reprising our entitled query of a week ago: “Is Gold’s Great Run Finally Done (for now…)?” we sense that the up week’s record setting high-to-settle points loss sensibly suggests that Gold has — for the present — run out of puff. Further as we turn to Gold’s valuation per our proprietary BEGOS Markets measuring, price today remains +157 points “high” above the smooth line as shown here:
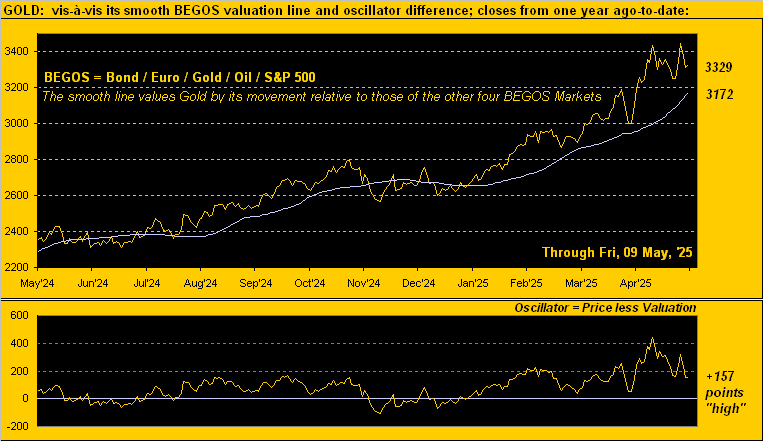
Moreover, Gold also is at this century’s record for the number of consecutive trading days in having settled above said smooth valuation line: 86, (which for you WestPalmBeachers down there is better than four months). The previous record of 75 trading days was set in both 2024 and 2019. So to say this great Gold rally has become “a bit long in the tooth” arguably is reasonable, despite it being magnificent that Gold has been garnering long-overdue notice.
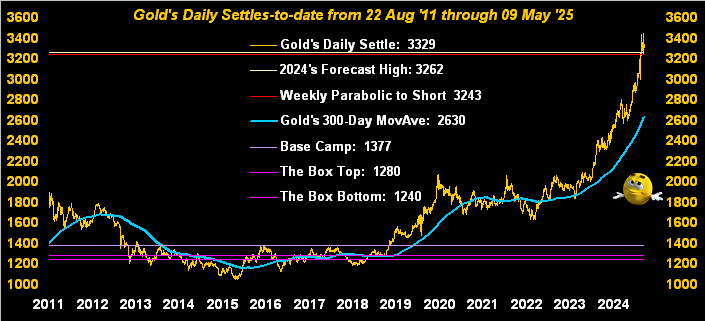
Still, specific to this past intra-week’s points plunge, let’s go to Gold’s weekly bars from a year ago-to-date. And as therein stated, the red portion of the rightmost bar is the largest points drop for any up week in Gold’s history; (yes the intra-week drop two weeks prior was worse, but ’twas a net down week). As for the still ongoing blue-dotted parabolic Long trend, ‘twould come to an end should 3243 be eclipsed (“just” -86 points from here) in the new week:

Too, in looking at Gold’s settles by the day across some 15 years, price has gotten quite far afield from its traditionally “guardian” 300-day moving average, such deviation at present being +699 points above the next graphic’s blue line. But by percentage distance, price is “only” +26.6% above that average; the record is +47.4% exactly 19 years ago on 11 May 2006, Gold then priced at 722, from which by mid-year it fell -24%. Yes, Virginia, price retreats do happen, (oft when all around are bullish):
As to the lowlight of last week, the Federal Reserve did its present posture preserve. For in line with consensus, the Open Market Committee maintained its Bank’s Funds Rate in the 4.25%-to-4.50% target range. But for those of you who diligently follow the deMeadville website and The Gold Update, you must have been rather startled by what the Fed said, as culled from the opening paragraph of Wednesday’s FOMC Policy Statement that we’ve embedded below in the Econ Baro:
“Economic activity has continued to expand at a solid pace”? Look above at the Baro’s blue line since February. And as rightly forecast by the Fed’s own Sixth District Atlanta branch, we already knew back on 30 April the initial read of annualized Q1 Gross Domestic Product was negative.
“Inflation remains somewhat elevated“? Recall from last week’s missive the summary table of March’s inflation paces? Not only were they disinflationary, but some were DEflationary! Perhaps the Fed sees March as a “one off”: to be sure, 12-month inflation through March still averaged +2.6%, effectively in excess of the Fed’s desired +2.0% target. Let’s see what the Bureau of Labor Statistics has in the coming week for April’s Consumer Price Index (Tuesday) and Producer Price Index (Wednesday): consensii expect a pickup in inflation’s pace.
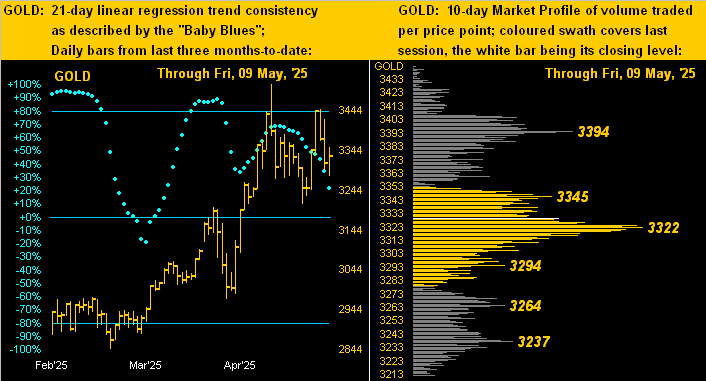
Meanwhile, losing upside pace is Gold. Clearly this is evident in the left-hand panel below of Gold’s daily bars from three months ago-to-date. Whilst the baby blues dots are still above their 0% axis — indicative that price’s trend remains up — their contrarily being in descent denotes the consistency of the uptrend as breaking down. As for Gold’s 10-day Market Profile in the right-hand panel, the “line in the sand” price to hold is 3322:
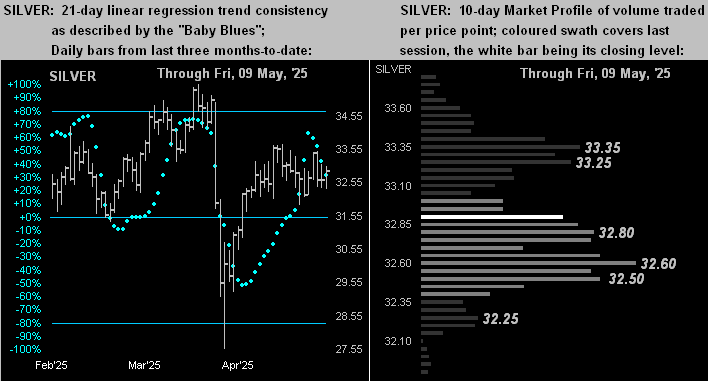
Silver’s picture is quite similar. Her trend (on the left) is positive, but like that for Gold is losing consistency as her “Baby Blues” too have begun to fold. And as to her 10-Day Market Profile (on the right), price at present (32.88) is not too far from her most volume-dominant supporter at 32.60. ‘Course, relative to Gold, Sweet Sister Silver remains considerably cheap per the Gold/Silver ratio now 101.3x versus the century-to-date average of just 69.0x:
In sum, its emotive hype aside, we still anticipate a bit lower Gold near-term; (indeed a most-valued colleague here suggested yesterday — over a delightful rosé — that 2400 is in the offing). That’s a bit out of range (-24%) from our perspective; however, Gold obviously has corrected by at least such percentage, notably during 2006-to-2008, certainly so post-2011’s All-Time High through 2015, as well as during 2019-to-2020. ‘Tis merely what the world’s major liquid financial markets on occasion do.
Next week also brings the calendar conclusion to Q1 Earnings Season, which to this point for the S&P 500 constituents is “average” for year-over-year quarterly improvement. ‘Course as you saw earlier in the Economic Barometer, the S&P 500’s price/earning ratio is an inane 43.0x. Thus earnings are on balance improving, but their overall level remains far too low to continue supporting price; (how’s that 1.359% annualized dividend yield workin’ out for ya?)
And specific to the Econ Baro, a huge load of 19 metrics are scheduled for the ensuing week. Shall the Baro live up to the Fed’s “solid pace” perception of the economy? As ever, we’ll mind the math…
…whilst you, rather than stumble around, mind — indeed mine — your Gold and Silver fine!
Cheers!
…m…
www.TheGoldUpdate.com
www.deMeadville.com
and now on “X”: @deMeadvillePro
********

Mark Mead Baillie has had an extensive business career beginning in banking and financial services for two years with Banque Nationale de Paris to corporate research for three years at Barclays Bank and then for six years as an analyst and corporate lender with Société Générale.
For the last 22 years he has expanded his financial expertise by creating his own financial services company, de Meadville International, which comprehensively follows his BEGOS complex of markets (Bond/Euro/Gold/Oil/S&P) and the trading of the futures therein. He is recognized within the financial community of demonstrating creative technical skills that surpass industry standards toward making highly informed market assessments and his work is featured in Merrill Lynch Wealth Management client presentations. He has adapted such skills into becoming the popular author each week of the prolific “The Gold Update” and is known in the financial website community as “mmb” and “deMeadville”.
Mr. Baillie holds a BS in Business from the University of Southern California and an MBA in Finance from Golden Gate University.


