Sentiment Speaks: Are Mom and Pop All In?


Oftentimes, people view the market as more of a mystery than it really has to be. When you break the market down into its most simplistic perspective, then you recognize that markets top when everyone is in, and markets bottom when everyone that wants to sell has sold. In other words, when markets reach an extreme in bullishness, the market tops, and when it reaches an extreme in bearishness, the market bottoms.
Alan Greenspan once noted something similar when he stated:
“It's only when the markets are perceived to have exhausted themselves on the downside that they turn.”
But, the more difficult part of this analysis is in determining when those extremes are reached. To this end, we utilize Elliott Wave analysis to determine when a market is reaching an extreme of bullishness. And, we are almost there.
This past week, I was honored to give a keynote address at the MoneyShow in Miami. What became quite clear to me early on was that the bullishness of speakers and attendees alike was quite ubiquitous. In fact, I heard several other speakers that many would see on television use the word “certain” in their view of the market heading much higher. I may have been the only one that even discussed the potential for a major bear market on the horizon.
Now, before you mistake me for a perma-bear, please keep in mind that I was called a perma-bull when I advised in public articles to go long the SPX at 2200 in 2020, and then again at 3500 in 2022. As my clients have said, I am not a perma-bear, and I am not a perma-bull. I am simply perma-profit.
As I said at the start of this missive, when the market gets too bullish, that is when we strike a major market top. And, based upon the following chart from the Fed, it looks like everyone is piling into the stock market at historic proportions.
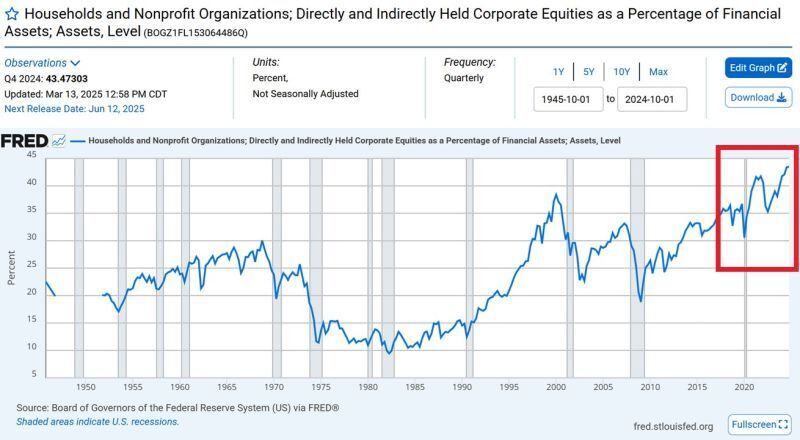
But, as I also said earlier, while this chart is more anecdotal in nature, and cannot tell us anything other than the market is likely approaching a top of major proportions, we utilize Elliott Wave analysis to tell us if the market has indeed struck a major top already. Interestingly, the last major top which was struck in the market was the 2000 market high. That led us to a 9 year market correction, which completed at the lows of the 2008-09 market crash. Since that market correction is one degree smaller than the one I am expecting to begin on the horizon, I believe it is reasonable to expect the next correction to last longer than the 9 year correction which began in 2000.
So, let’s discuss what we are looking for in our analysis to confirm when a top is struck.
First, allow me to explain the basics of Elliott Wave analysis. Back in the 1930’s there was a gentleman named Ralph Nelson Elliott who identified that the stock market represented the unconscious, non-rational reactions of society which follow a repeating fractal pattern, which means they move in variably self-similar patterns at all degree of trend. This repeating fractal pattern represents overall societal sentiment which is governed by the natural law of the universe as represented through Fibonacci Mathematics.
Now, to be clear, people often mistake what I am saying as meaning that the patterns are what drive society. But, the truth is that the patterns represent the social mood of society en masse, and it is that societal sentiment that causes these fractal patterns we see in the market.
Most specifically, Elliott theorized that public sentiment and mass psychology move in 5 waves within a primary trend, and 3 waves within a counter-trend. Once a 5 wave move in public sentiment has completed, then it is time for the subconscious sentiment of the public to shift in the opposite direction, which is simply the natural cycle within the human psyche, and not the operative effect of some form of “news.”
So, at this time, I am going to be watching the next pullback in the market quite intently. You see, if the market provides us with a 5-wave decline, then that is an initial signal that a major market top has potentially been struck. If we then set up a decline to break down below the April low of 4835SPX, then this should confirm that a long-term bear market has likely begun, and we are on our way to the 3500-3800SPX region to complete the first leg down in this long-term bear market that I am expecting.
However, if the next pullback in the market is clearly a corrective 3-wave pullback, then we will begin to prepare for a rally that will likely take us north of 6200SPX as we look out into later this year. But, even so, we may still be rangebound until the end of the summer before a major break out is seen.
One way or another, whether we get that one more rally or not, in the big picture I am foreseeing a major bear market beginning on the horizon. And, the anecdotal evidence of retail piling into this market with their money is certainly supporting my proposition.
*********
 Avi Gilburt is a widely followed Elliott Wave technical analyst and author of ElliottWaveTrader.net, a live Trading Room featuring his intraday market analysis (including emini S&P500, metals, oil, USD & VXX), interactive member-analyst forum, and detailed library of Elliott Wave education. You can contact Avi at: [email protected].


