Gold Mid-Tiers’ Q2’25 Fundamentals
 share
share
 share
share
 share
share
 share
share
 share
share
Mid-tier and junior gold miners just finished reporting spectacular record quarterly results! In the sweet spot for sector upside potential, smaller gold miners’ fundamental performances handily bested their larger peers’. They shattered every major financial record, while also achieving superior operational results. That left their stock prices even more seriously-undervalued, portending more big mean-reversion gains.
The leading mid-tier-gold-stock benchmark is the GDXJ VanEck Junior Gold Miners ETF. With $6.0b in net assets mid-week, it remains the second-largest gold-stock ETF after its big-brother GDX. That is dominated by far-larger major gold miners, though there is much overlap between these ETFs’ holdings. Still misleadingly named, GDXJ is overwhelmingly a mid-tier gold-stock ETF with juniors having little weighting.
Gold-stock tiers are defined by miners’ annual production rates in ounces of gold. Small juniors have little sub-300k outputs, medium mid-tiers run 300k to 1,000k, large majors yield over 1,000k, and huge super-majors operate at vast scales exceeding 2,000k. Translated into quarterly terms, these thresholds shake out under 75k, 75k to 250k, 250k+, and 500k+. Today only two of GDXJ’s 25 biggest holdings are true juniors!
Their Q2 outputs are highlighted in blue in the table below. Juniors not only mine less than 75k ounces per quarter, but gold output generates over half their quarterly revenues. That excludes streaming and royalty companies that purchase future gold output for big upfront payments used to finance mine-builds, and primary silver miners producing byproduct gold. But mid-tiers often make better investments than juniors.
These gold miners dominating GDXJ offer a unique mix of sizable diversified production, excellent output-growth potential, and smaller market capitalizations ideal for outsized gains. Mid-tiers are less-risky than juniors, while amplifying gold uplegs more than majors. So we’ve long specialized in the fundamentally-superior mid-tiers and juniors at Zeal, actively trading these smaller gold miners for a quarter-century now.
GDXJ has been performing well, starting to reflect mid-tiers’ amazing fundamentals. Midweek GDXJ has soared 71.4% year-to-date. That’s part of a larger +139.6% bull run since early October 2023. This ETF has achieved 15 secular-high closes so far in 2025, the latest being last Friday’s $73.88 proving GDXJ’s best close in fully 12.7 years! This bull run has yielded plenty of opportunities for really-profitable trading.
Nevertheless, the mid-tiers’ massive rally still remains on the anemic side by historical standards. These smaller gold miners tend to leverage material gold advances by about 3x to 4x. From early October 2023 to mid-June 2025, gold has powered 88.6% higher at best in a mighty cyclical bull without a single 10%+ correction! That supports enormous GDXJ gains of 266% to 354%, way bigger than its +140% bull run so far.
Case in point was during gold’s last 40%+ monster upleg cresting in early August 2020. As gold blasted up 40.0%, GDXJ skyrocketed 188.9% for outstanding 4.7x upside leverage! Given smaller gold miners’ spectacular record fundamentals evident in their latest results, their stocks sure ought to achieve similar outperformance to gold this time around. So the lion’s share of their stock-price gains are likely still yet to come.
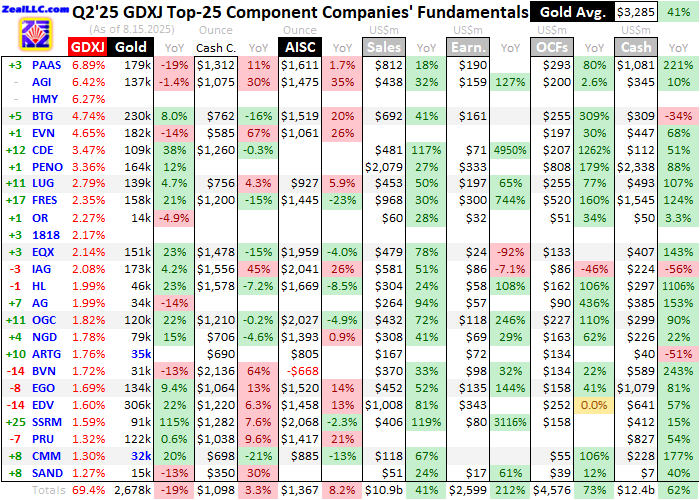
For 37 quarters in a row now, I’ve painstakingly analyzed the latest operational and financial results from GDXJ’s 25-largest component stocks. Mostly mid-tiers, they now account for 69.4% of this ETF’s total weighting. While digging through quarterlies is a ton of work, understanding smaller gold miners’ latest fundamentals really cuts through the obscuring sentiment fogs shrouding this sector. This research is essential.
This table summarizes the GDXJ top 25’s operational and financial highlights during Q2’25. These gold miners’ stock symbols aren’t all US listings, and are preceded by their rankings changes within GDXJ over this past year. The shuffling in their ETF weightings reflects shifting market caps, which reveal both outperformers and underperformers since Q2’24. Those symbols are followed by their recent GDXJ weightings.
Next comes these gold miners’ Q2’25 production in ounces, along with their year-over-year changes from the comparable Q2’24. Output is the lifeblood of this industry, with investors generally prizing production growth above everything else. After are the costs of wresting that gold from the bowels of the earth in per-ounce terms, both cash costs and all-in sustaining costs. The latter help illuminate miners’ profitability.
That’s followed by a bunch of hard accounting data reported to securities regulators, quarterly revenues, earnings, operating cash flows, and resulting cash treasuries. Blank data fields mean companies hadn’t disclosed that particular data as of the middle of this week. The annual changes aren’t included if they would be misleading, like comparing negative numbers or data shifting from positive to negative or vice-versa.
With last quarter’s average gold price soaring 40.6% YoY to a stupendous record $3,285, gold miners’ Q2’25 results had to be awesome! The GDXJ mid-tiers certainly didn’t disappoint, achieving their best quarter in history by far. That was no flash in the pan either, as the smaller gold miners have reported exploding profits for eight consecutive quarters now! Their ongoing huge fundamental strength is unmatched.
The compositions of GDXJ and the major-dominated GDX gold-stock ETFs are similar, with much overlap in their holdings. GDXJ effectively lops off the top-ten GDX super-majors and majors, most of which are deadweight retarding sector performance. Then the weightings of everything below that are expanded. Fully 21 of GDXJ’s top 25 gold stocks are also included in GDX, with total weightings there of 21.8%!
GDXJ takes about a fifth of GDX’s upper ranks and triples those smaller gold miners’ weightings to six-tenths of its own. That makes GDXJ a way-superior gold-stock ETF. While I would never own GDX due to its large majors’ disappointing fundamental performances, GDXJ is excellent and well worth owning for anyone wanting an easy gold-stock allocation. GDXJ’s superiority becomes most evident compared to GDX.
In last week’s essay, I analyzed the GDX-top-25 majors’ Q2’25 results. They proved utterly-phenomenal, their best ever by far. But GDXJ’s are much better still, yet again underscoring the importance of heavily favoring mid-tiers in gold-stock portfolio allocations. Smaller gold miners consistently outperform their larger peers operationally and financially, which is reflected with bigger stock-price gains during gold bulls.
Last quarter the GDXJ-top-25 mid-tiers produced 2,678k ounces of gold, which plunged 19.3% YoY! That sounds terrible, but it is heavily-distorted. South Africa’s Harmony Gold Mining is one of GDXJ’s largest components. That country only requires half-year reporting, like many others around the world. HMY gives quarterly updates anyway, but not after Q2s when its fiscal years end. Those results are due in late August.
Harmony is a large major that produced 379k ounces of gold in the comparable Q2’24. Adjust that out, and the GDXJ top 25’s Q2’25 output fell a much-milder 8.8% YoY. But another big distortion was super-major Kinross Gold long being included in GDXJ, making for its largest component. KGC never belonged in this smaller-gold-miners ETF, and should’ve been exclusively in GDX. It was finally booted from GDXJ in Q3’24.
That’s a wise and long-necessary change. But the comparable Q2’24 GDXJ-top-25 production has to be adjusted by excluding both HMY and KGC, and adding in its then-26th-largest component to replace Kinross. That catapults Q2’25 GDXJ-top-25 output growth to +5.8% YoY, trouncing the GDX top 25’s also-adjusted +0.5%! Consistently growing production on balance is much easier from mid-tiers’ smaller bases.
Mid-tiers have littler stables of gold mines than majors, typically running from one to four. So any sizable expansions or new mine-builds really move the needle in overall production. That helps them not only overcome depletion, but generally grow. And investors love output growth since it provides the cashflows necessary to continue expanding existing mines and building new ones, ultimately driving stock prices higher.
Since few investors have the time and expertise necessary to follow many gold miners, big output growth reported in quarterlies often surprises even though it is well-telegraphed. Equinox Gold’s Q2 production surged 23.4% YoY, mainly because it acquired a competitor. Despite recently downgrading its 2025 guidance, EQX stock blasted 15.2% higher the next day following reporting its Q2’25 results after the close!
OceanaGold’s output last quarter grew a similar strong 21.7% YoY, with no mergers to bump it higher. Even though it also reported higher all-in sustaining costs of $2,027 per ounce, OGC’s stock soared a big 10.3% the day after results! There were many examples like this during Q2’25’s epic record earnings season, fueling big GDXJ outperformance. Gold miners report results from four-to-six weeks after quarter-ends.
During that span from late July to mid-August, GDXJ surged 11.6% higher. That was remarkable relative to gold, which actually slumped 0.4%! Gold has been consolidating high since mid-April, after it soared to crazy-overbought extremes. It’s unusual for gold stocks to rally strongly when gold isn’t, which implies professional fund investors were deploying capital after seeing gold miners’ extraordinary record results.
Unit gold-mining costs are generally inversely proportional to gold-production levels. That’s because gold mines’ total operating costs are largely fixed during pre-construction planning stages, when designed throughputs are determined for plants processing gold-bearing ores. Their nameplate capacities don’t change quarter-to-quarter, requiring similar levels of infrastructure, equipment, and employees to keep running.
So the primary variable driving quarterly gold production is the ore grades fed into these plants. Those vary widely even within individual gold deposits. Richer ores yield more ounces to spread mining’s big fixed expenses across, lowering unit costs and boosting profitability. But while fixed costs are the lion’s share of gold mining, there are also sizable variable costs. That’s where recent years’ raging inflation hit hard.
Cash costs are the classic measure of gold-mining costs, including all cash expenses necessary to mine each ounce of gold. But they are misleading as a true cost measure, excluding the big capital needed to explore for gold deposits and build mines. So cash costs are best viewed as survivability acid-test levels for smaller gold miners. They illuminate the minimum gold prices necessary to keep the mines running.
Last quarter the GDXJ top 25’s average cash costs only climbed 3.3% YoY to $1,098 per ounce! That was merely the third highest on record despite magnificent record gold prices. The smaller gold miners crushed the majors, with the GDX top 25’s Q2’25 cash costs soaring 14.5% YoY to $1,186. And GDXJ’s were even skewed high by an extreme outlier, Buenaventura’s $2,136. Without that, the rest averaged just $1,043.
All-in sustaining costs are far superior than cash costs, and were introduced by the World Gold Council in June 2013. They add on to cash costs everything else that is necessary to maintain and replenish gold-mining operations at current output tempos. AISCs give a much-better understanding of what it really costs to maintain gold mines as ongoing concerns, and reveal smaller gold miners’ true operating profitability.
The GDXJ top 25’s average AISCs last quarter climbed 8.2% YoY to $1,367. That was their second highest ever, after Q1’25’s $1,378. And it proved much better than the GDX top 25’s $1,424 in Q2’25! Back in late June several weeks before this latest earnings season got underway, I wrote a preview essay on gold miners stacking records. Then I predicted Q2 GDX-top-25 AISCs would likely shake out around $1,375.
While the GDX majors missed that for reasons explained in last week’s essay, the GDXJ mid-tiers slightly beat it. They continue to well-outperform their larger peers operationally. The average full-year-2025 midpoint AISC guidance of the GDXJ top 25 is running $1,412, while the GDX top 25’s is much worse at $1,537. The mid-tiers are earning richer-and-fatter profits during gold’s mighty cyclical bull than the majors.
Both GDXJ’s and GDX’s average AISCs last quarter were dragged down by Buenaventura’s extreme negative outlier of -$668 per ounce! This Peruvian polymetallic miner runs a primary copper mine it treats as a gold one, crediting copper as a byproduct. So in Q2’25 that mine’s gold AISCs ran -$6,618! BVN reporting super-low AISCs because of that is nothing new, its last four quarters’ ran -$578, -$680, +$708, and -$852.
Excluding BVN, the rest of the GDXJ top 25 averaged $1,487. That’s still wildly-profitable, far below these fantastic record gold prices. Yet I have to include BVN’s crazy negative AISCs in mid-tiers’ average for consistency’s sake. In the entire 37-quarter history of this research thread, I’ve never excluded any reported AISCs even though there have been plenty of ugly high-side outliers! So low ones must stay in too.
With Q2’s average gold price skyrocketing 40.6% YoY to $3,285 while the GDXJ top 25’s average AISCs merely climbed 8.2% YoY to $1,367 per ounce, mid-tiers’ profits just had to explode. The best metric for measuring sector earnings performance simply subtracts the latter from the former. These implied unit profits are cleaner than bottom-line accounting profits since they don’t include any unusual distorting items.
That lofty record $3,285 gold less mid-tiers’ $1,367 AISCs yields stellar implied unit profits last quarter of $1,918 per ounce! That skyrocketed 78.6% YoY from the comparable Q2’24’s, and was the highest gold miners ever achieved by far. This utterly shattered the previous record of $1,488 in Q1’25. The GDXJ top 25 also decisively beat the GDX top 25’s awesome-yet-smaller $1,861 implied unit profits earned in Q2’25.
Even if that was merely an isolated windfall for gold miners, it would be darned impressive. But it is just the latest in a long line of enormous earnings growth achieved by the GDXJ top 25. In the last eight quarters ending Q2’25, the mid-tiers’ implied unit earnings soared 106%, 133%, 63%, 63%, 71%, 95%, 91%, and 79% YoY! With such an unparalleled track record, investors should be flooding into mid-tiers with a vengeance.
And Q2’25 wasn’t the end of this astounding fundamental story. With this current Q3’25 about half-over, gold is averaging an even-better $3,347 quarter-to-date. That is tracking for blasting another 35% above Q3’24 levels. With the GDXJ top 25’s full-year midpoint AISC guidance averaging $1,412, Q3’s implied unit earnings are currently on the way to hit another record $1,935 per ounce! That would soar another 69% YoY.
And they could prove considerably better. Gold is in its seasonally-strong autumn-rally span, with American stock investors increasingly chasing it through differential gold-ETF-share buying. With overall implied gold portfolio allocations still under a trivial 0.3%, they have vast room to buy. Demand will surge once gold decisively breaks out of recent months’ high-consolidation trading range, with upper resistance near $3,425.
That’s merely 2.3% above midweek levels, not much of a lift with Fed rate cuts coming! And plenty of GDXJ-top-25 mid-tiers are projecting lower AISCs in the second half of 2025 due to mine expansions and mine-builds ramping up. So despite their higher average AISC guidance, it wouldn’t surprise me at all to see stable or even lower AISCs in these next couple quarters. That would further boost implied unit profits.
While operational performances including production and mining costs are more important for gold miners’ growth profiles, fund investors are way more likely to focus on hard financial results. Extensive histories of these are available from data providers in stock screens, highlighting earnings-growth trajectories and upside surprises. The GDXJ top 25’s hard accounting results also proved spectacular records in Q2’25.
Overall revenues soared 41.3% YoY to $10,923m, just shy of Q4’24’s $11,193m record. But that’s not comparable, since the latter included Harmony Gold while Q2’25 doesn’t. Neither did Q2’24, which also had super-major Kinross Gold thrown in. So it is remarkable to see skewed-low sales growth of 41%. Individual mid-tiers’ revenues mostly surged way higher, as the sales column in the table above reveals.
The GDXJ top 25’s bottom-line accounting earnings skyrocketed a magnificent 212.4% YoY to a record-shattering $2,599m last quarter! That once again trounced the GDX top 25’s amazing-but-smaller 144% growth. And the mid-tiers’ earnings growth is understated, as in the comparable Q2’24 KGC reported some of their biggest earnings as the lone super-major leading this ETF then. Gold-mining profits are epic.
Before I founded my financial-newsletter business a quarter-century ago, I was a CPA mostly auditing mining companies. I’ve maintained that CPA license in active status ever since. So I comb through the gold miners’ quarterly reports with auditors’ eyes, looking for anything unusual and taking notes on finds. Of particular interest is big noncash losses or gains flushed through income statements distorting comparisons.
The GDXJ top 25’s bottom-line earnings were exceptionally-clean last quarter, with few such items which weren’t very big. Yet in the comparable Q2’24, Equinox Gold ran a colossal $470m gain through its net income. That was triggered because it bought the remaining stake in its newest gold mine, providing a revaluation for its existing stake. If that is adjusted out of Q2’24, the mid-tiers’ earnings growth is much bigger.
The GDXJ top 25’s cash flows generated from operations also soared 73.0% YoY to a record $4,576m. And that’s unadjusted, not accounting for Kinross being in a year ago. OCFs are crucial to finance mine expansions and mine-builds, driving future production and corporate growth. That helped catapult cash treasuries up 61.6% YoY to another record $12,376m. The mid-tier gold miners’ fundamentals are phenomenal.
They are earning money hand-over-fist with these record prevailing gold prices, further boosted by their excellent mining-cost control. Their coffers are overflowing with cash which will mostly be used to keep on growing. And most startling of all, plenty are still trading at super-cheap trailing-twelve-month price-to-earnings ratios in the single-digits or teens! Smaller gold miners anomalously remain outstanding bargains.
So if you aren’t yet sufficiently deployed, there are huge gains still to be had before more investors figure this out. Our newsletter trading books are full of fundamentally-superior mid-tiers and juniors with big upside potential in coming months. Again with gold’s mighty cyclical bull powering 89% higher so far, GDXJ ought to leverage that 3x to 4x soaring 266% to 354%! Yet it has merely climbed 140% bull-to-date.
Successful trading demands always staying informed on markets, to understand opportunities as they arise. We can help! For decades we’ve published popular weekly and monthly newsletters focused on contrarian speculation and investment. They draw on my vast experience, knowledge, wisdom, and ongoing research to explain what’s going on in the markets, why, and how to trade them with specific stocks.
Our holistic integrated contrarian approach has proven very successful, and you can reap the benefits for only $10 an issue. We extensively research gold and silver miners to find cheap fundamentally-superior mid-tiers and juniors with outsized upside potential. Sign up for free e-mail notifications when we publish new content. Even better, subscribe today to our acclaimed newsletters and start growing smarter and richer!
The bottom line is smaller mid-tier and junior gold miners just reported their best quarter in history by far. They largely held the line on mining costs, which actually proved lower than the majors’. Combined with record gold prices, that fueled smaller gold miners’ richest-and-fattest earnings ever witnessed. Implied unit profits have now skyrocketed with mostly-high-double-digit annual gains for an epic eight quarters in a row!
This unparalleled hyper-bullish streak will persist in this current half-over quarter, which is on track to achieve another big record. The fundamentally-superior smaller gold miners are earning money hand-over-fist, yet their stock prices are still languishing. Thus a massive mean-reversion higher is overdue and inevitable. Mid-tier and junior gold stocks still have to multiply from here to reflect prevailing gold levels.
********
share
share
share
share
share


