Stagflationary Signs and the Precious Metals Sector


Both employment and inflation numbers were worse than expected. Stagflation approaches. Or is it already here?
With 263k of initial jobless claims (the highest number in two years!) and MoM CPI at 0.4% instead of the expected 0.3%, the market doesn’t know what to focus on. The USD Index is moving back and forth today, and other markets seem to be simply perplexed.
Gold Shines in Stagflation—But Not Always
Stagflation is generally positive for gold – that’s what we had during the great bull market of the 1970s. BUT, it’s also true that gold declined profoundly in the middle of that bull market – in 1976. Silver price declined as well. The stagflationary environment didn’t prevent this multi-month decline. And the same is likely to take place this time, as the situation in gold and mining stocks is beyond being excessive.
Starting with the latter, the GDXJ just moved above its late-2012 high, and it touched a combination of extremely important resistance levels.
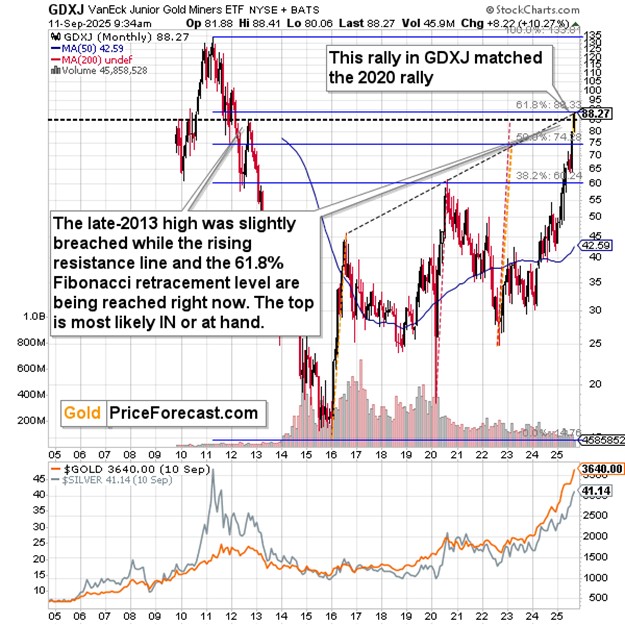
The rising resistance line is based on the 2016 and 2020 tops, and the 61.8% Fibonacci retracement level (the most classic one of them all) is based on the 2011 – 2016 decline.
Yes, despite the fact that gold pretty much doubled its price, the GDXJ is not back at its 2011 high – it’s only up 61.8% of what it had declined between 2011 and 2016.
This rally is also as big as the previously biggest rallies have been, making it even more likely that it’s ending.
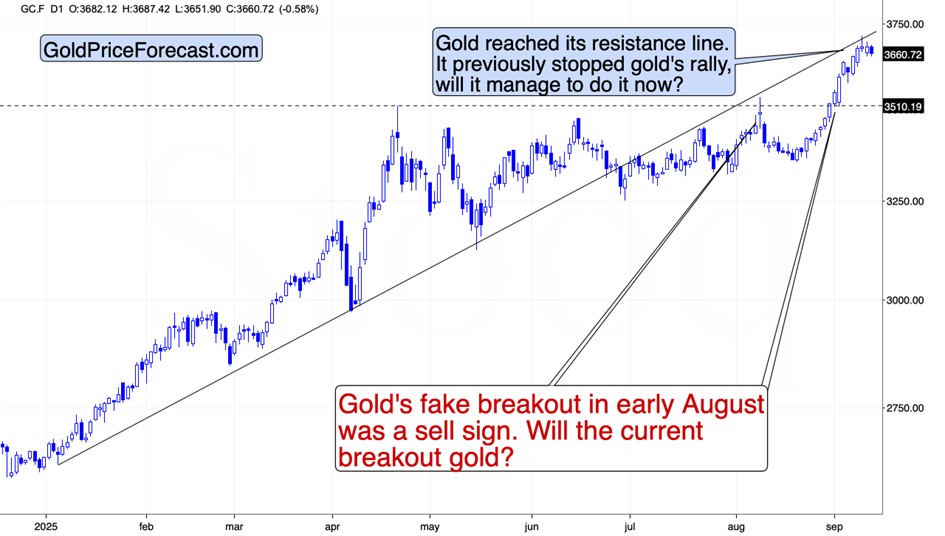
Gold Rally Falters at Resistance Line
Gold is down after topping at its rising resistance line. Perhaps that was THE final top for this rally.
We’ll know soon, because the key precious metals are now at their rising short-term support line.
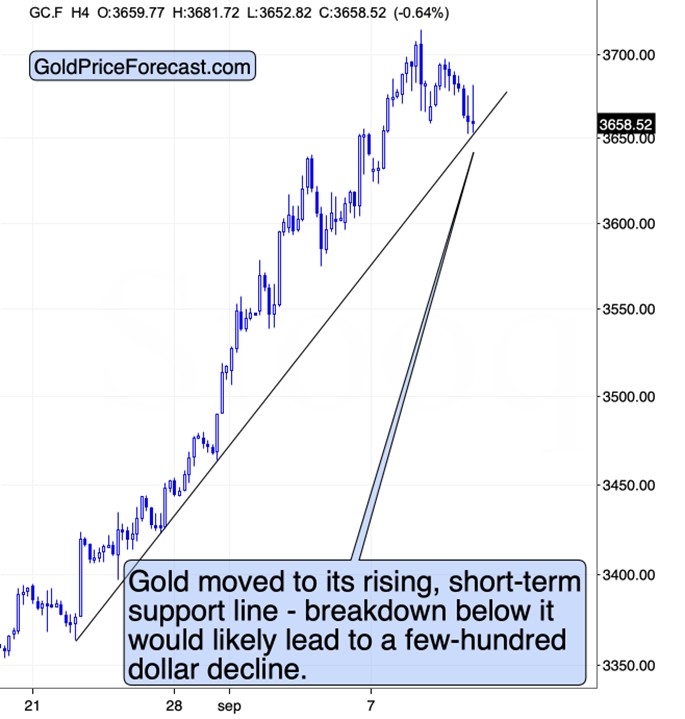
The line is very steep and once we see a breakdown here, gold is likely to drop fast and quite far.
The greed pushed gold higher fast, but let’s keep in mind that fear is a stronger emotion and declines can – and tend to be – even faster. Consequently, once gold confirms its breakdown below the support line (currently at $3,650), we can see powerful declines, to $3,500 and then lower.
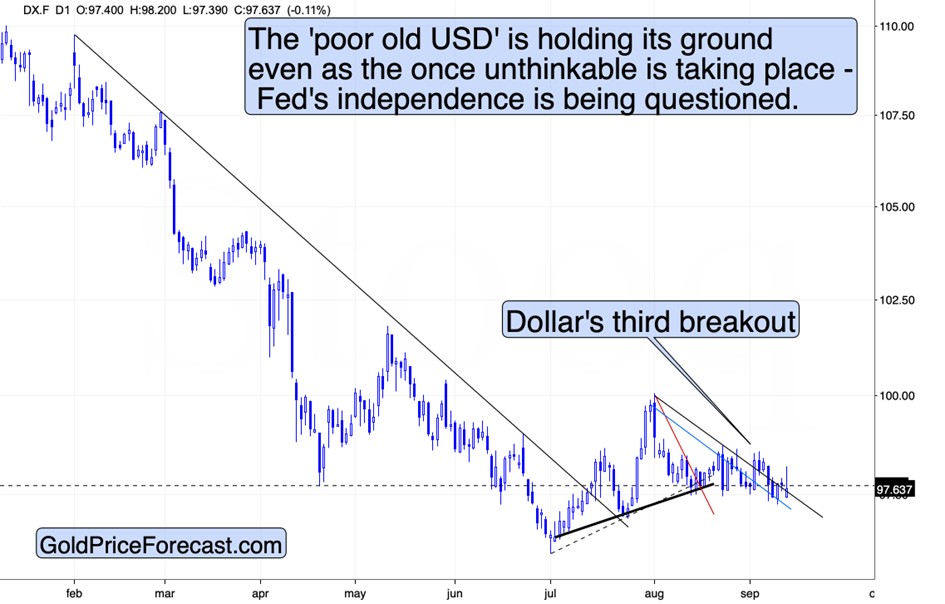
As I wrote earlier today, the USD Index is moving back and for today. This means that my previous comments on the above chart remain up-to-date:
It’s trading in the same tight trading range as before, but the move up is noteworthy, as it took the USDX back above the April low and the upper of the declining support lines. The lower line simply held, and the move below the upper one was just invalidated.
The USD Index is ready to rally. When will that rally finally launch? Nobody can tell with certainty. Perhaps it will be the interest rate decision that triggers the rally even if it’s a widely-expected cut. After all, markets tend to move on rumor (they already did) and then reverse based on the actual event. In the USD Index’s case, it could be the case that it simply refused to decline further based on the rate cut semi-announcement – thus showing strength.
However, given the current bullish setup, I wouldn’t be surprised to see a rally in the USD Index even before the rate cut. This, of course, would likely trigger declines in precious metals and mining stocks.
Thank you for reading today’s analysis – I appreciate that you took the time to dig deeper and that you read the entire piece. If you’d like to get more (and extra details not available to 99% investors), I invite you to stay updated with our free analyses - sign up for our free gold newsletter now.
*********
 Przemyslaw Radomski, CFA, is the founder, owner and the main editor of SunshineProfits.com. You can reach Przemyslaw at: http://www.sunshineprofits.com/help/contact-us/.


