Merry Metals!


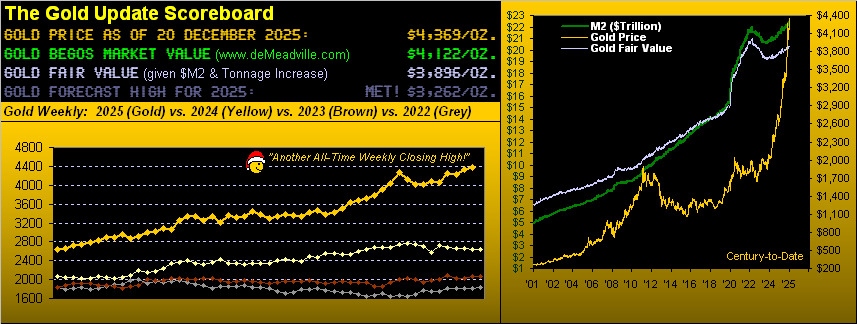
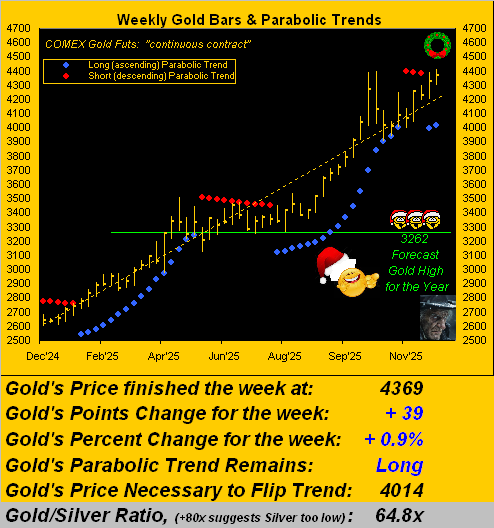
Merry metals, indeed! En route to finishing the final full trading week of 2025, both Gold and Silver made fresh All-Time Highs! “Surprise, surprise, surprise!” –[G. Pyle, ’64-’69]. Toward the week’s respective settles:
- Gold on Thursday traded to as high as 4410 in closing Friday at 4369, +66% year-to-date;
- Silver yesterday (Friday) traded to as high as 67.68 in closing at 67.40, +130% year-to-date.
“And how about from 2001, mmb?”
Squire we “ought” save that stat for our year-end edition still two missives hence. However, as does Hollywood, let’s tease it. So century-to-date:
- Gold is presently +1,496%;
- Silver is +1,352%;
- and the S&P 500 (ex-dividend) is +418%.
Funny how the FinMedia focuses on the latter (i.e. the least-gainer) of those three; but precious metals investing is too boring for the followers of FinMedia to generate enough lifeblood (advertising revenue). “Well ya know, uh Bud, these stocks are gonna like, uh, triple between now and the close…”
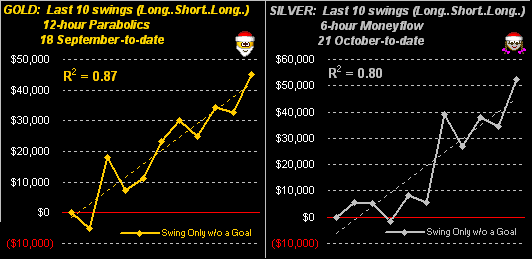
As to the year’s final two “shortened” weeks, there remain just 7½ trading days within the holiday haze, risking one’s becoming lost in the merry markets’ maze. Bearing in mind that “trend trumps hype”, our best Market Rhythm on a pure swing basis for Gold is currently the 12-hour Parabolics, whilst for Silver ’tis the six-hour Moneyflow. Here — with the benefit of hindsight — are the cumulative results of the last 10 pure swings for both metals, (basis one futures contract, for which a one-point move in Gold is +/- $100 and that for Silver is +/- $5,000 … “past performance not guaranteeing ‘futures’ results, right mmb?” Never, Squire:
Still, from the “Means Reversion Dept.”, Gold (4369) by the opening Scoreboard is +12% above Fair Value (3896), vis-à-vis the regression of Gold’s price to the U.S. “M2” Money Supply, duly incorporating the increase in the yellow metal’s tonnage, (which for those of your scoring at home is today some 218k tonnes, having doubled since April 1986).
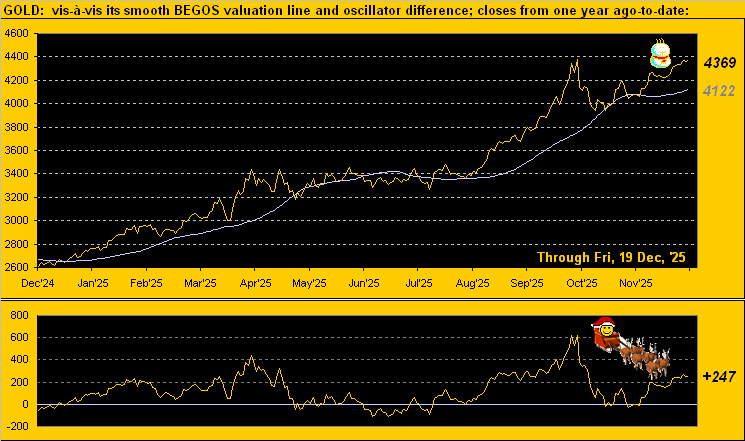
Too, by our measure of BEGOS Markets Value, per the pricing of the yellow metal by its movement relative to those of the five primary BEGOS Markets (Bond, Euro, Gold, Oil and S&P 500), at 4369 ’tis +247 points (+6%) “high” above its smooth valuation line (4122) as below depicted:
As for Sister Silver (herself not a primary BEGOS component for a Market Value calculation), she nonetheless today at 67.40 is +20% above her Fair Value of 56.13. So as merry as are our metals, corrections will occur; do try not to get carried away.
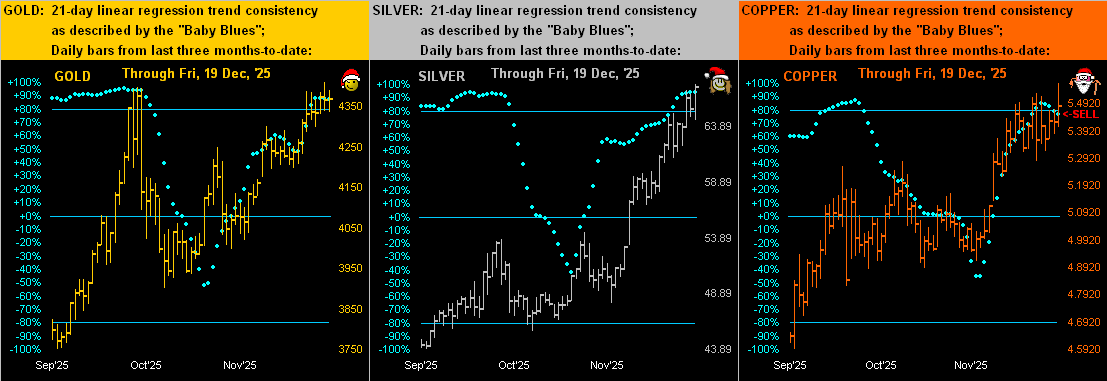
For as we next turn to the metals’ Market Trends for the last three-months to date featuring Gold on the left and Silver at center, we’ve also included Copper on the right. As you well know, Cousin Copper does influence Sister Silver such that she’ll on occasion shed her precious metal pinstripes for her industrial metal jacket. And by Copper’s baby blue dots of regression trend consistency, note the word “SELL” pointing at the rightmost “Baby Blue” having just slipped below its key +80% axis. How has such Copper “SELL” previously affected Silver? From a year ago-to-date there’ve been four like Copper “SELL” signals, then finding Silver within the ensuing 21 trading days (one month) respectively dropping by as much as: -21.3%, -5.5%, -0.4% (“whew”), and -14.8%. Just something of which to be aware. Here’s the graphic, (minding, too, the “Baby Blues” of the precious two):
‘Course, the mainstay graphic of The Gold Update is price’s weekly bars and parabolic trends from one year ago-to-date. And as we rhymingly reprise, the picture looks great! The fresh parabolic Long trend is now two weeks in duration with a net price gain of +3.3%. As for old lurking Ebenezer, we told him away back in 1843 when priced at $20.67/oz. that “Shorting Gold is a bad idea”, (it having since risen 21,037%):
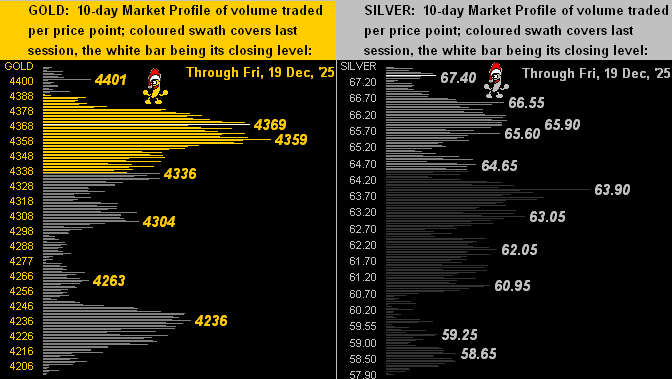
Next to our 10-day Market Profiles for Gold (below left) and for Silver (below right). With such an array of underlying support levels, ’tis truly a Santa Bananarama, which is  “Really Saying Something … bop-bop shoobie do-wah” –[’82]:
Toward the week’s wrap we’ve the economy (or lack thereof) on tap. Per the next graphic, there still in arrears are 40 “shutdown” metrics which haven’t arrived, (of which some shan’t ever do). And whilst November’s inflation at the retail level (Consumer Price Index) was again recorded at a +0.2% monthly clip, the Philly Fed Index took a hit in recording its fifth negative month in the last seven. Moreover, the Baro has been beleaguered throughout December per those metrics made available:
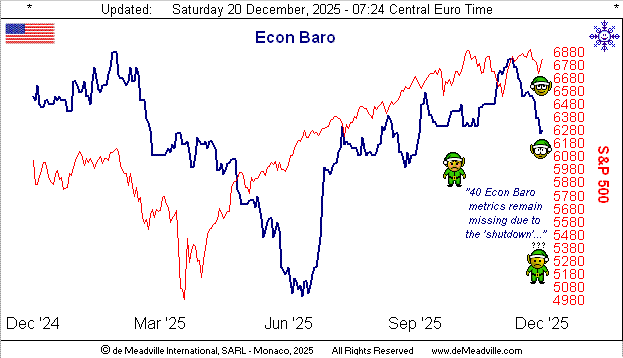
Yet despite the Baro’s woes, the S&P 500 still seeks a Santa Claus rally, the Mighty Index now down just -14 points from November’s settle. We’ve recently pointed out that for the 24 completed Decembers thus far this century, 16 have been up, (which for you WestPalmBeachers down there means eight have been down).
Regardless, the FinMedia is “freaking out” (technical term). This past week brought two items of note from the children’s writing pool at the once highly-respected Barron’s. To wit:
—> (Tuesday) “Stock Markets Are Suffering Amid Bubble Fears” … “Suffering”? The S&P settled Tuesday a scant -1.5% below its all-time closing high. Now ’tis but -1.0%. But wait, it gets funnier:
—> (Friday) “The Stock Market Has a 10% Chance of a 30% Crash in 2026” … Since when did a 30% correction be deemed a “Crash”? More accurately, we’d opine — by employing the lost art of proper portfolio theory in concert with the S&P’s “live” price/earnings ratio of now 55.8x — that “The Stock Market Has a 100% Chance of a 50% Crash in 2026” … (write it down).
Rightly or wrongly either way, here’s the Gold Stack for Santa’s sleigh sack:
The Gold Stack (continuous contract pricing):
Gold’s All-Time Intra-Day High: 4410 (18 December 2025)
2025’s High: 4410 (18 December 2025)
10-Session directional range: up to 4410 (from 4199) = +211 points or +5.0%
Trading Resistance: Per the Profile 4410
Gold’s All-Time Closing High: 4374 (20 October 2025)
Gold Currently: 4369, (expected daily trading range [“EDTR”]: 66 points)
Trading Support: Profile notables 4369 / 4359 / 4336 / 4304 / 4263 / 4236
10-Session “volume-weighted” average price magnet: 4313
The Weekly Parabolic Price to flip Short: 4014
Gold’s Fair Value per Dollar Debasement, (from our opening “Scoreboard”): 3896
The 300-Day Moving Average: 3295 and rising
2025’s Low: 2625 (06 January)
The 2000’s Triple-Top: 2089 (07 Aug ’20); 2079 (08 Mar’22); 2085 (04 May ’23)
The Gateway to 2000: 1900+
The Final Frontier: 1800-1900
The Northern Front: 1800-1750
On Maneuvers: 1750-1579
The Floor: 1579-1466
Le Sous-sol: Sub-1466
The Support Shelf: 1454-1434
Base Camp: 1377
The 1360s Double-Top: 1369 in Apr ’18 preceded by 1362 in Sep ’17
Neverland: The Whiny 1290s
The Box: 1280-1240
Et voilà:

A Most Merry Metals’ Christmas to Everyone Everywhere!
…m…
www.TheGoldUpdate.com
www.deMeadville.com
and now on “X”: @deMeadvillePro
********

Mark Mead Baillie has had an extensive business career beginning in banking and financial services for two years with Banque Nationale de Paris to corporate research for three years at Barclays Bank and then for six years as an analyst and corporate lender with Société Générale.
For the last 22 years he has expanded his financial expertise by creating his own financial services company, de Meadville International, which comprehensively follows his BEGOS complex of markets (Bond/Euro/Gold/Oil/S&P) and the trading of the futures therein. He is recognized within the financial community of demonstrating creative technical skills that surpass industry standards toward making highly informed market assessments and his work is featured in Merrill Lynch Wealth Management client presentations. He has adapted such skills into becoming the popular author each week of the prolific “The Gold Update” and is known in the financial website community as “mmb” and “deMeadville”.
Mr. Baillie holds a BS in Business from the University of Southern California and an MBA in Finance from Golden Gate University.


