Gold Forecast: Terminal Point to Current Rally Drawing Near


 From the comments made in past months, Gold's larger rally phase was projected to hold up into February of this year, which favored each of the in-between corrections to end up as countertrend. With that, we are moving into the range where a key peak is expected to form in the Gold market, and with the U.S. stock market also setting up for a mid-term top, coming later this Spring.
First, a look at the Gold market.
Gold's 10-Day Cycle
For the short-term picture, our smallest-tracked wave in the Gold market is the 10-day cycle, which is shown on the chart below:
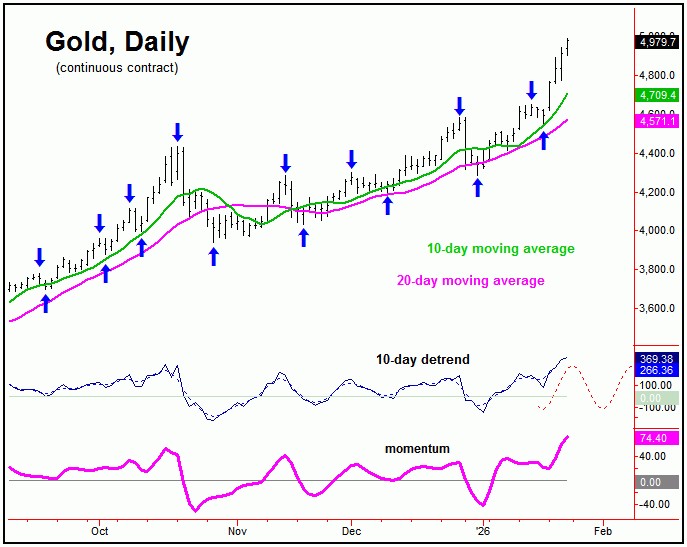
From my 1/11/26 article: "the current upward phase of this 10-day wave is now 6 trading days along, and with that is back into topping range. Having said that, It is too early to confirm a new downside 'reversal point' for this wave, though one should ideally materialize in the next trading day or two, depending on the action."
As mentioned above, our 10-day wave was in topping range, with the last peak for this wave made just a few days after my last article, coming in with the 1/14/26 tag of 4650.50 (February, 2026 contract). In terms of price, we identified the downside 'reversal point' for this wave as being the 4573.10 figure, which was taken out on 1/16/26, and with that quickly targeted a drop back to the 10-day moving average - met on the very same day.
Going further, due to the position of the larger 72-day cycle, that correction with the 10-day wave was expected to be a countertrend affair, with support at the 10 and 20-day moving averages - which did hold. With that, a 5% rally was projected for the following swing up, noted in advance in our Gold Wave Trader report - and which has easily been met with the firm push back to new all-time highs.
With the above said and noted, our 10-day wave is now 4 trading days along, with the average rallies having taken some 4-7 trading days before topping. With that, the next short-term peak - and correction - should come from this cycle, which is next projected to trough into early-February, plus or minus. As before, this decline phase is anticipated to end up as another countertrend affair.
Gold's 34-Day Cycle
Above the 10-day wave, there is the 34-day cycle for Gold, which last bottomed back in late-December. From there, its current upward phase has been projected higher into early-to-mid February.
Here again is that 34-day cycle in the Gold market:
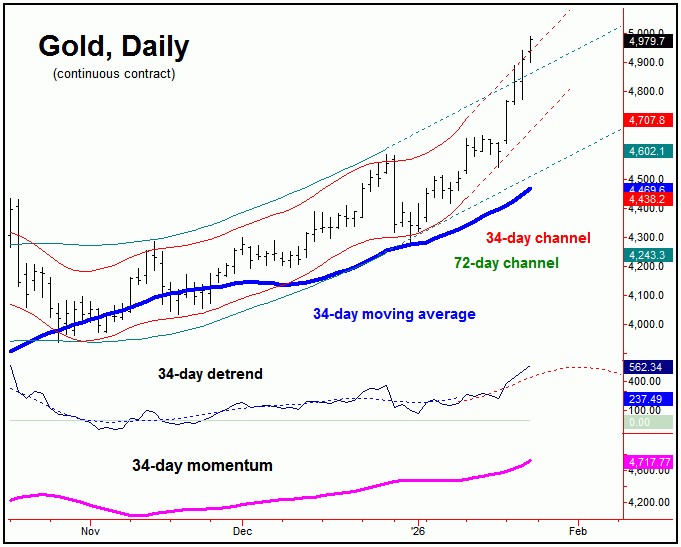
From my 1/11/26 article: "the (last) correction with this 34-day wave was anticipated to end up as countertrend, with support noted at the aforementioned lower 72-day channel. With that, a countertrend correction with this 34-day cycle has been favored to give way to a push back to higher highs into February (potential 4700), before setting up a slightly more significant peak, coming from our bigger 72-day wave."
As mentioned above, support to the last correction phase of our 34-day cycle was at the 34-day moving average, which was also at or near the lower 72-day cycle channel. That support was tested - and held that decline - a move which was expected to end up as countertrend, to be followed by higher highs into February.
In terms of price, there was the potential for a push up to the 4700's or better on the current upward phase of this wave, which has obviously been well-exceeded. Of key note is that we are now above the extrapolated upper 34 and 72-day cycle channels, which is a short-term 'blow-off' condition.
Adding to the notes above, as per the decline seen into late-December of last year, short-term 'blow-off' moves are often followed by sharp price corrections - even if they end up as countertrend moves. The 34-day moving average could again act as a magnet to that decline, though it should begin from higher numbers than already seen, forming on or past early-to-mid February.
Gold's 72-Day Cycle
Above the 34-day wave, there is the 72-day cycle for Gold - which last bottomed back in the Autumn of last year, and which has been projected higher into early-to-mid February.
Shown again below is that 72-day cycle:
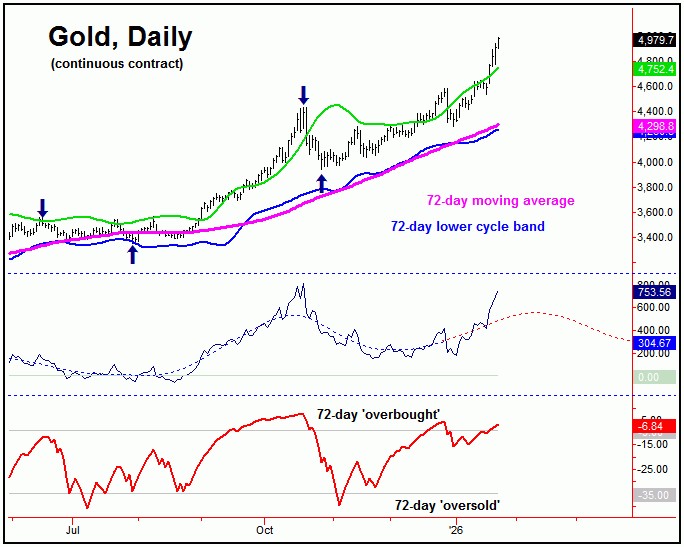
As mentioned above, the current upward phase of our 72-day cycle was projected to remain intact into early-to-mid February, where it should eventually top. Once this cycle peaks, the ideal path will favor a decent correction playing into mid-March, plus or minus. As noted earlier, that correction should take Gold back to its 34-day moving average, at minimum, though does have the potential to drop back to the 72-day moving average and the lower 72-day cycle band, each of which are well below current prices.
In terms of price, we now have a downside 'reversal point' for this 72-day cycle, which - when taken out - will be the strongest signal this wave has topped, and with exact details noted in our thrice-weekly Gold Wave Trader market report.
U.S. Stocks Projecting Mid-Term Top this Spring
As mentioned in past articles, the last mid-term low in U.S. stocks came from our 360-day time cycle, which bottomed back in April of last year.
Here again is this 360-day cycle on the SPX:
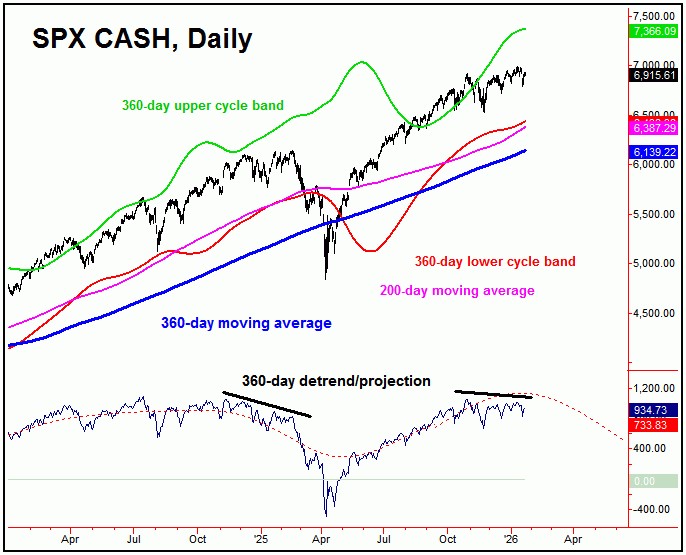
As mentioned many times in my past articles, this 360-day wave on the SPX was seen as pushing higher into the Spring of this year. In terms of price, there is the potential for a push up to the 7300-7500 SPX CASH region into this timeframe.
In terms of time, there is key focus on early-Spring, to top this 360-day cycle in U.S. stocks. Once this peak is in place, the probabilities will favor a sharp decline of some 17-30% playing out into the Autumn of this year, before setting up the next larger-degree low. What follows should be an even-larger percentage rally of some 40-50% or more, into the late-2027 to Spring of 2028 window. Stay tuned.
Jim Curry
The Gold Wave Trader
Market Turns Advisory
http://goldwavetrader.com/
http://cyclewave.homestead.com/
********
More from Gold-Eagle


