When GREED turns to FEAR...


It had to happen – the PM sector was so incredibly overbought that a heavy correction was inevitable. We saw this coming which was why a warning to lighten up on silver stocks was issued on Tuesday. Even so, the drop this morning is of stunning magnitude, with gold down a collosal $367 at the time of writing and silver down a massive $18.
The market gave subtle signals all week that such a drop was looming as we will now proceed to see on the charts.
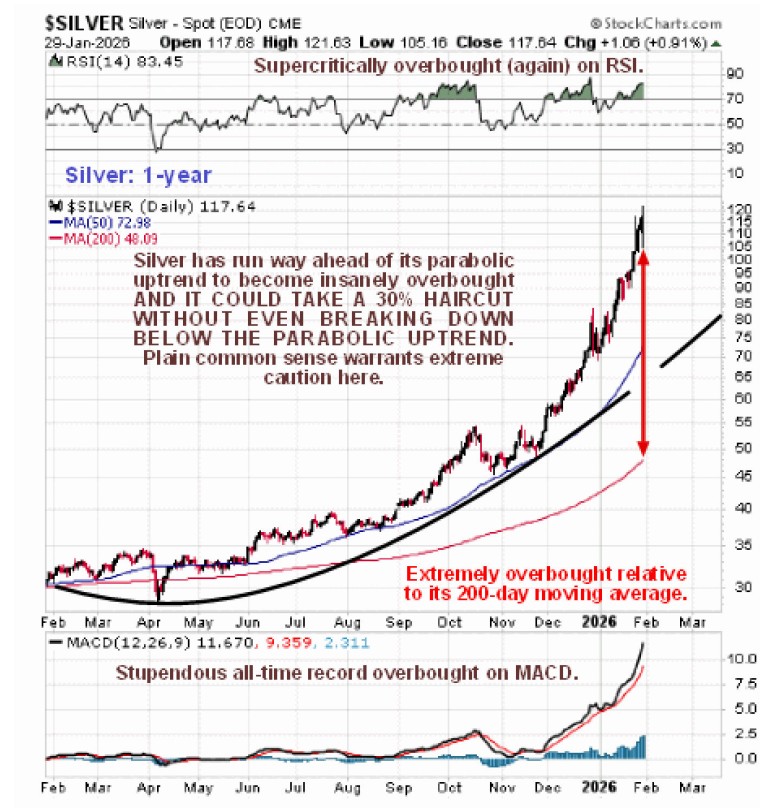
On silver’s 1-year chart we can see that it had run way ahead of its parabolic uptrend to becoming insanely overbought. This is a very useful chart for it enables us to see that it could take about a 30% haircut without breaching its parabolic uptrend. This chart also gives us a target for the correction which is the parabolic uptrend itself, currently at about $65 and rising with the severity of the drop this morning indiicating a higher probability that it will get there, albeit that by the time it does it will be at a higher level, perhaps at about $70 - $75.
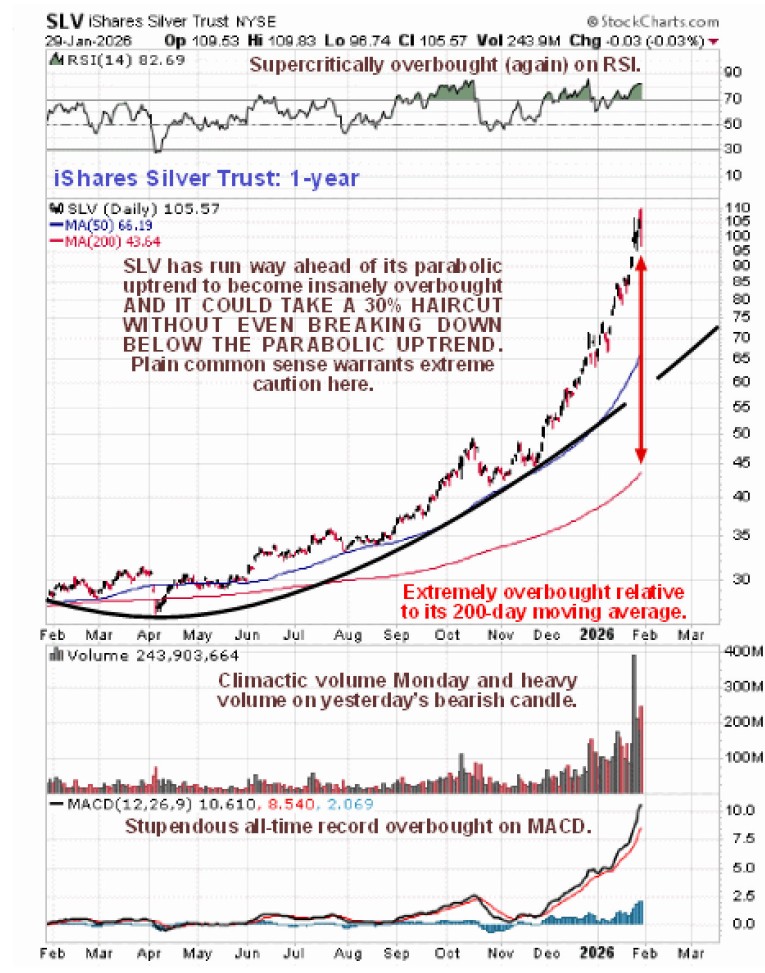
The chart for silver proxy SLV, also for 1-year, is useful as it shows volume and thus enables us to see the climactic top volume last Monday which was a reason for the warning being issued on Tuesday. …
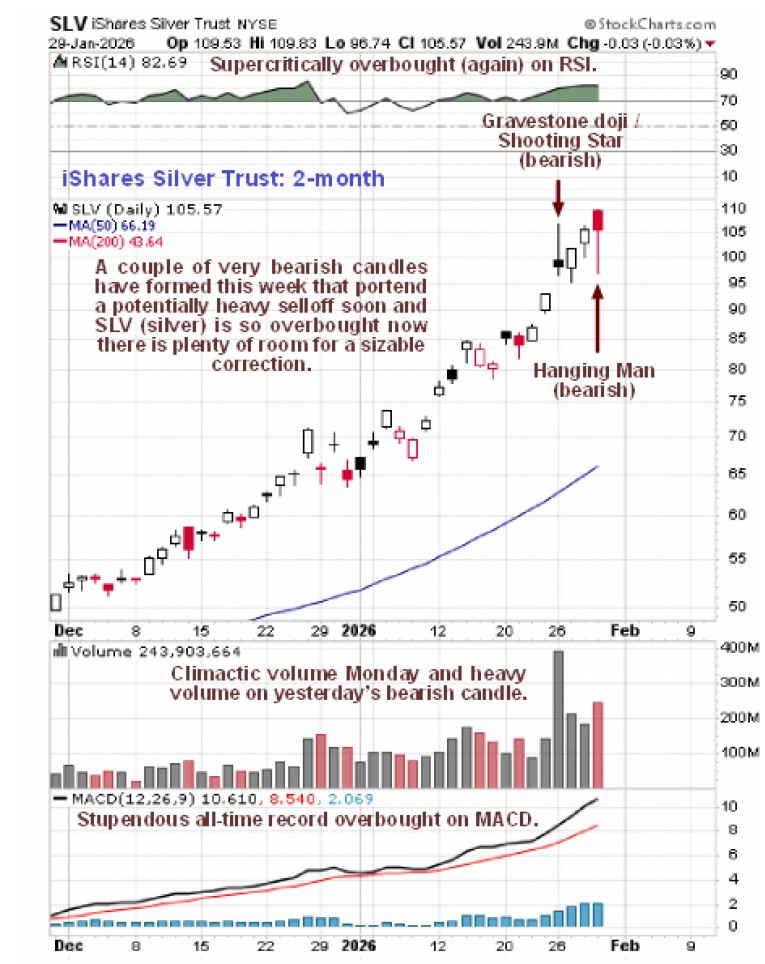
We’ll now look at the action this week in detail on a 2-month chart for SLV because it enables us to see the subtle warnngs that the market was flashing that it was in the process of topping out. The most important warning it gave was the prominent very bearish “Gravestone Doji / Shooting Star” candle that formed on high volume on Monday where the open and close price are close together near to the day’s low with a quite large daily range. This shows that the bulls have “dropped the ball” and bears are taking control. It then very deceptively made a new intraday high yesterday before ending with a very bearish “hanging man” candle – another severe warning.
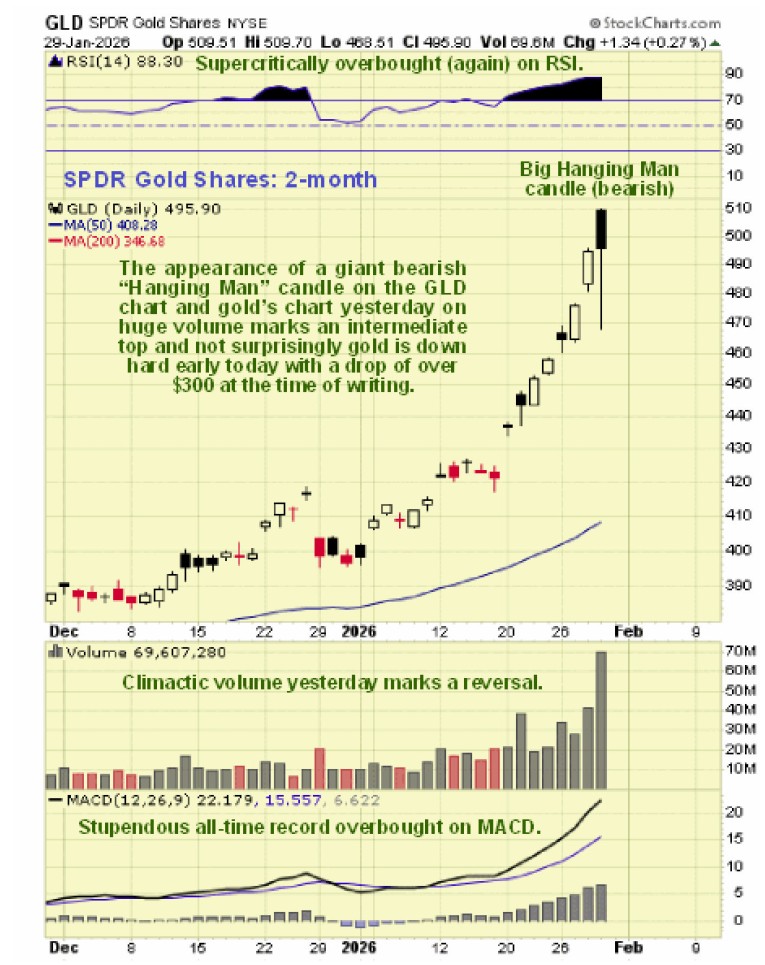
Meanwhile, gold proxy GLD put in a gigantic wide range “Hanging Man” candle yesterday on huge volume as we can see on its 2-month chart below, thus confirming the solidifying bearish picture emerging in silver. Hence the crushing drop in gold this morning after its near vertical runup this month.
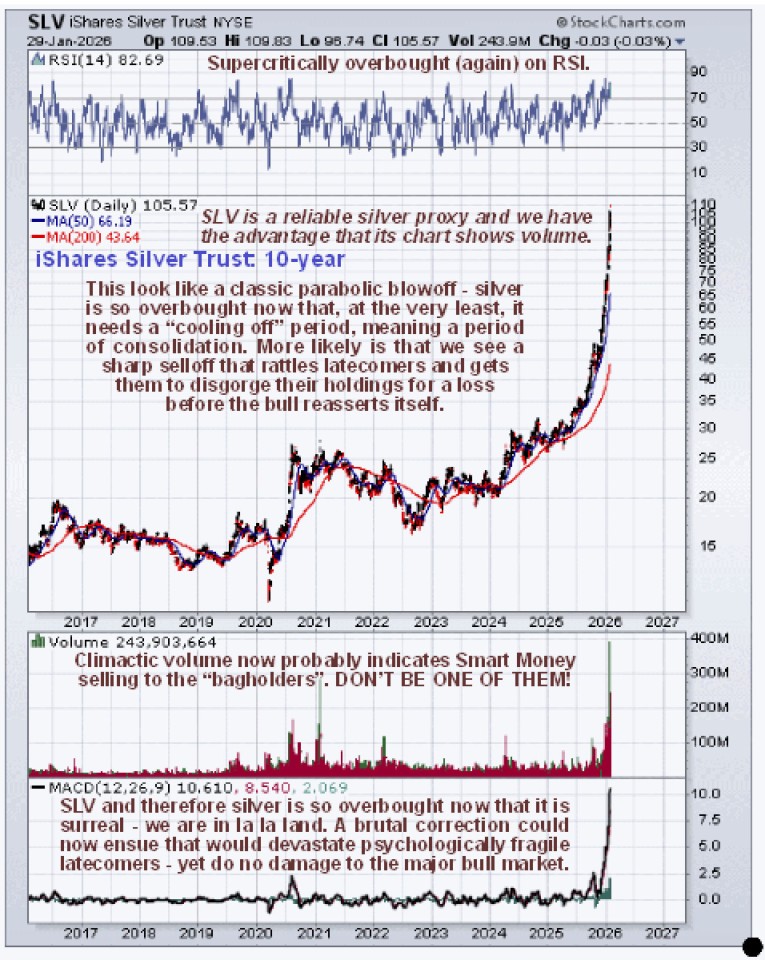
Lastly, in looking at the 10-year chart for SLV we must ask ourselves just how much more overbought we could expect it (and therefore silver) to get? – it was so overbought it was surreal. Small wonder then that a brutal correction has started. Bear in mind that these charts were made last night and so the commentary on this chart is already a little out of date given what has happened overnight.
After the severity of this morning’s drop we are likely to see some sort of bounce which may be used to lighten positions as this correction probably has some way to run - as mentioned above a likely target for silver and SLV is the parabola boundaries on their respective 1-year charts. Silver, which astrologically is ruled by the moon, often makes intermediate trend changes around new and full moons and we have a full moon this Sunday. This is not hokus-pokus, it is a matter of statistical fact, and a similar correlation exists between cocoa prices and the cycles of Venus.
********

Clive P. Maund’s interest in markets started when, as an aimless youth searching for direction in his mid-20’s, he inherited some money. Unfortunately it was not enough to live a utopian lifestyle as a playboy or retire very young. Therefore on the advice of his brother, he bought a load of British Petroleum stock, which promptly went up 20% in the space of a few weeks. Clive sold them at the top…which really fired his imagination. The prospect of being able to buy securities and sell them later at a higher price, and make money for doing little or no work was most attractive – and so the quest began, especially as he had been further stoked up by watching from the sidelines with a mixture of fascination and envy as fortunes were made in the roaring gold and silver bull market of the late 70’s.
Clive furthered his education in Technical Analysis or charting by ordering various good books from the US and by applying what he learned at work on an everyday basis. He also obtained the UK Society of Technical Analysts’ Diploma.
The years following 2005 saw the boom phase of the Gold and Silver bull market, until they peaked in late 2011. While there is ongoing debate about whether that was the final high, it is not believed to be because of the continuing global debasement of fiat currency. The bear market since 2011 is viewed as being very similar to the 2-year reaction in the mid-70’s, which was preceded by a powerful advance and was followed by a gigantic parabolic price ramp. Moreover, Precious Metals should come back into their own when the various asset bubbles elsewhere burst, which looks set to happen anytime soon.
Visit Clive at his website: CliveMaund.com


