$1100 Gold Price Here We Come…But What’s The Cause?


Gold continues its bearish trend - and everyone wants to know what is causing it to go lower. Well, you wouldn’t find the cause here as I will be the first to confess that I don’t have a clue what is causing the decline. I don’t think that anyone REALLY knows why the decline. However, there’s no doubt that some may have a clue. Speculating on a clue, however, is very risky. Here, I prefer to assess the daily price (and sometimes volume) action and take it from there.
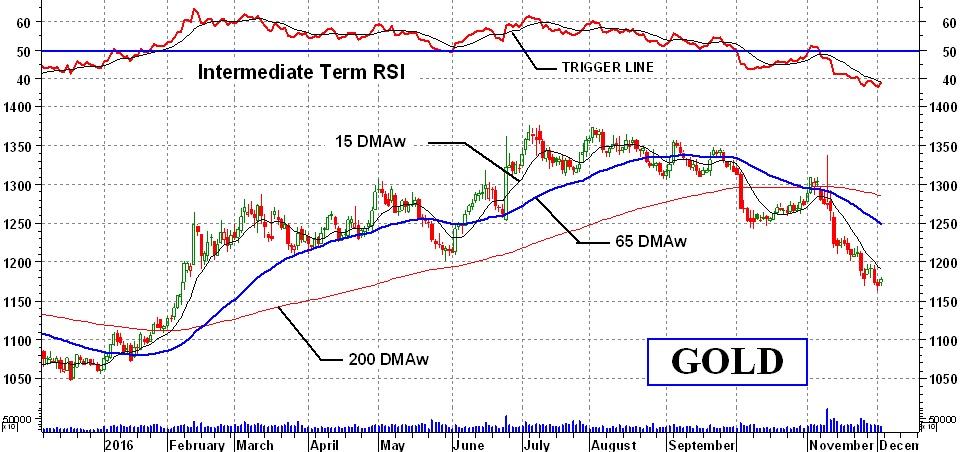
The gold action over the past few of weeks has been mostly to the down side. It has now broken below that $1200 support level and is headed towards the next support, which would be at the $1100 level, or somewhere close to there. Who can be precise? The downside momentum is the worst it has been for over a year now and nothing in the chart says a turnaround is eminent. The short term technical picture could change quite quickly but the intermediate and long term takes a while so sit back and relax until things get straightened out (that is hoping you are not still holding stock or on the long side in the commodity and biting your nails in despair).
Long-Term Gold Price
The last time period to change, now that it is bearish we should not expect this time period to change overnight back to bullish. Gold price remains below its long-term moving average line and the line slope continues downward. The long term momentum indicator is in its negative zone and below a negative sloping trigger line. All in all, the long term rating remains BEARISH. There is nothing in the chart to indicate an imminent reversal of this long term rating.
Intermediate-Term Gold Price
The intermediate-term prognosis isn’t any better than the long-term. Gold continues in its plunge far below the intermediate-term moving average line and the line slope continues to point downward. The intermediate-term momentum indicator continues in its negative zone and below its negative sloping trigger line. The rating remains BEARISH.
If one were trying to grasp at straws one might see a very slight strengthening in the momentum versus the price action. It would take very little additional positive momentum move to get above its trigger line but that’s about it for now. Confirming the bearish rating is the fact that the short-term moving average line remains far below the intermediate-term line and not expected to move above the intermediate-term line very soon.
A final sticking point is the action of volume recently. As the chart suggests, volume has increased substantially since the start of the latest negative trend, i.e. since the beginning of Nov. This increase in volume activity along with the decrease in gold price is not a good sign at all. It suggests that a lot of money is getting the hell out of gold for one reason or another. Although this might be looked at as future money available for gold purchase I would be inclined to wait and see that happening rather than assume it will happen.
Short-Term Gold Price
Any potential of a reversal should be seen here in the short-term first. Pushing the point we just might see some encouraging signs in the short-term indicators but they have not yet been developed to the point of actually giving us a sign. They are mostly from the standpoint of starting development towards some positive indication. As it stands at the close on Friday, gold remains below its sharply downward sloping short-term moving average line. The short-term momentum indicator remains in its negative zone but has moved above its trigger line, although the trigger is still slightly pointing downward. The short-term rating remains BEARISH.
Now for some positive short term signs. These are primarily in the actions of the short-term momentum (or strength) of the very recent price activity. The momentum did not reach a new low on Thursday when the price did, versus the price/momentum the previous Friday. This may be seen as a very short-term positive divergence. In addition, although Friday’s close is still some distance away from the weekly high price the momentum closed on Friday above its weekly high point. Finally, the short-term momentum has been in its oversold zone and now appears on the verge of breaking above that oversold line. If so this would be a good indication of a rally in progress. It would probably take only a small price rise to achieve that.
Gold And Silver Stocks
Well for once it’s been a very good week for gold and especially silver stocks. Here is the summary for the week.

One good week does not make a recovery. Except for those who like to take long shot gambles, it is not yet the time to be jumping back into the market. The time will come with good potential gains (we all hope) for those who wait.
Merv’s Gold AND Silver 100 Index
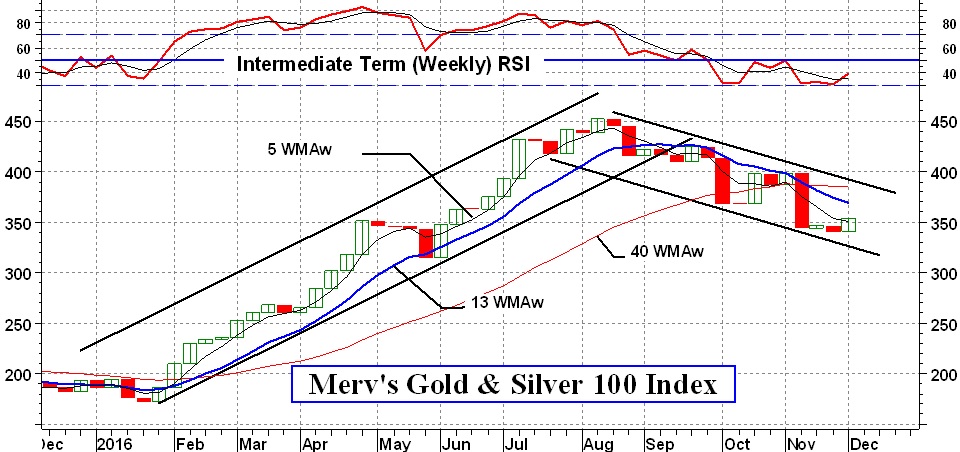
Despite the good week in stocks the Index does not yet show any real encouragement to get back on the bandwagon since there still is no bandwagon.
Long-Term
From a long-term perspective the Index remains below its negative sloping long-term moving average line. The long-term momentum is, however, still very slightly in its positive zone and just above its trigger line. So, for the long term the rating is at a – NEUTRAL level, one step above a bear rating.
As for the performance of the 100 component stocks in the Index, the BULL/BEAR performance was 15% positive and 76% negative. There were 76 stocks closing on the up side during the week and 24 on the down side.
Intermediate-Term
The intermediate-term remains negative for at least another week. The Index is below its negative sloping moving average line and the momentum indicator remains in its negative zone although just a hair above its trigger line. The rating is therefore a BEARISH rating.
The intermediate-term performance of these stocks is just a wee bit better than that for the long-term. 21% had a positive performance while 70% had a negative one.
Shorter-Term
As mentioned in the past, it’s dangerous to try and guess a short term perspective using a weekly chart but here goes. The Index closed on Friday just a shade above its negative sloping moving average line. The momentum indicator is still in its negative zone but has moved above its trigger line and the trigger has turned to the up side. From this I get a short-term rating of + NEUTRAL, just a shade below a bull rating.
An interesting point is the momentum indicator. It has just moved above its oversold line for a hint that some good may be ahead, at least for the short term.
Merv’s Penny Arcade Index
The Merv’s Penny Arcade Index lagged the other precious metal Indices this past week, if only by a tiny amount. This seems to confirm that the upside is not yet bullish enough to go for the more speculative stocks and that the rally of the past week may not last. Only when speculators become quite bullish do they jump in to the more speculative stocks. In my previous days of following the ”pennies” I use to watch how many of the component stocks made huge weekly gains or losses as a way of gauging the level of enthusiasm for the pennies. This past week, despite the poorer performance versus the other Indices there were 5 “pennies” with weekly gains of more than 20% and one with a loss more than 20%. Maybe the enthusiasm is still there but very selective.
I’m late in this post so I’ll close here. As for the ratings for the Penny Arcade, they are very similar to the !00 Index ratings so go with those for this week.
Readers are invited to view my Facebook page at https://facebook.com/merv.burak where I will be slowly posting commentaries explaining in more detail my various indicators and techniques. I also present from time to time some individual stocks that look as if they may be good speculations. However, nothing I post is meant to be a recommendation to buy or sell. One should check with their broker or investment advisor before acting.
 Merv is a retired Aerospace Engineering consultant. He is also a retired market technician with over 40 years of market experience and research. Merv received his certification as a Chartered Market Technician (CMT) in 1992. Developer of many technical techniques and programs which he has been using in his previous Technically Speaking with Wil-Arm and Technically Precious with Merv commentaries posted throughout the globe. Developer of several gold and silver Indices, Merv continues to update his Merv’s Gold & Silver 100 Index and Merv’s Penny Arcade 50 Index and reviews them during his periodic on-going Technically Precious commentaries.


