The 17-Year Record For Gold And The Toronto Venture Exchange


Today’s contribution in our ongoing series on commodities prices and economic metrics is a study of the relationship between the price of gold and the TSX Venture Exchange (TSXV). The TSXV is the world’s foremost venture capital marketplace for emerging nanocap companies. Our analysis begins with its inception in late 2001.
In response to the 1997 BRE-X scam that devastated the junior resource sector, the Canadian Venture Exchange (CDNX) was created in late 1999 with merger of provincial exchanges in British Columbia, Alberta, Toronto, and Montreal; it later added the small Winnipeg Exchange. In December 2001, the CDNX was purchased by TMX Money Group and renamed the TSX Venture Exchange. A weighted index was established and opened on December 10 with an initial value set at 1000.
Our data set consists of daily London pm gold prices posted by Kitco.com and daily TSX Venture Exchange Index closing values posted by TMX Money. We have calculated monthly averages for gold (red) and the TSXV Index (purple) and present a composite chart below:
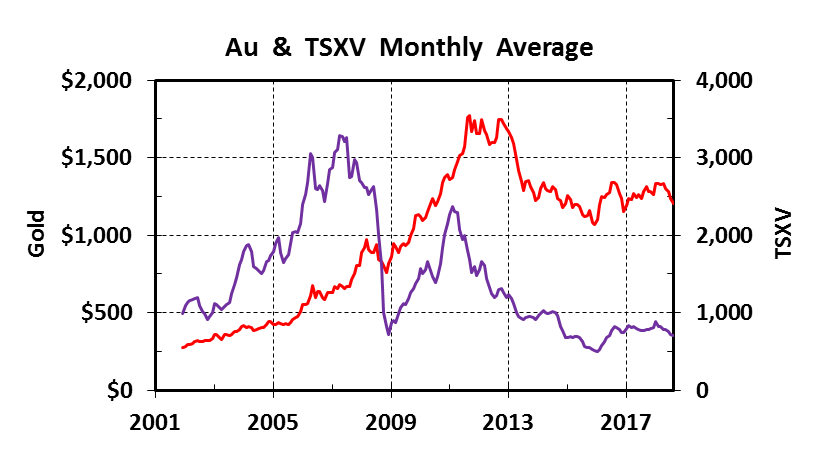
A perusal of patterns in the price chart indicates that gold and the TSXV Index are positively correlated most of the time. However, the Venture Exchange is much more volatile with occasional rapid swings, parabolic rises and falls, and significant spikes on both the up- and downsides. At various times, the Index has foreshadowed substantial moves in the price of gold and at other times, the opposite has occurred.
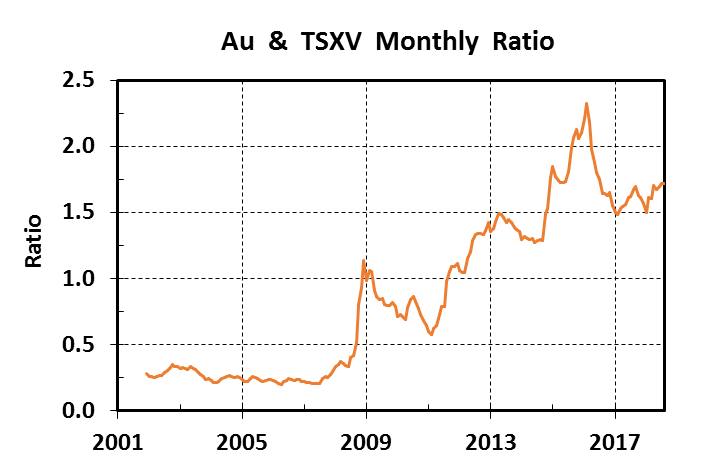
Here are the gold-TSXV ratios covering a period of 201 months, i.e., three shy of 17 years:
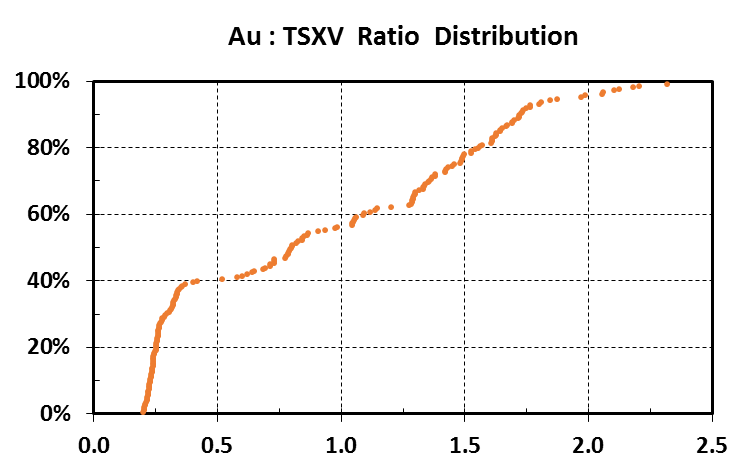
The ratios are posted below in a cumulative distribution chart, a table of intervals with their percentage of the data set, and a histogram of the same.

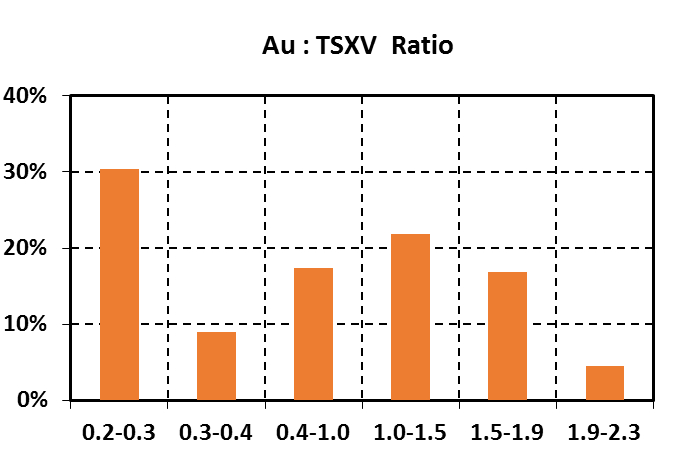
Ratio intervals occur as follows:
· Values from 0.2 to 0.3 comprise over 30% of the history and occur exclusively from December 2001 thru November 2007.
· Ratios from 0.3 to 0.4 occupy 9% of the data within two time frames: August 2002 to July 2003 and December 2007 until June 2008.
· The broad interval from 0.4 to 1.0 represents over 17% of the months and also occurred during two periods: July to November 2008 and April 2009 to August 2011.
· Another wide interval, 1.0 to 1.5, represents almost 22% of the data history and happened during three months in late 2008 and early 2009 and then from September 2011 until October 2014.
· Nearly 17% of the months produce ratios from 1.5 to 1.9 with these values occurring from November 2014 to July 2015 and from May 2016 to the present.
· Ratios in the range of 1.9 to 2.3 comprise nine outliers in the data set from August 2015 to April 2016.
The relationship between gold and the junior market is readily visualized using ratios of these two metrics. Since inception, the overall pattern has been one of increase. They ratios can be divided into five broad time segments that reflect this paradigm:
· From inception until the global economic crisis, the ratio varied from 0.2 to 0.4.
· It went briefly above 1.0 during the economic meltdown but soon dropped as a bull market for commodities ensued and the Index soared. Ratios reached a low of 0.6.
· The Index spiked, peaked, and fell in early 2011. Ratios steadily rose to 1.5 as gold continued to remain relatively high until early 2013.
· When gold entered its three-year bear market, ratios first dropped but then went exponential in the fall of 2014 when the oil price collapsed. Au-TSXV peaked at over 2.3 soon after oil, gold, copper, and the TSXV Index bottomed in late January 2016. Ratios dropped as gold rallied during that year’s unusual summer doldrums season.
· Since the late summer of 2016, the price of gold and the Index have moved in tandem and the ratio has stayed uniformly high from 1.5 to 1.7.
Now let’s take a detailed look into these broad periods. I will explain the behavior of Au-TSXV ratios in context of macroeconomic factors, resource sector events, and overall commodities markets.
The inception of the TSXV and its index coincided with an incipient bull market for gold in early 2002. The yellow metal rose with barely a pause from below $300 an ounce to all-time highs over $1000 in the spring of 2008. During this period the Venture Index increased concomitantly with gold albeit with more volatility. Average monthly high values were well above 3000 in the spring and summer of 2007 with a peak day at 3370 in early May.
Throughout this bull market, Au-TSXV ratios were uniformly low between 0.2 and 0.4 from December 2001 thru mid-summer of 2008, comprising nearly 40% of the data set.
Immediately prior to and during the global economic collapse in the late summer and fall of 2008, ratios rose rapidly, peaking at over 1.0 from December 2008 thru March 2009. The Toronto Venture Exchange continued a year-long slide that began soon after the Nova Gold failure in the late fall of 2007; it finally capitulated at 700 and change in December 2008.
Gold followed suit, although much less dramatically. It reached its nadir below $800 from mid-October to mid-December as speculators sold anything liquid and especially gold to cover margin calls.
The economic crisis, financial machinations by Western governments, and a rapid recovery of the commodities sector driven by a Chinese infrastructure build-out initiated a new ratio paradigm. Gold went on another long bull run but the volatile junior market index increased more rapidly. When the TSXV Index briefly bounced above 2400 in early March 2011, the monthly ratio was below 0.6, a level that has never been approached again.
Of course this TSXV exponential rise begat a parabolic spike followed by an exponential fall. It was spurred on by the Japanese earthquake and tsunami that resulted in the Fukushima nuclear incident in mid-March. Gold peaked in September 2011 at $1895 an ounce but remained high for over another year and a half.
Ratios increased continuously from March 2011 until early 2013 the gold began its predictable parabolic fall in April. An extended bear market in all metals ensued and was exacerbated by the collapse in oil prices in the fall of 2014. Nearly the entire ratio history from 1.0 to 1.5 is contained within in this time frame and comprises almost 22% of the total distribution.
The oversupply of oil weighed on all commodities including gold. But that was mild compared to the Venture Index, which dropped like a rock. Heretofore unseen ratios above 1.5 ensued.
Gold had lost 45% off its high by mid-December 2015, bottoming at a daily of $1049. Oil, copper, and other metals hit their lows in late January 2016 and the Toronto Venture Index drifted down to an all-time low at 476. Eight of the nine outliers in our distribution, i.e., the interval from 1.9 to 2.3, occurred from August 2015 to April 2016.
Once the bottom was put in for commodities in January 2016, a strong rally ensued in both the price of gold and the TSXV Index value. Gold averaged $1097 per ounce in January and $1341 in August. Meanwhile, the Venture Index average was 497 in January, lagged gold in February, but rose 64% to 816 for August. Over these six months, the ratio dropped from its all-time high of 2.3 down to 1.6.
Over the past two years, both monthly gold ($1200 - $1335) and the TSXV (700 - 825) have been range bound and their ratio has vacillated in a saw tooth pattern between 1.5 and 1.7. The only exception was when the Index popped to 890 in January of this year prior to the collapse of cryptocurrency and marijuana stocks. These sectors have recently become important components of the Index that was previously the exclusive domain of resource stocks.
Both gold and TSXV monthly averages were at 2.5-year lows in August at $1201 and 698 respectively with a ratio of 1.7. Gold remains in the doldrums for September while the Venture has gained a tad on higher volumes after Labor Day.
In conclusion, the 17-year history of the TSX Venture Exchange Index has largely reflected trends in the price of gold. Although both are subject to parabolic rises and falls, the Index is much more volatile given its standing as the world’s most speculative venture capital market. Over the past year, it has become less skewed toward resource sector stocks in favor of highly volatile cryptocurrency and marijuana companies with bubble tendencies.
A common axiom among brokers, financiers, and professional speculators is this: “As goes gold, so goes the Venture”. Our research and analysis indicates this is often the case.
With the price of gold stuck in neutral and apparently dependent on a weaker US dollar to break thru resistance at $1200 an ounce, the end of a junior resource bear market is not in sight for 2018.
*********
Mickey Fulp
Mercenary Geologist
Acknowledgment: Troy McIntyre is the research assistant for MercenaryGeologist.com.
The Mercenary Geologist Michael S. “Mickey” Fulp is a Certified Professional Geologist with a B.Sc. Earth Sciences with honor from the University of Tulsa, and M.Sc. Geology from the University of New Mexico. Mickey has 35 years experience as an exploration geologist and analyst searching for economic deposits of base and precious metals, industrial minerals, uranium, coal, oil and gas, and water in North and South America, Europe, and Asia.
Mickey worked for junior explorers, major mining companies, private companies, and investors as a consulting economic geologist for over 20 years, specializing in geological mapping, property evaluation, and business development. In addition to Mickey’s professional credentials and experience, he is high-altitude proficient, and is bilingual in English and Spanish. From 2003 to 2006, he made four outcrop ore discoveries in Peru, Nevada, Chile, and British Columbia.
Mickey is well-known and highly respected throughout the mining and exploration community due to his ongoing work as an analyst, writer, and speaker.
Contact: [email protected]
Disclaimer and Notice: I am not a certified financial analyst, broker, or professional qualified to offer investment advice. Nothing in any report, commentary, this website, interview, and other content constitutes or can be construed as investment advice or an offer or solicitation or advice to buy or sell stock or any asset or investment. All of my presentations should be considered an opinion and my opinions may be based upon information obtained from research of public documents and content available on the company’s website, regulatory filings, various stock exchange websites, and stock information services, through discussions with company representatives, agents, other professionals and investors, and field visits. My opinions are based upon information believed to be accurate and reliable, but my opinions are not guaranteed or implied to be so. The opinions presented may not be complete or correct; all information is provided without any legal responsibility or obligation to provide future updates. I accept no responsibility and no liability, whatsoever, for any direct, indirect, special, punitive, or consequential damages or loss arising from the use of my opinions or information. The information contained in a report, commentary, this website, interview, and other content is subject to change without notice, may become outdated, and may not be updated. A report, commentary, this website, interview, and other content reflect my personal opinions and views and nothing more. All content of this website is subject to international copyright protection and no part or portion of this website, report, commentary, interview, and other content may be altered, reproduced, copied, emailed, faxed, or distributed in any form without the express written consent of Michael S. (Mickey) Fulp, MercenaryGeologist.com LLC.
Copyright © 2018 Mercenary Geologist.com, LLC. All Rights Reserved.


