3 More Years Of Expansion? How Will Gold Price React?
 share
share
 share
share
 share
share
 share
share
 share
share
We are just a few weeks from breaking the record. If the current US economic expansion lasts until July 2019, it will reach 121 months, becoming the longest ever. The extended duration of the prosperity begs the question of when the next downturn will occur. We invite you to read our today’s article about the state of the US economic expansion and find out whether its days are numbered. And what it all means for the gold prices.
We are just a moment away from a significant achievement. If the current US economic expansion lasts until July 2019, it will reach 121 months, becoming the longest ever. The extended duration of the prosperity begs the question of when the next downturn will occur. Many analysts believe that its days are numbered, but we dare to disagree.
You see, we do not focus on the mere headlines, but always investigate the underlying factors behind the changes in specific data series. That’s true that the current expansion will likely be the longest on the record, but the reason for this is the softness of the recovery. The present expansion has been weaker than historical recoveries. Indeed, the real GDP has jumped just 24 percent since the end of the Great Recession. That’s a very disappointing result by historical standards: on average, the GDP rose by 33 percent during the previous three economic expansions, even though they were shorter.
Other indicators paint a comparable picture. For example, the industrial production has increased 27 percent so far during the current boom, compared to the average of 33 percent. Similarly, the real incomes rose by 26 percent in the present expansion, while the historical average increase was 31 percent. The chart below compare graphically the current boom with previous expansions.
Chart 1: Current vs. previous economic expansions (1982-1991; 1991-2001; 2001-2007) compared in terms of real GDP (green bars), industrial production (blue bars) and real incomes (red bars)
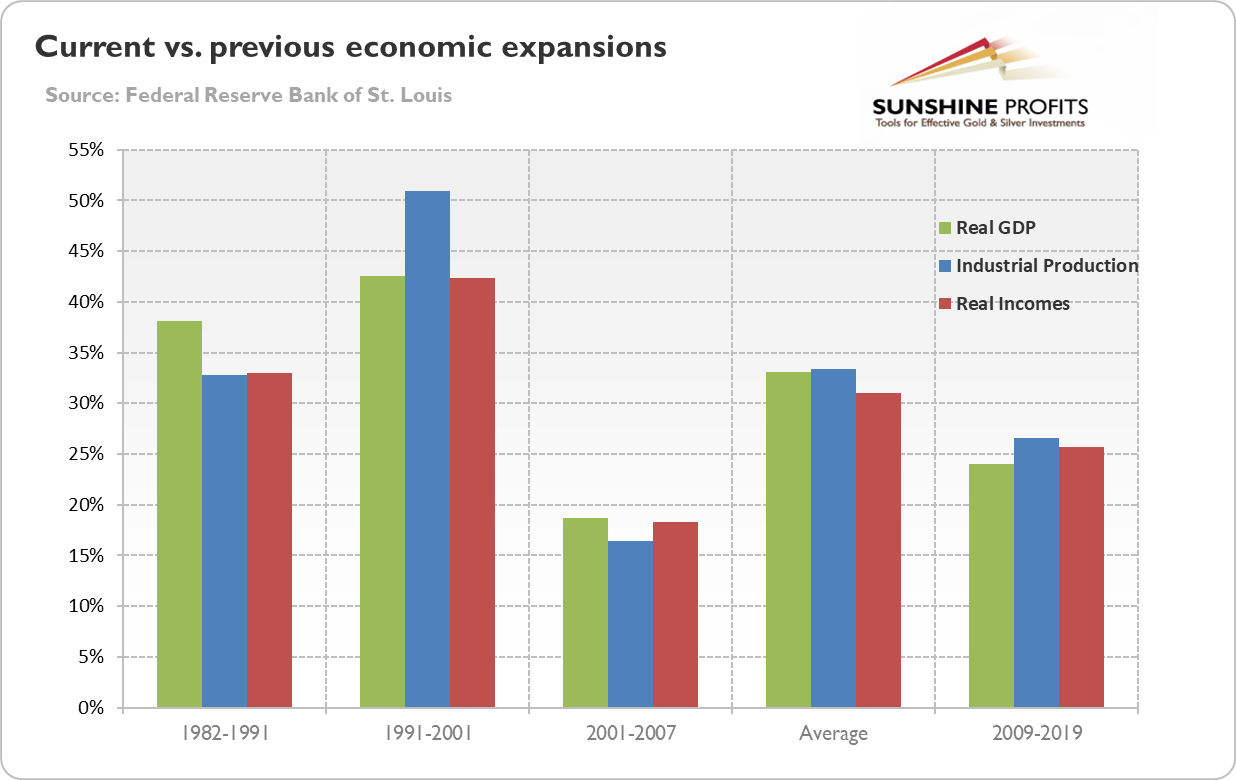
As one can see, the expansions of 1982-1991 and of 1991-2001 were significantly more dynamic. The expansion of 2001-2007 was nominally weaker, but only because it lasted only six years. But the pace of growth was faster, so if it lasts the same number of months as the current expansion, the cumulated growth would be larger (the real GDP would grow almost 30 percent).
The sluggish pace of the current recovery is very disturbing, as deep recessions have generally been followed by steep recoveries in the past. So why does this recovery, which follows the second worst recession, diverges from the historical pattern? One explanation is the debt burden. The housing sector was so heavily indebted that it did not want to take new loans, but focused on deleveraging, despite the real interest rate policy. Another factor to blame is the increased political uncertainty and tightened regulatory environment after the financial crisis. The new regulations and policies weakened companies’ willingness to invest.
Hence, the present expansion still has room to run. Our comparison indicates that if the US economy is set to achieve the historical average of economic recovery in terms of real incomes, industrial production and real GDP, we could enjoy another two or three years of economic expansions. And this assumes only average level of three previous economic recoveries. If we assume that the US economy is to replay the robust recovery of the 1990s (or if we include the strong 1960s), it could grow for additional couple of years.
And there are a few important reasons to be optimistic. The first one is that the interest rates remain very low, while the Fed still conducts accommodative monetary policy, as it hikes the federal funds rate very gradually. Second, the housing debt to GDP has declined significantly since the economic crisis. There is, thus, more room for adding some leverage (however, the corporate debt is high, which could be potentially disrupting). Third, the political uncertainty is very elevated. We should expect that it will be very low during the late boom or just before the recession. It means that we could see more investment and growth when the political uncertainty recedes.
What does it mean for the gold market? Our research indicates that the US recession is not imminent. The current expansion is exceptionally old, but it is also abnormally weak. When we adjust for slower pace of growth, the statistical analysis concludes that we should enjoy the boom until 2021 or 2022. To be clear: we are not ruling out the possibility that the recession will come earlier. We are showing that focusing simply on the length of economic expansions, while abstracting from its strength, may lead to overly pessimistic conclusions.
This is bad news for the gold bulls. Although the fundamental outlook for the yellow metal for this year is better than for 2018 – think about less tight monetary policy – the gold price will probably not start a parabolic rally until the next economic crisis. It will happen one day, that’s for sure. But expansions do not simply die of old age. Investors should be prepared for the worst – and own some precious metals as a portfolio insurance– but they should not cry the wolf just because they have not seen him for a long time.
If you enjoyed the above analysis and would you like to know more about the economics and gold, we invite you to read the May Market Overview report. If you’re interested in the detailed price analysis and price projections with targets, we invite you to sign up for our Gold & Silver Trading Alerts. If you’re not ready to subscribe yet and are not on our gold mailing list yet, we urge you to sign up. It’s free and if you don’t like it, you can easily unsubscribe. Sign up today!
Arkadiusz Sieron
Sunshine Profits‘ Gold News Monitor and Market Overview Editor
* * * * *
All essays, research and information found above represent analyses and opinions of Przemyslaw Radomski, CFA and Sunshine Profits' associates only. As such, it may prove wrong and be a subject to change without notice. Opinions and analyses were based on data available to authors of respective essays at the time of writing. Although the information provided above is based on careful research and sources that are believed to be accurate, Przemyslaw Radomski, CFA and his associates do not guarantee the accuracy or thoroughness of the data or information reported. The opinions published above are neither an offer nor a recommendation to purchase or sell any securities. Mr. Radomski is not a Registered Securities Advisor. By reading Przemyslaw Radomski's, CFA reports you fully agree that he will not be held responsible or liable for any decisions you make regarding any information provided in these reports. Investing, trading and speculation in any financial markets may involve high risk of loss. Przemyslaw Radomski, CFA, Sunshine Profits' employees and affiliates as well as members of their families may have a short or long position in any securities, including those mentioned in any of the reports or essays, and may make additional purchases and/or sales of those securities without notice.
share
share
share
share
share

Arkadiusz Sieroń received his Ph.D. in economics in 2016 (his doctoral thesis was about Cantillon effects), and has been an assistant professor at the Institute of Economic Sciences at the University of Wrocław since 2017. He is a board member of the Polish Mises Institute of Economic Education, author of several dozen scientific publications (including in such periodicals as the Journal of Risk Research, Prague Economic Papers, Quarterly Journal of Austrian Economics, and Research in Economics), and a regular contributor to GoldPriceForecast.com and SilverPriceForecast.com. His two books, Money, Inflation and Business Cycles and Monetary Policy after the Great Recession, are both published by Routledge. Arkadiusz is also a certified Investment Adviser, a long-time precious metals market enthusiast, and a free market advocate who believes in the power of peaceful and voluntary cooperation of people.


