30 Year Mortgages; I Hate Them


Starting on Tuesday’s close, the Dow Jones closed below its BEV -10% line. Is this the beginning of a major collapse in valuation? Most likely not, but the Dow Jones has been going the wrong way all this week, going down, a little bit at a time. Then again, on Friday it was UP over 300 points. Still, with that nice advance, the Dow Jones at week’s close failed to clear its BEV -10% line below.
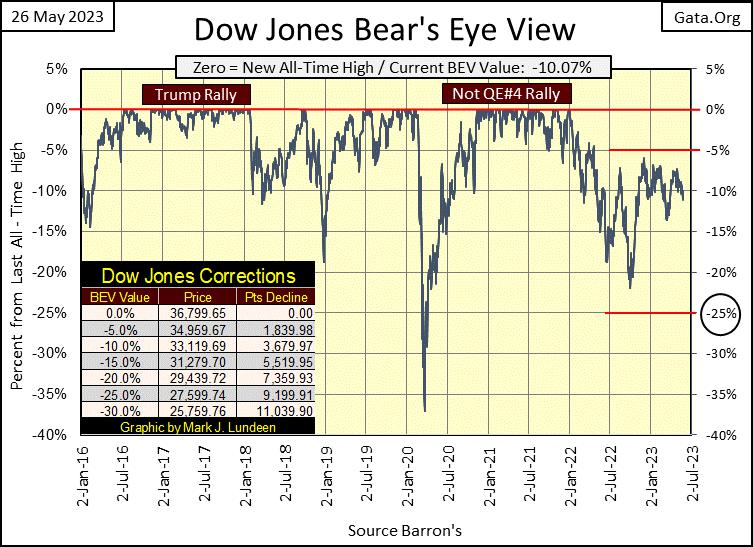
So, what now? We wait a little bit more to see what the next big thing will be; whether the next big thing takes the Dow Jones up over its BEV -5% line (into scoring position), or down below its BEV -15% line. Until then, we watch and wait, something market watchers do a lot of.
One thing this market has going for it is the political and economic establishment’s all-consuming hatred of Trump. The Donald is running again, and 2024 is a presidential election year. The last thing the nomenklatura and apparatchiks currently in power, dictating “policy” to the rest of us need, is another 40% decline in the Dow Jones sometime in the next eighteen months before election day in November 2024.
Admitting to this reality in the market, should the Dow Jones begin descending deep below its lows of last September, below its BEV -20% line, there must be something really, I mean really wrong in the financial system, the economy, or both. That’s because in our “regulated financial system” everything will be allowed for Wall Street to keep valuations up, and bond yields down, to prevent a tsunami of MAGA from flooding the halls of power in Washington.
Let’s look deeper into my Bear’s Eye View (BEV) data on the market’s major stock indexes below. Below is a table of the data I downloaded for Friday’s closing prices of the twenty indexes I follow. The Wilshire 5000 closed at 41,437, the XAU at 121, with the other indexes somewhere in between. How can this tangled web of valuation, that differs by two entire orders of magnitude, be displayed in common terms?
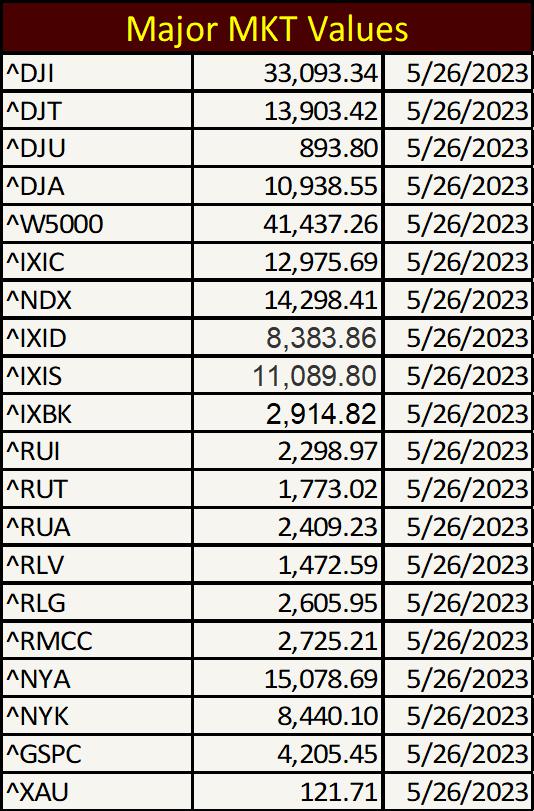
As you may have guessed, by using my Bear’s Eye View format. Forget valuation for the indexes above. Let’s think in terms of all-time highs, which we’ll use 0.0% / BEV Zero for, and percentage claw-backs from those all-time highs. That done, we can compare the twenty major market indexes above, on an equal basis, with one another below.
At week’s close, the Dow Jones was the top performing market index, closing only 10.07% from its last all-time high. The XAU reclaimed #21 at week’s end. But the NASDAQ Banking index (#20) closed the week 46.11% below its last all-time high. That isn’t something seen in a healthy market; seeing a banking index lose almost half of its market valuation since its last all-time high in November 2021, only a year and a half ago.
I wouldn’t be surprised should there be lots of problem banks, that right now should be taken over by their “market regulators”, but haven’t been to keep things quiet on Wall Street. During the sub-prime mortgage crisis, the Federal Reserve “injected” many trillions of dollars, very quietly behind the scenes to both domestic and foreign banks to facilitate quiescence in the financial system.
Is that legal? Who cares? It’s called “policy making,” and no one does that better than the idiots at the FOMC. So, don’t expect any news on this or that failed bank until things have gotten so bad the “policy makers” can’t keep their failure hidden from the public any longer.
Should the NASDAQ Banking index (#20 below) deflate deep below its BEV -50% line, that would be really bad.
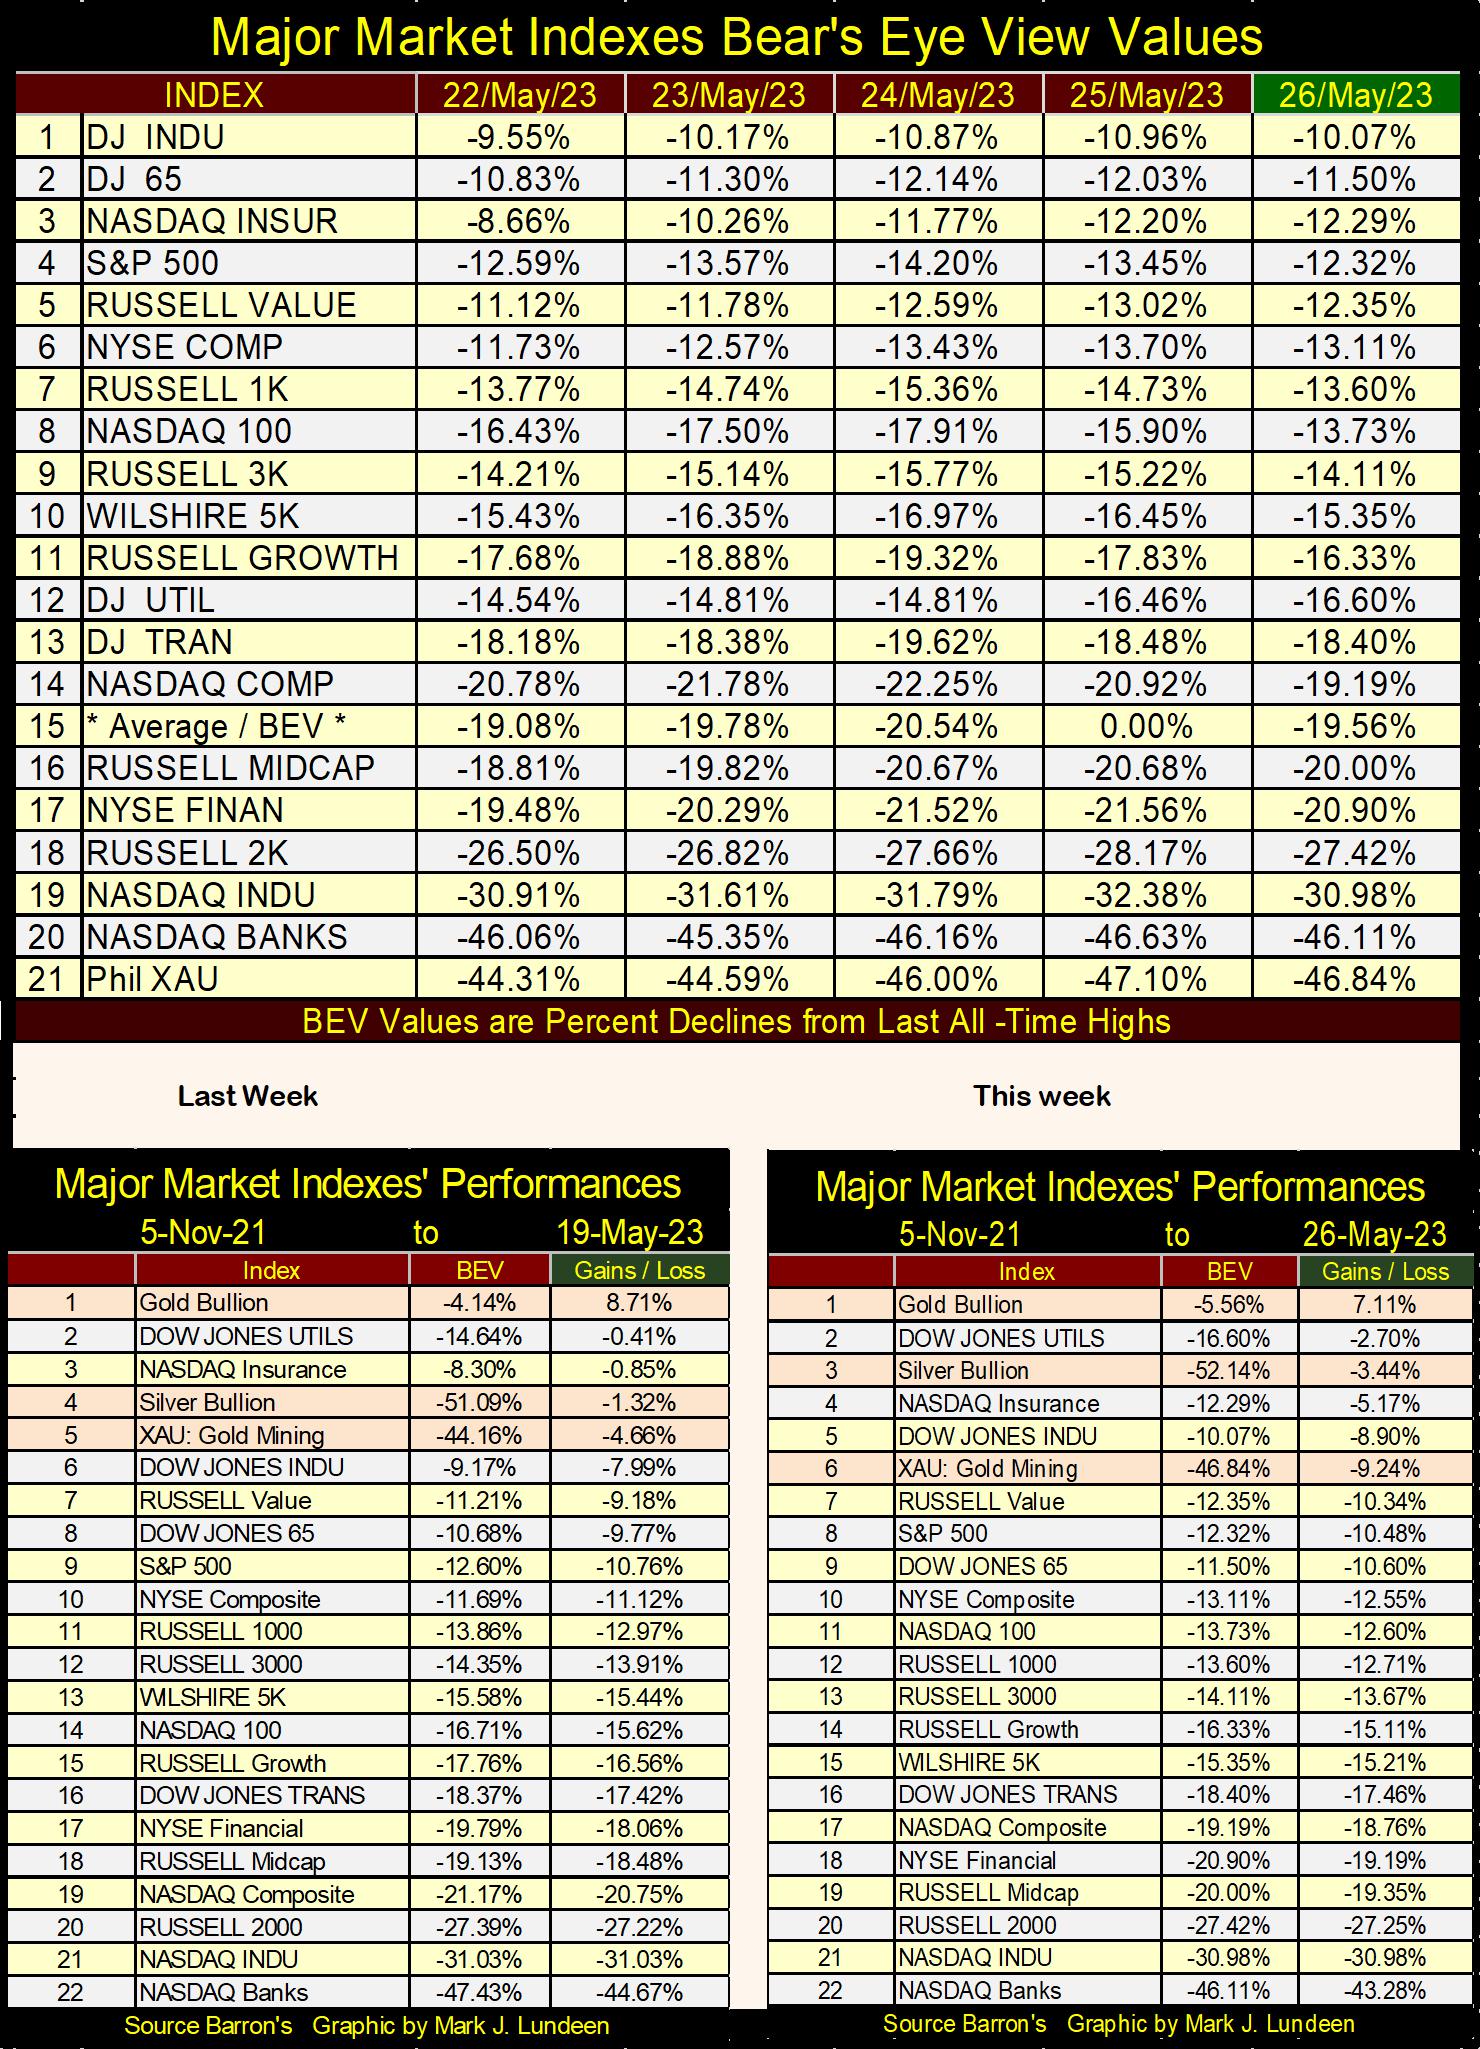
In the performance tables above, gold bullion is the only item that has advanced from the market highs of 05 November 2021. Everything else is down from a year and a half ago. Silver bullion and the XAU too, but not by much.
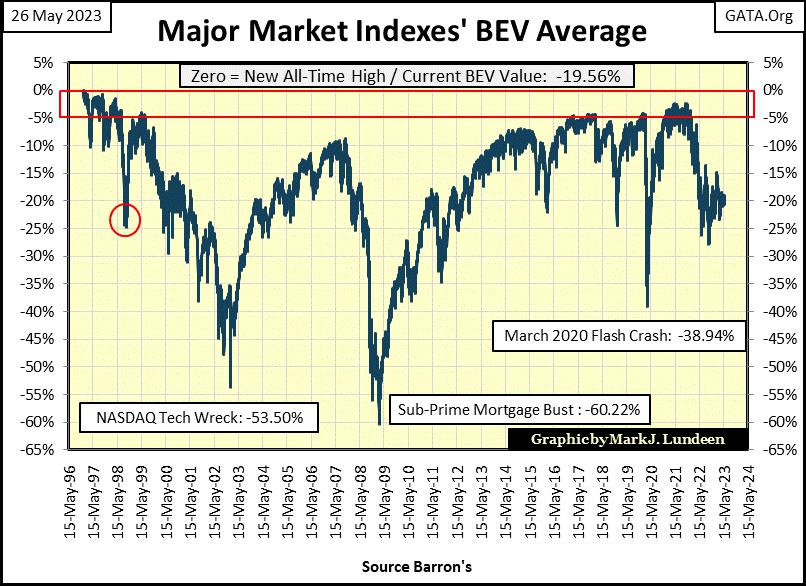
How people look at markets can vary widely; using the Dow Jones, S&P 500, NASDAQ Composite or something else. I’m beginning to appreciate the average BEV value in the table above (#15) as a method of evaluating the advances and declines in the market, see chart below. This average of 20 major market indexes’ BEV values takes it all in. I like it.
That is not saying I’m going to forget the Dow Jones; never! The Dow Jones goes back to February 1885, a time when steam locomotives were high-tech of the highest order. The Dow Jones defined market history for the past 138 years, and may I say it; the Dow Jones drips with class.
All that may be true, but this week the Dow Jones dripped a little bit less class than it did last week, going down in its daily bar chart below, though Friday was a good day for the bulls.
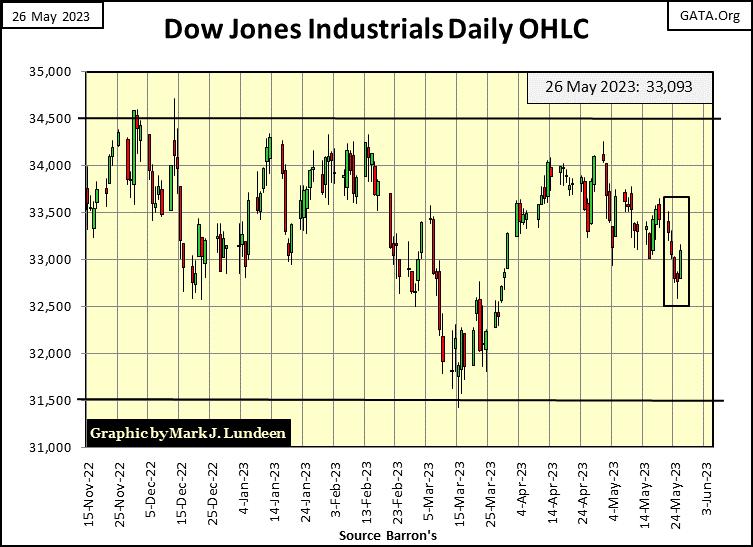
The Dow Jones appears to be losing steam. Last November, it couldn’t close above, and then stay above 34,500 for long. In February, 34,000 became a problem it couldn’t stay above. Then in April and May, 34,000 became a line of death for the Dow Jones; to touch it was to see the Dow Jones decline below it in the following days.
And now, in the past few weeks 33,500 seems to create problems for the Dow Jones. What the bulls (“policy makers”) need to do now is “inject” enough “liquidity” into the market to inflate the Dow Jones’ valuation to something above 34,500, and keep it there. Jeeze Louise, the Chinese-Water Torture Mr Bear has served up for the bulls since last November is not the way to keep Trump out of the White House in 2025.
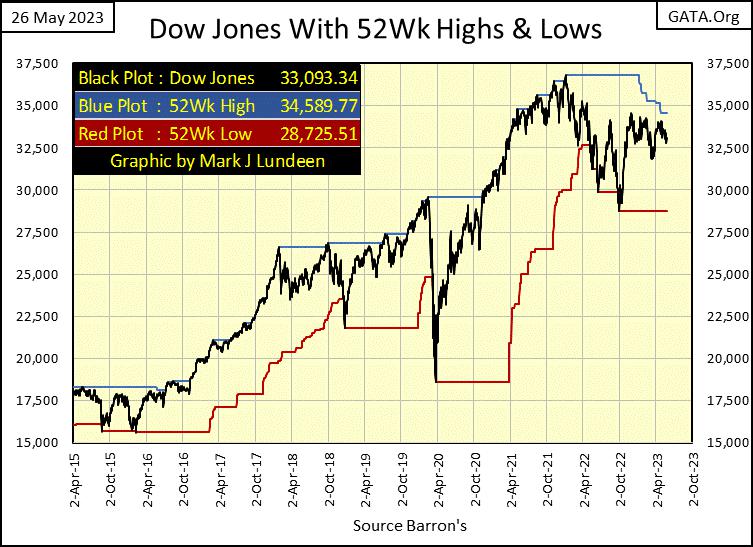
Here is a chart of the Dow Jones I haven’t published for a while, one with its 52Wk High and Low lines. The Dow Jones’ 52Wk line (Blue Plot) is trending down, something not seen in the eight-years shown in this chart. Is that bad? Well, it’s not good, and something I expect we’ll see more of in the years to come.
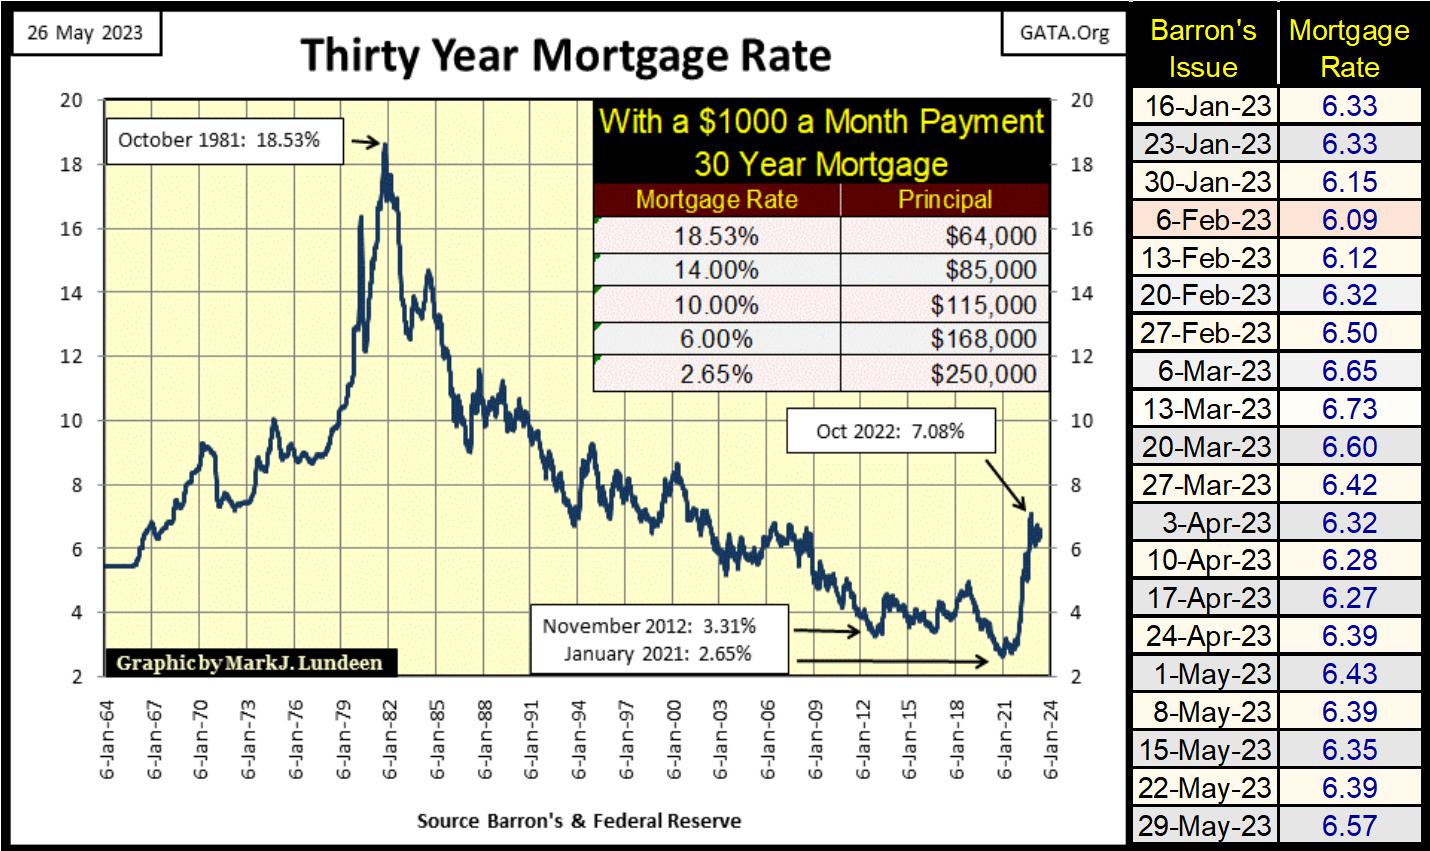
Since their highs of last October, mortgage rates have kept above 6%, but below 7%. It could be worse; mortgage rates could be approaching 8%, but so far that hasn’t happened. No matter, as things are, there must be people hurting out there, people who can’t move from their current homes, as their mortgage are upside down, with their mortgage’s principle larger than the market value of their home.
How does that happen? First, a “homeowner” must believe it is possible to own a home as long as there is a mortgage on it. They in fact don’t; the bank does. The bank only allows the “homeowner” to live in the mortgage’s collateral for the term of the mortgage, as long as the “homeowner” maintains the bank’s collateral. Of course, after paying each and every monthly payment of the mortgage, the “homeowner” then in fact becomes a homeowner.
So, what does that have to do with upside down mortgages? Okay, you got me there; nothing really. But it is good to understand the difference between a so called “homeowner” and an actual homeowner – a mortgage.
I hate them, not “homeowners” but mortgages. The worst of the bunch is the 30yr mortgage, where for the first ten years of payment (the first 120 monthly payments) a “homeowner” only pays off about only 15% of their mortgage’s principle.
The 30yr mortgage is the industry standard, because the banks love them. As “homeowners” trust the “experts” in the real estate business, most people end up being stuck with a 30yr mortgage. And that is a real shame, as a 20yr mortgage is a much better deal for “homeowners.”
But before we look at that, lets first look at the mortgage chart above, where in October 1981, mortgage rates peaked at 18.53%. Forty years later in January 2021, mortgage rates bottomed at 2.65%. What does that mean? Well, the fact that mortgage rates increased to 18.53% in 1981, is an artifact of the massive inflation the US dollar economy had from the US Government ignoring its obligation to limit its circulation of dollars to the gold held by the US Treasury since the end of WWII.
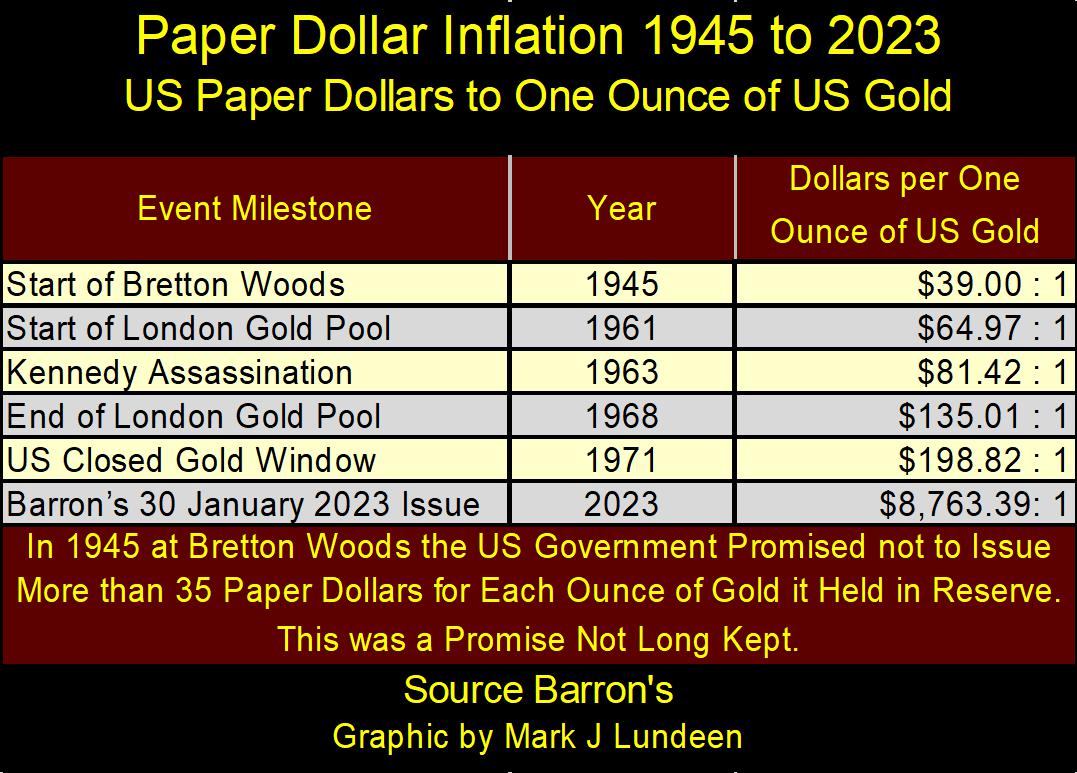
From 1934 to 1971, the dollar standard was $35 for each ounce of gold held by the US Treasury, but it wasn’t much of a standard. As seen in the table below, by the time “Nixon closed the gold window” in August 1971, previous administrations had increased the supply of dollars to 198.82 for each ounce of gold held by the US Treasury. What kind of $35 gold peg is that? And then they blame everything in President Nixon.
Last January, the supply of dollars (as measured by CinC / paper dollars in circulation) was 8,763.39 dollars for each ounce of gold the US Treasury claims to hold, but most likely doesn’t actually have. Don’t tell me the “monetary policy” of the FOMC has been one of low inflation, when for many decades it’s actually been one of massive inflation.
In 1971, McDonalds advertised a hamburger, order of fries and a coke for less than a $1.00. A dollar bought you lunch with eight cents back as change. What does a $1.00 gets someone at McDonalds today?
Why everyone, including the Federal Reserve, now wants to dump the dollar, in favor of a new cyber currency, can be seen in the table below. The “policy makers” have trashed the dollar. That plus, the new cyber currency will allow the “policy makers” to make slaves out of everyone who will be forced uses it. By design, economic privacy will become impossible for American citizens, and anyone else when using it. Its real “Mark of the Beast” stuff; right out of the Bible.
Be afraid, be very afraid of this new cyber currency.
Following the August 1971 abandonment of the $35 gold peg, bond yields, interest rates and mortgage rates soared to double digits, peaking in 1981. Then beginning in 1981, a huge forty-year bull market began in the bond and real estate markets. How that worked for the real estate market can be seen in the table below.
“Homeowners” go to a bank for a mortgage thinking in terms of home prices; can I afford a house of this price or not? Bankers don’t give a damn about what the price of a home is. They really don’t. Their only concern is; can this prospective “homeowner” make the 360 monthly payments for the 30yr mortgage I’m going to write for them? And that is that!
Looking at the table below, where our “homeowner” could afford a $1000 a month payment the bank is focusing on. In October 1981, when mortgage rates peaked at 18.53%, they could afford a home valued at $64,490. A very nice, upper middle-class house in 1971.
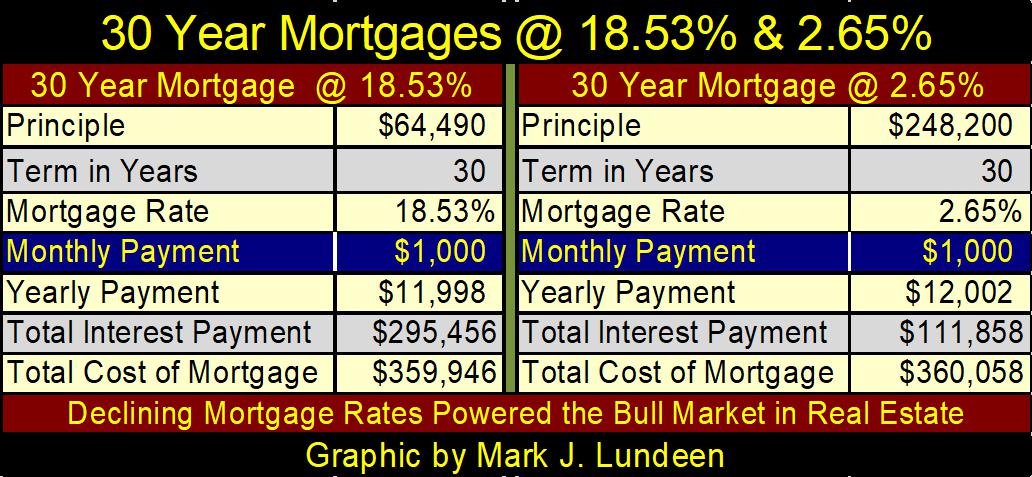
Forty years later, when their children sold this home, after their parents passed away, they were amazed their parent’s home appreciated to $248,200. The new “homeowner,” with their $1000 monthly payment, could now afford a quarter million-dollar estate, as mortgage rates had collapsed to 2.65%. But in fact, it is the same house, but one that now needed a new roof, windows and plumbing.
Bull markets are fun, but bear markets are not. With rising bond yields, interest and mortgage rates, there is going to be a bear market in debt for a long time to come. For the real estate market, that means deflating property valuations, maybe for decades.
Why I hate 30yr mortgages can be seen in the table below, showing three mortgages, each with a 5% rate. People like the 30yr mortgage, as it has the lowest monthly payment. But the 20yr and 15yr mortgage monthly payments are larger, as each monthly payment retires the mortgage’s principal to a greater degree. In other words; the payments are higher because the “homeowner” is paying off their mortgage.
When one compares the total cost of these mortgages, principal, and interest, the 30yr mortgage is 22% more expensive than the 20yr mortgage, and 36% more expensive than the 15yr mortgage.
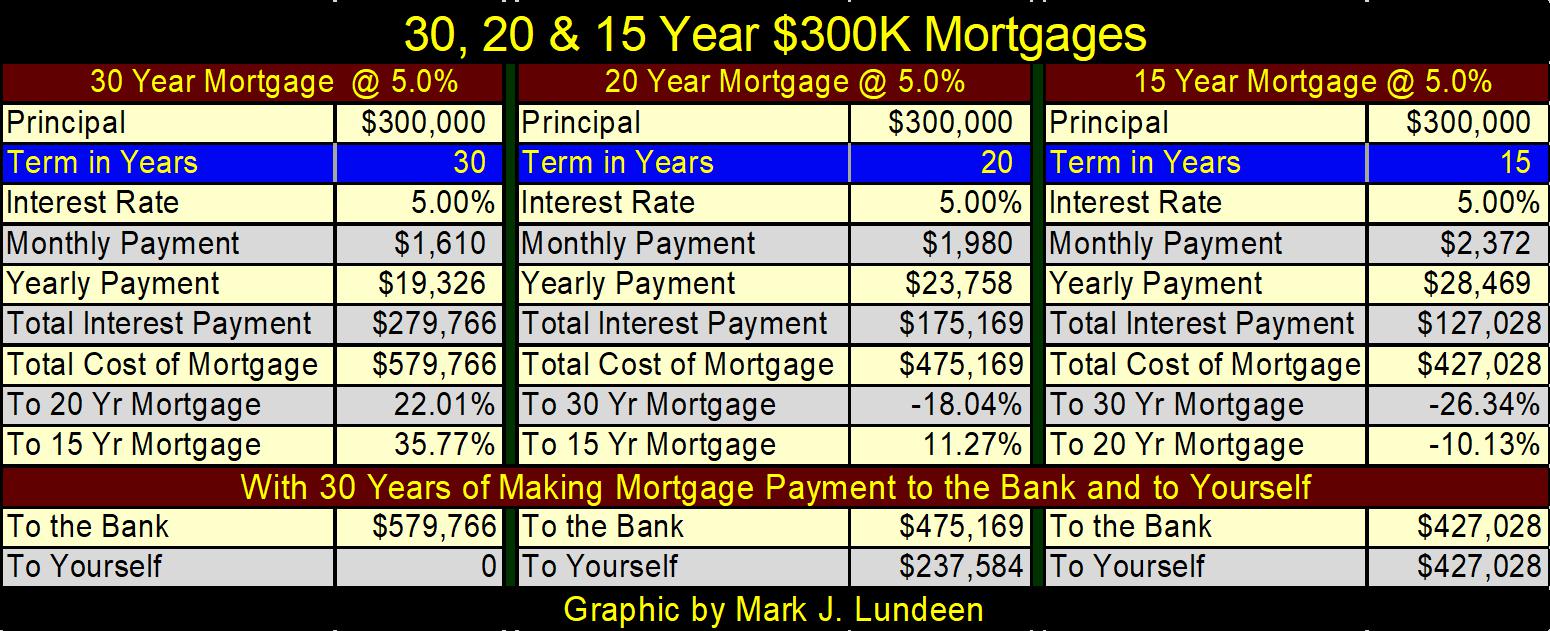
And then, the time in human life spent on a 30yr mortgage has a price too. If a homeowner taking a 20yr mortgage above, made the $1980 monthly payment a 30-year commitment, in 30 years they’d have a fully paid home, plus $237,584 in savings. With interest payments or capital gains, that near quarter million-dollar sum could worth much more.
The 15-year mortgage, would be even better, with $427,028 in the bank along with a fully paid for home after 30 years.
I hate owing money. Being in debt gives me the heebee jeebies. So, let’s move on from mortgages, and on to corporate bonds that pay a return on money invested. Do I like bonds? No, I don’t. The debt markets have also been thoroughly trashed by the idiots dictating “monetary policy” at the FOMC.
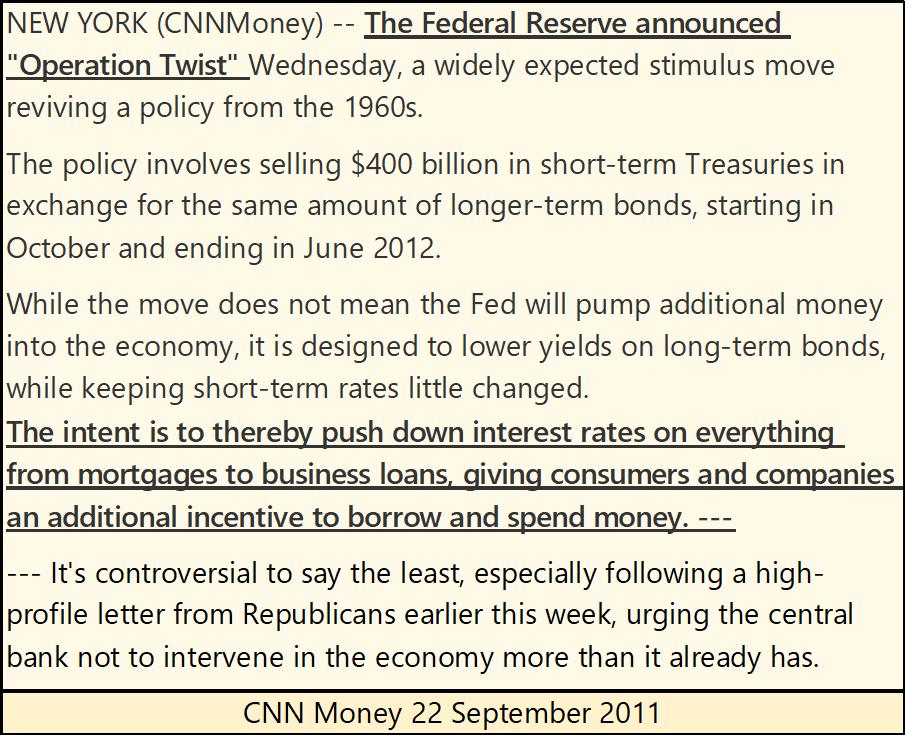
See that vertical line at September 2011 in the chart below? That was Doctor Bernanke’s “Operation Twist,” a “policy” designed to drive bond yields down to “stimulate economic growth.” That should tell you what will happen when bond yields once again rise towards double digits.
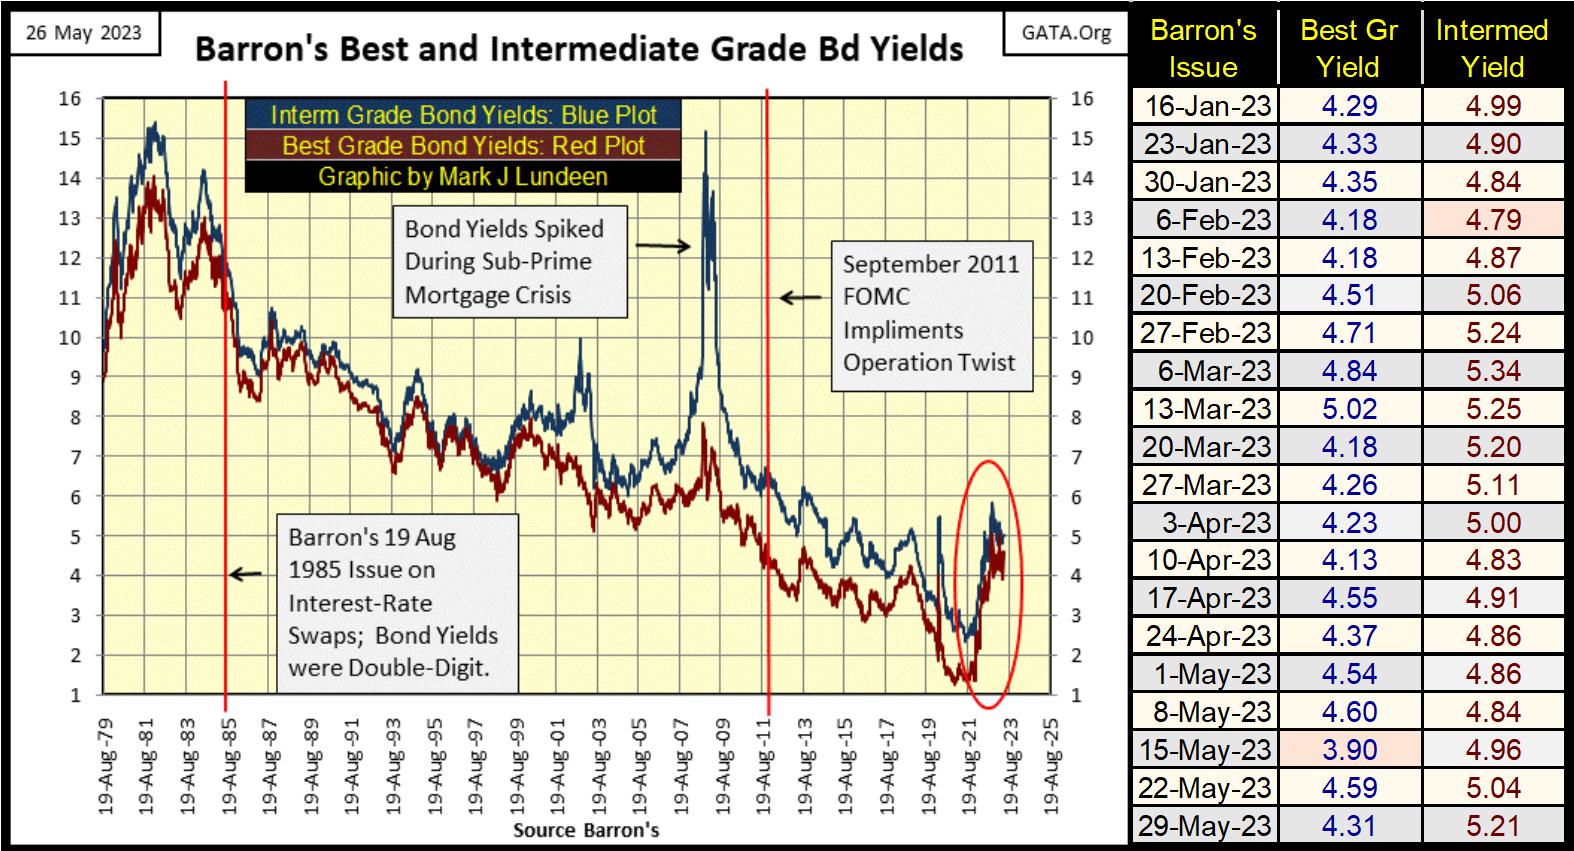
Bonds were in a bull market from 1981 to 2022 above, as declining yields = rising valuations. But beginning in January 2022, these corporate bond yields have been rising, and rising yields = deflating valuations.
To put that into practical terms, the spike in yields seen above were a contributing factor to the recent defaults for regional banks in California. Troubled banks are most likely more common than reported on in the financial mainstream media, and the banking system’s woes will only get worse as bond yields rise.
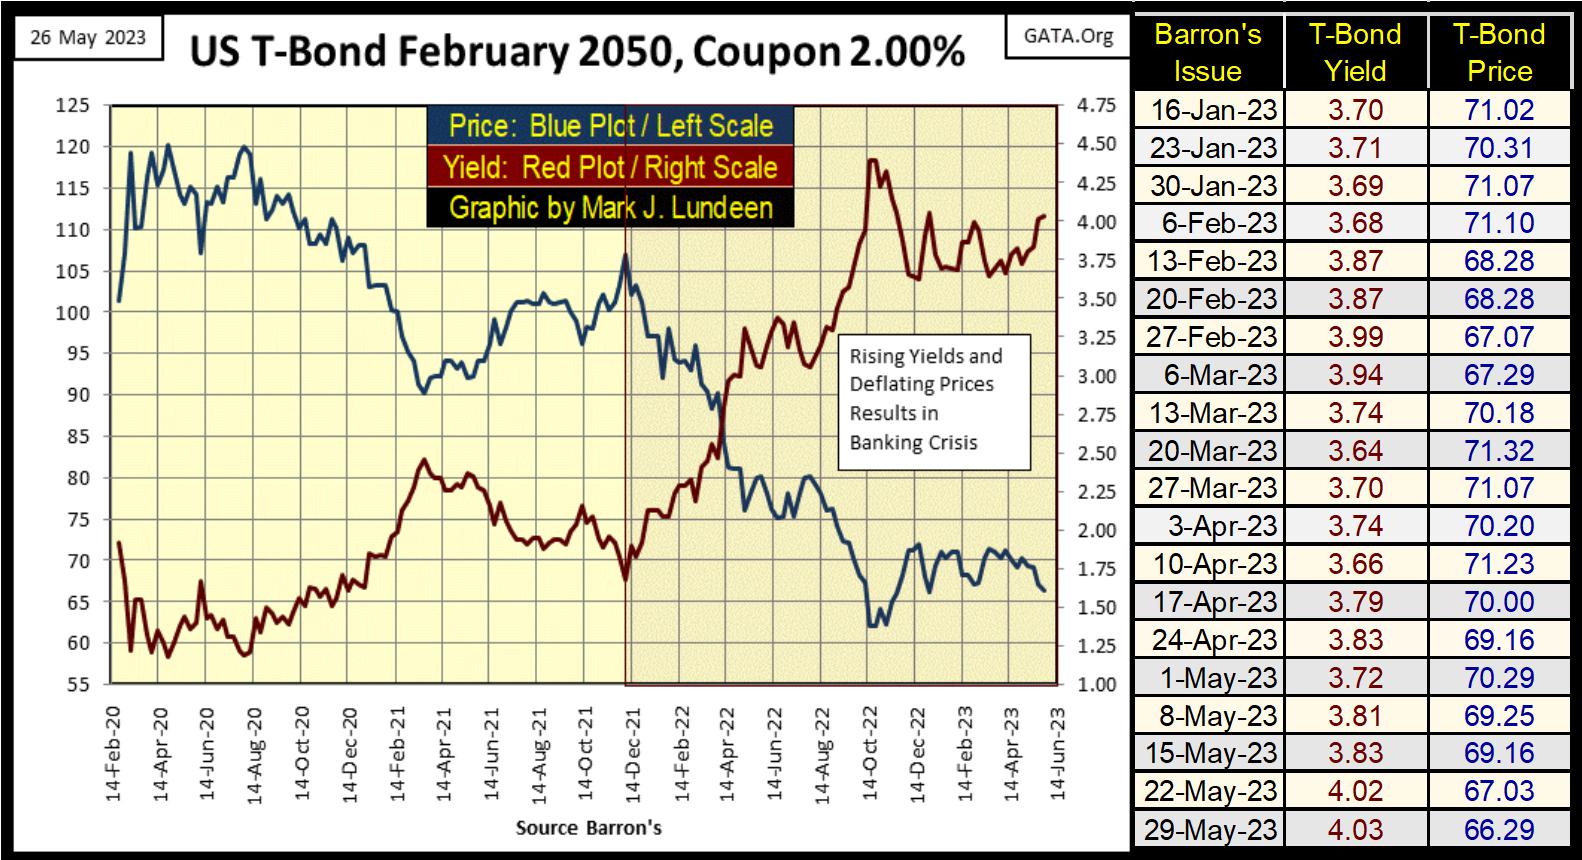
Here is a 30yr T-bond issued in February 2020. It has seen a lot of market action in the past three years. Note; unlike the corporate bonds above, this week this T-bond’s yield increased to its highs of 2023, as its valuation has deflated by 33% from its day of issue in February 2020.
If you need income from the market, if you can, avoid debt of any kind. But then Treasury debt that comes due within the next year should be okay. Still, with the world as it is today, purchasing good quality major gold and silver miners, that pay a dividend seems the way to go.
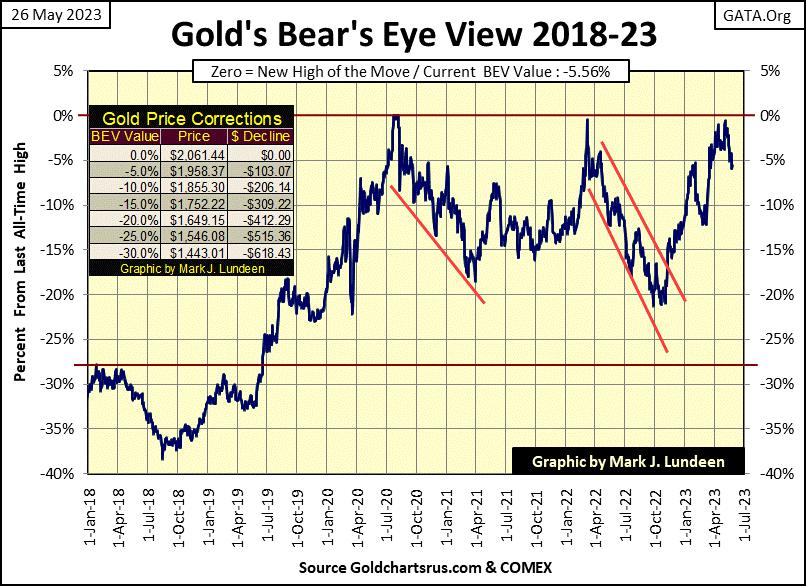
Here is gold’s BEV chart. Looking at gold trading this week was a horror show; down for three of the week’s five trading days. Yet for all of that, the COMEX goons could only get gold to close outside of scoring position, just barely with a BEV of -5.56%. The goons have something to prove to me, that they can force gold down below its lows of last March, something below a BEV of -12%, about $1800 in dollar terms.
But if they do, they then have to push gold down below its BEV of -20%, or $1649. I’ve been wrong before, but I don’t believe they can do that.
Look at gold’s BEV values in its step sum table below. Gold has been in scoring position for a long time, since March 21st. That is two months with gold’s BEV value below -5.00%. On May 4th, it saw a BEV of -0.56%; gold was a mere $12 away from making a new all-time high. And after all that, gold’s last all-time high is still from August 2020; $2061? Whiskey – Tango – Foxtrot!
If someone wants to argue with me about the tooth fairy being real, I’ll give them some time. But don’t waste my time telling me gold and silver aren’t “regulated markets,” markets whose valuations aren’t depressed by their government regulators, and Wall Street’s shorts. These goons are not even trying to hide their manipulations any more.
Gold 15-count saw a -3 on Thursday; it may have worked off its overbought 15-count of +7 seen on May 10th. We will know if that is so should gold once again see a period where daily advances outnumber its declines in the weeks to come, where hopefully gold once again makes another attempt at a BEV of 0.0%, (something over $2061) in its BEV chart above
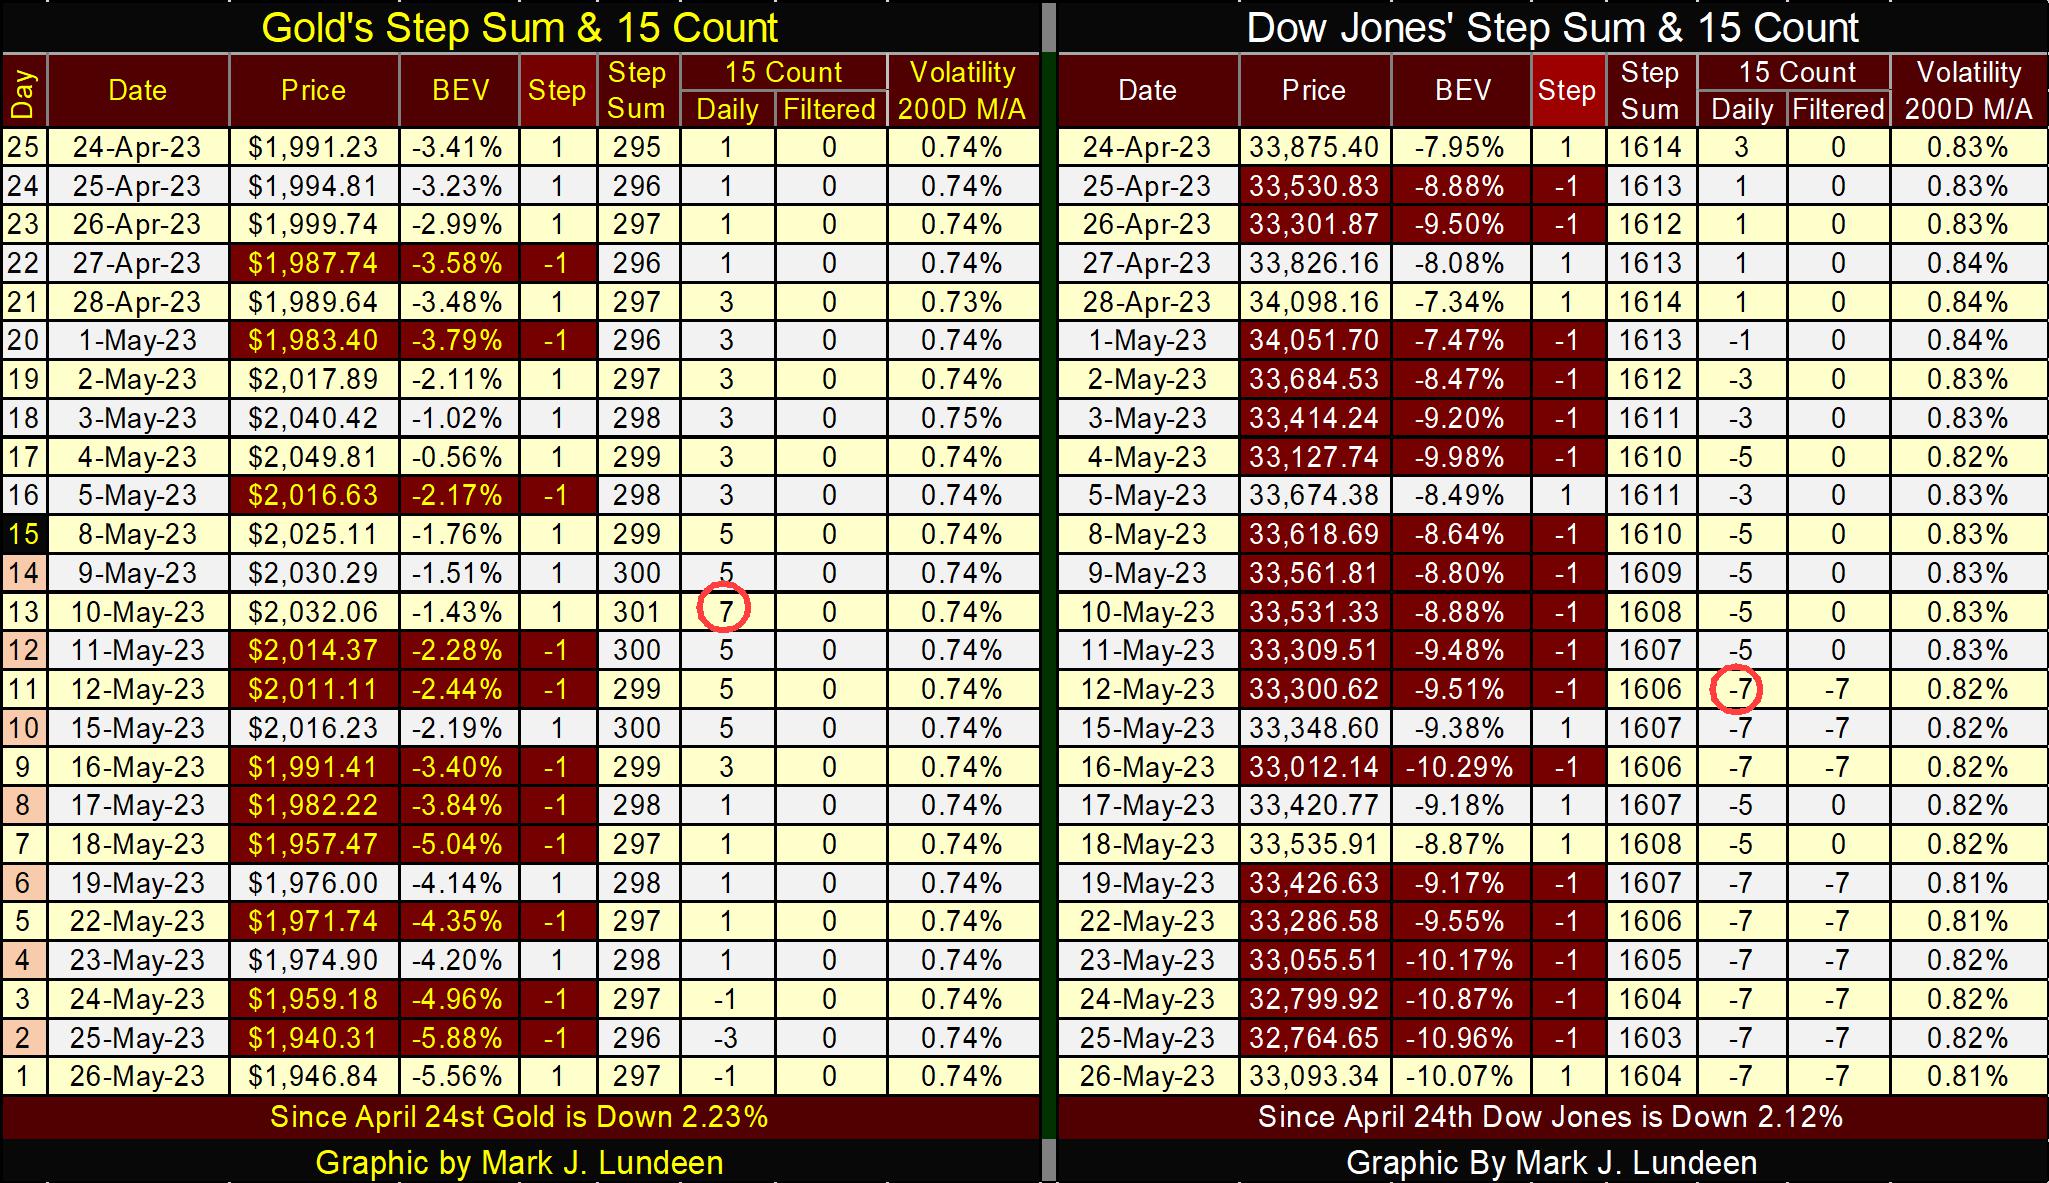
The Dow Jones’ 15-count has seen many -7s since May 12th, making the Dow Jones an oversold market. Had it closed down on Friday, it would have seen a 15-count of -9, making it a very oversold market. But this decline in the Dow Jones has so far been controlled, breaking below its BEV -10% level, but not much more than that. Seeing how the Dow Jones is down by only 2.12% since April 24th tells us no one is panicking. Not yet anyway.
This is Memorial Day Weekend, with Memorial Day being observed on Monday. Memorial Day – IS NOT – Veterans Day, because one can’t be a veteran unless one comes back. Memorial Day is for all those young people who went somewhere over there, and died in terror and filth on the ground, plunged to their deaths from high above, or were burnt or drowned far out at sea.
So, enjoy your beer and Bar-B-Que on Monday. The military dead won’t begrudge you for it as long as you don’t forget what Memorial Day is all about; all the young faces that never grew old, because they took the oath to defend the US Constitution from all enemies, both foreign and domestic.
Mark J. Lundeen
*********


