The 4, 9 And 18-Year Cycles In U.S. Stocks


Gold Market Update
Last week's trading saw gold forming its high in Monday's session, here doing so with the spike up to the 1912.00 figure. From there, a sharp decline was seen, with the metal dropping down to a low of 1859.00 - made the very same day. The balance of the week saw a sideways consolidation, finishing in the middle of the weekly range.
As mentioned in previous articles, the gold market was at or into the range for a mid-term bottom to form, with the potential that this low was registered with the late-November tag of the 1767.20 figure. The action into early last week is additional evidence that this key low was made back in November, and with that we are looking (overall) for additional strength in the coming months.
The larger rally phase is expected to come from our 154-day time cycle for gold, which is shown on the chart below:
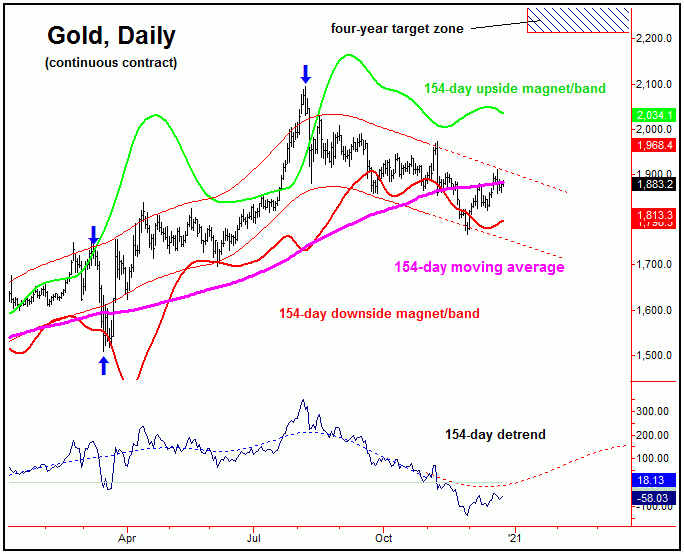
The best confirmation of a 154-day cycle trough is for a push above the upper 154-day cycle channel, which is currently enclosing price action. In terms of price, our expected path is looking for an eventual move back to the upper 154-day cycle band - which is shown in green. Having said that, the eventual path for the bigger picture is looking for a move into our open four-year target zone of 2212.00 - 2340.56.
If our larger low for gold is in place, then we will be looking to add to the long side in the coming weeks. With that, we have identified several key 'reversal dates' - which are dates where we will be looking for countertrend bottoms to occur, with the smaller-degree cycles that we track. More exact details are noted in our thrice-weekly Gold Wave Trader market report.
The 4, 9 and 18-Year Cycles in U.S. Stocks
This weekend I want to take a look at the longer-term cyclic position of the U.S. stock market. These larger-degree cycles are pushing firmly higher into at least the year 2022, but, more likely, will remain higher into the 2026-2027 timeframe, where the next really major peak will be coming due.
The chart below shows the four-year cycle in U.S. stocks:
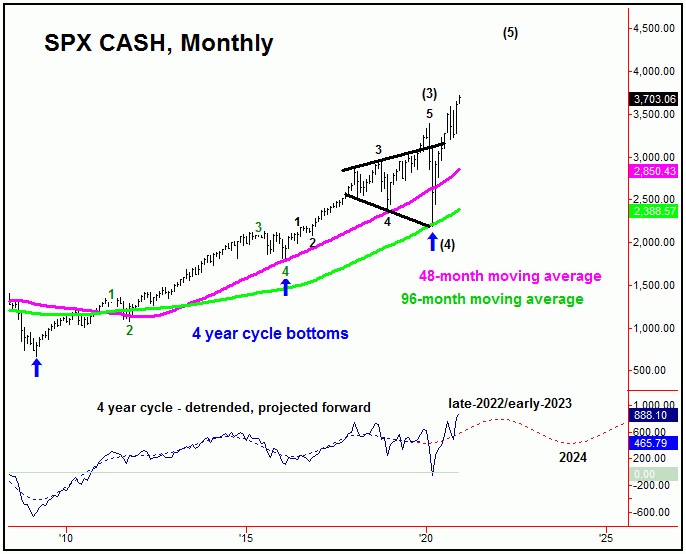
The last low for this four-year cycle in U.S. stocks was registered back in March, doing so with the tag of the 2191.86 SPX CASH figure. From there, its upward phase was later confirmed to be back in force, with the ideal time assumptions favoring this wave to be pointing higher into the year 2022 or later. Its next low - if made on schedule - is projected for the year 2024, plus or minus.
In terms of price, with the average rallies with this four-year wave having been around 100% from trough-to-peak, the overall suggestion is that the S&P 500 index (or 'SPX') will see the 4400's being met before the next upward phase of this wave tops out. The next larger-degree peak should come from this same component, ideally made on or past the Spring/Summer of 2022 - though it could come as late as the year 2023.
From whatever high that forms with this four-year wave, at the odds will favor a minimum correction back to the 48-month moving average on the SPX into what looks to be the year 2024, plus or minus. Going further, the average declines with this component have been around 33% from peak-to-trough, thus giving us some idea of how this will play out.
Having said the above, there are cycles above the four-year wave. That is, the March, 2020 low was not only a bottom for the four-year cycle, but we also a bottom for the larger (though less dominant) nine-year wave that we track, shown below:
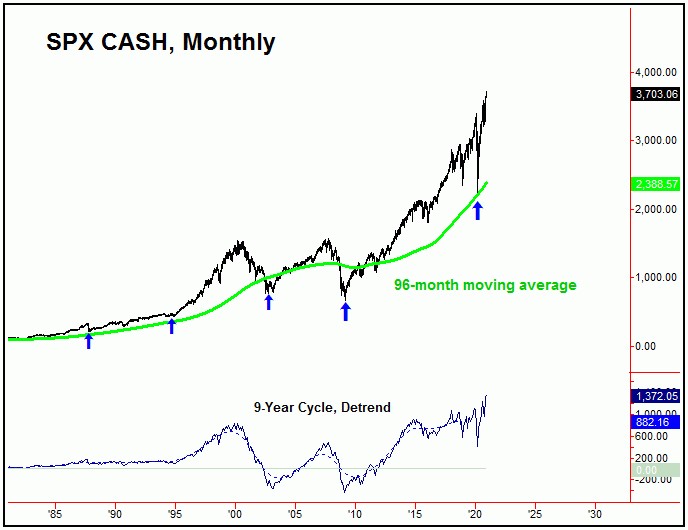
In terms of price, our rule is that a cycle has a very strong tendency (i.e., 85% or better odds) of reverting back to a moving average of the same length. The March, 2020 low did do that, in seeing a drop back to both the 48 and 96-month moving averages - which are approximations for the four and nine-year cycles.
Above the four and nine-year cycles, there is also the presence of an even-larger wave, the 18-year component. That wave last bottomed back in 2009, and with that is currently deemed to be heading higher into what looks to be the year 2026 or later.
With the above said and noted, due to the configuration of the larger 9 and 18-year cycles, the odds will favor the next downward phase of the four-year wave to end up as a larger countertrend affair - holding above the 2191.86 SPX CASH figure. If correct, another rally of 80-100% should play out from a year 2024 bottom into the 2026-2027 timeframe, then to look for the next major price top.
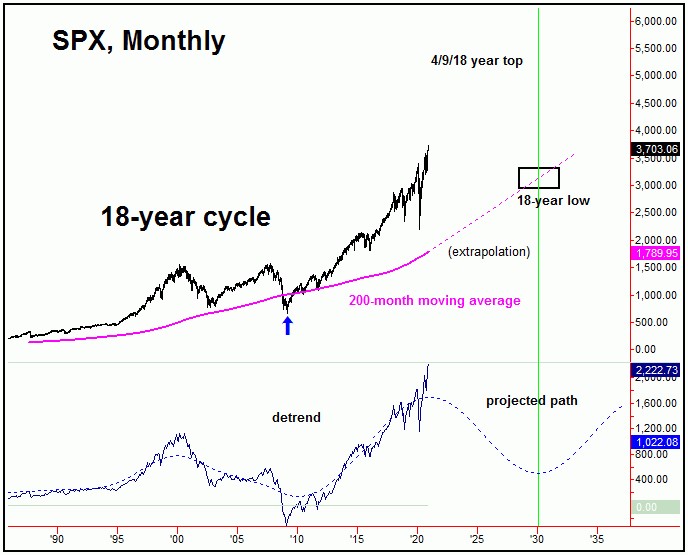
For the bigger picture then, higher highs into the 2026-2027 timeframe - if seen as expected - should peak both the larger 9 and 18-year waves. From that high, a 'crash'-type move - something similar to what we saw into the 2002 and 2009 lows - is likely to play out into the year 2030, plus or minus. In terms of price, that decline would see the 200-month moving average (chart, above) acting as the magnet.
In terms of patterns, however, the next downward phase of the 9 and 18-year cycles is currently anticipated to end up as a countertrend affair, ideally holding at or well above the 2191.86 SPX CASH figure. If correct, what follows should be another decade long bull market phase - one which sees an average rally of 350% or more into the following 18-year top.
The Bottom Line
The bottom line for the bigger picture is that the larger bull market for U.S. stocks is in firm force, and is projected to remain so in the coming years - before the next major top attempts to form. As a side note, we will be releasing our Market Turns 2021 forecast issue the first week of January, where we go into detail how we expect the path to play out for the coming year. Happy holidays!
Jim Curry
The Gold Wave Trader
http://goldwavetrader.com/
http://cyclewave.homestead.com/
More from Gold-Eagle


