The 49-Year Record Of Gold-Palladium Ratios


Price ratios determine relative value of the precious metals and are useful tools for deciding which metal to buy at any given time.
In previous musings, I documented the history of gold and silver prices and ratios from the United States’ abandonment of the gold standard to present, then followed with similar treatments for platinum-gold and platinum-palladium (Mercenary Musings: May 9, 2016; February 6, 2017; January 15, 2018).
High prices for palladium have led to unusual lows for the gold-palladium ratio since the fall of 2017. Today, I document historical prices and ratios over 49 years.
The monthly average price chart for both metals from January 1970 to December 2018 is shown below. Note that gold was fixed with a range from $35 to $37/oz until December 1971 while palladium was fixed at $35 to $36 until May 1972. We use London pm closing prices compiled from Kitco.com.
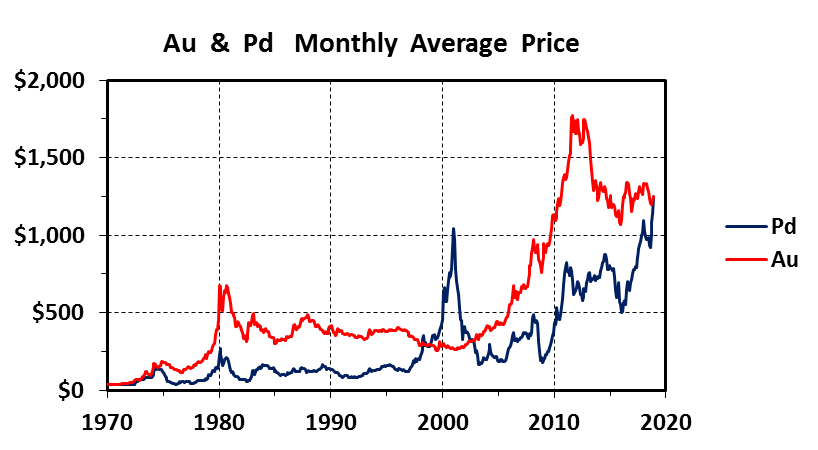
The price chart shows similar patterns and a general correlation of gold and palladium prices. That said, both metals are subject to parabolic spikes, either can be more volatile than the other, and on occasion, their prices are strongly divergent.
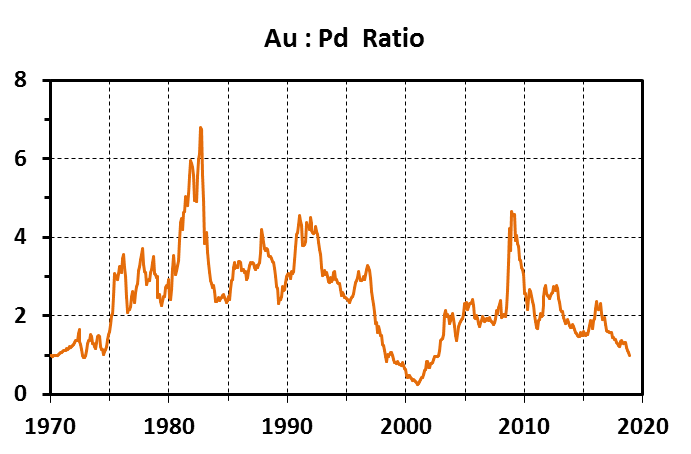
As a result, gold to palladium price ratios show wide variance over the 49 years of this study and range from highs above 6.0 to lows well below 1.0. The average and the mean are both 2.4.
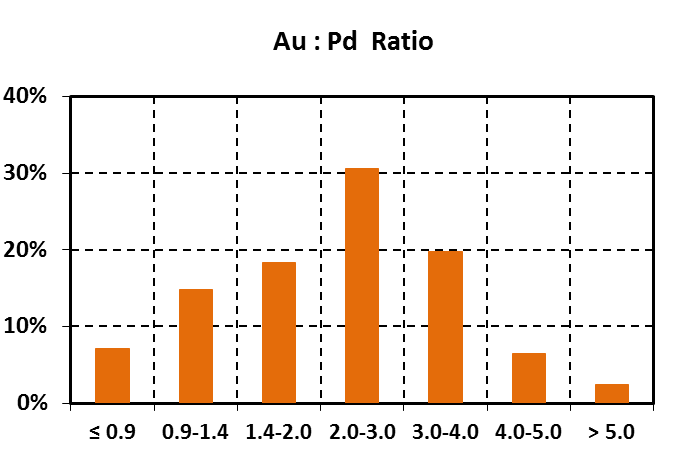
Our data set covers 588 months. The distribution of ratios in both tabular and chart format follows:
|
Ratio |
% of Months |
|
< 0.9 |
7.1% |
|
0.9-1.4 |
14.8% |
|
1.4-2.0 |
18.4% |
|
2.0-3.0 |
30.6% |
|
3.0-4.0 |
19.7% |
|
4.0-5.0 |
6.5% |
|
>5.0 |
2.4% |
Here’s a summary of our study of gold-palladium ratios from January 1970 to present:
· Ratios < 0.9 are unusual, occurred over 7.1 % of the time, and happened from 1999 to 2002.
· Ratios from 0.9 to 1.4 constitute 14.8 % of the record and occurred from 1970-1974, in the late 1990s, early 2000s, and late 2017 thru 2018.
· The ratios between 1.4 and 2.0 happened 18.4 % of the time.
· Ratios from 2.0 to 3.0 comprised 30.4 % of the distribution.
· 3.0-4.0 is also a common range for ratios and occurred during one-fifth of the record at 19.7 %.
· The 4.0-5.0 interval is unusual, covers 6.5 % of the months in our compendium, and happened in 1981-1982, the market crash of late 1987, 1990-1992, and the economic crisis of late 2008 to mid-2009.
· There are 14 monthly outliers at > 5.0 that comprised 2.4 % of the total record. These abnormally high ratios happened in 1981 and 1982 when palladium fell well below $100 an ounce.
Significant variations in the relative value of the two metals are common but extreme ratios are rare:
· From early 1999 thru mid-2002, ratios were less than 0.90 when Russia cut back sales from its palladium stockpile to the West. In January 2001, rumors spread that it would stop exports altogether, palladium soared to record highs over $1000 an ounce, and the ratio bottomed at an historic low of 0.25. Unhedged hoarding by American automaker Ford exacerbated the price spike. But when Russia’s balance of payments suffered, it dumped palladium on the open market in mid-2001, and the price went parabolic. Note that Ford wrote off over $1 billion against its hoard at the end of that year.
· Recent ratios approaching parity with gold are largely due to a palladium supply deficit. Increased demand for gasoline-powered automobiles at the expense of diesel, more stringent environmental regulations for Chinese cars, an oversupply of platinum resulting in shuttering of South African production, and economic sanctions against Russia oligarchs (Norilsk) have contributed to this deficit. Palladium has repeatedly hit all-time highs above $1200 over the past month amid rampant speculation that has jacked-up the price
· Ratios on the extremely high side (> 5.0) occurred when palladium was below $100 and as low as $57 an ounce in 1981-1982. A global recession resulted in lessened industrial demand. This was also prior to the widespread substitution of palladium for platinum in catalytic converters.
· Another time of high ratios (> 4.5) occurred when the auto industry collapsed during the global economic crisis in the winter of 2008-2009. While palladium demand plummeted, monthly average gold prices reached highs over $900 per ounce on safe haven demand.
Supply and demand fundamentals are at polar opposites for these two rare metals:
· Gold is the only truly precious metal with an estimated 98 % of the cumulative amount ever mined still available for hoarding, trade, or barter. 85 % of gold is held as jewelry or bullion. Demand is driven by wealth preservation and safe haven hoarding in times of economic uncertainty and disruptive geopolitical events.
· Industrial uses of palladium constitute 94% of demand. Use is dominated by the automobile market with significant demand for electronic, dentistry, and chemical applications. About 5 % is used in jewelry with a very small investment demand at 1%.
· Gold is produced by a plethora of countries around the world from a variety of deposit types. Nine countries mine more than 100 tonnes per year.
· Palladium supply comes from five countries but is dominated by Russia and South Africa. Each produces 38-39% of the world budget with Canada at 10%, the United States at 5-6%, and Zimbabwe at 4%. It is produced as a co-product or by-product of platinum mining and is a by-product of nickel smelting.
Palladium is a very small market. According to the USGS, world production over the past 10 years averaged 187 tonnes; 2018 estimates are for 208 tonnes. Compare these mine supplies with 2017 gold production at 3150 tonnes. From 1990-2017, about 4800 tonnes of palladium were mined while cumulative gold production has been almost 71,200 tonnes.
From a compendium of sources, the average crustal abundance of both gold and palladium is about 3-4 ppb. Clearly the relative amounts of metal mined and the average crustal abundances have no influence on the price relationship of gold and palladium.
Fluctuations in the relative prices of gold and palladium are driven by these factors:
· overall health and growth of the world’s economy affect demand for gold as a precious metal and for palladium as an industrial metal;
· geopolitical issues in Russia and labor and profitability issues at South African platinum mines that can cause major disruptions in palladium supply;
· demand for gasoline-powered automobiles mainly from the US and China and to a lesser extent, Europe;
· an inelastic palladium supply that is dependent on demand for platinum and nickel;
· secondary supply for palladium with about 30% of annual demand coming from recycling of catalytic converters; very price sensitive and can fluctuate wildly;
· safe haven hoarding of gold in times of economic uncertainty and major geopolitical events;
· speculators in the small palladium paper market (bullion exchanges, ETFs, and derivative markets) exacerbate supply-demand imbalances, creating volatility and leading to overbought or oversold conditions.
Now to more practical matters:
As my readers are aware, I view gold as the only real money. It is my safe haven and insurance policy against financial calamity.
Palladium is almost exclusively used in industrial products and processes with very minor demand as a precious metal for jewelry and investments. Historically, most jewelry demand came from Chinese lower classes who could not afford gold or platinum.
The gold-palladium ratio signals when one metal is over- or undervalued with respect to the other. The London monthly average ratio for December was 1.0. Ratios at or below par have only occurred about 11% of the time since 1970. The platinum-palladium ratio is also abnormally low at 0.64.
The conclusion is obvious: Palladium is severely overbought and overvalued with respect to both gold and platinum. Rest assured these relationships will normalize in due course.
I own no palladium. Despite its record London pm price of $1271/oz on December 20, palladium remains an industrial metal. It is a precious metal in price only and certainly is not and has never been a monetary metal.
Note also that palladium bullion as coins and bars is limited both in choice and availability compared to other precious metals. Like platinum, mark-ups are three to four times higher than for gold.
Given these historically low ratios of gold-platinum and platinum-palladium, I have chosen to buy platinum at times over the past three years. Note the additional mark-up for platinum is always a factor in my evaluation process.
I strive to maintain 10-20% of my net worth in physical bullion. Most is in gold but I always own some platinum and some silver, too. As a hoarder of gold and at times, other precious metals, my basic strategy is to buy during downticks in price regardless of bull or bear market cycles.
I trust that you too have a stash of physical gold bullion in your physical possession.
And if not, what is your insurance policy to live and prosper if / when we are faced with financial calamity and economic collapse?
Mickey Fulp
Acknowledgment: Troy McIntyre is the research assistant for MercenaryGeologist.com. I thank Louie James for an interesting discussion about palladium and monetary metals.
The Mercenary Geologist Michael S. “Mickey” Fulp is a Certified Professional Geologist with a B.Sc. Earth Sciences with honor from the University of Tulsa, and M.Sc. Geology from the University of New Mexico. Mickey has 35 years experience as an exploration geologist and analyst searching for economic deposits of base and precious metals, industrial minerals, uranium, coal, oil and gas, and water in North and South America, Europe, and Asia.
Mickey worked for junior explorers, major mining companies, private companies, and investors as a consulting economic geologist for over 20 years, specializing in geological mapping, property evaluation, and business development. In addition to Mickey’s professional credentials and experience, he is high-altitude proficient, and is bilingual in English and Spanish. From 2003 to 2006, he made four outcrop ore discoveries in Peru, Nevada, Chile, and British Columbia.
Mickey is well-known and highly respected throughout the mining and exploration community due to his ongoing work as an analyst, writer, and speaker.
Contact: [email protected]
Disclaimer and Notice: I am not a certified financial analyst, broker, or professional qualified to offer investment advice. Nothing in any report, commentary, this website, interview, and other content constitutes or can be construed as investment advice or an offer or solicitation or advice to buy or sell stock or any asset or investment. All of my presentations should be considered an opinion and my opinions may be based upon information obtained from research of public documents and content available on the company’s website, regulatory filings, various stock exchange websites, and stock information services, through discussions with company representatives, agents, other professionals and investors, and field visits. My opinions are based upon information believed to be accurate and reliable, but my opinions are not guaranteed or implied to be so. The opinions presented may not be complete or correct; all information is provided without any legal responsibility or obligation to provide future updates. I accept no responsibility and no liability, whatsoever, for any direct, indirect, special, punitive, or consequential damages or loss arising from the use of my opinions or information. The information contained in a report, commentary, this website, interview, and other content is subject to change without notice, may become outdated, and may not be updated. A report, commentary, this website, interview, and other content reflect my personal opinions and views and nothing more. All content of this website is subject to international copyright protection and no part or portion of this website, report, commentary, interview, and other content may be altered, reproduced, copied, emailed, faxed, or distributed in any form without the express written consent of Michael S. (Mickey) Fulp, MercenaryGeologist.com LLC.
Copyright © 2019 Mercenary Geologist.com, LLC. All Rights Reserved.


