Again To Gold When Stocks Explode?


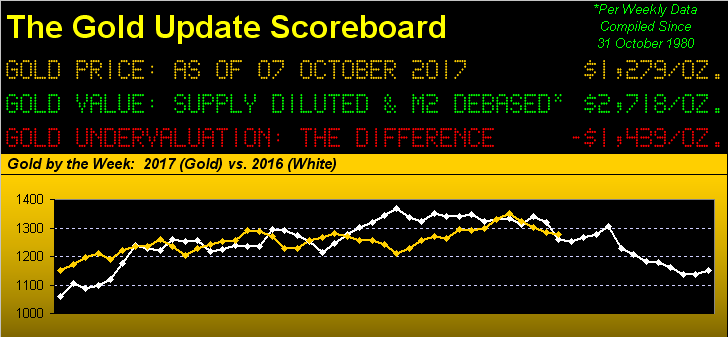
Am I surprised that from exactly one month ago (21 trading days) gold has dropped 100 points from its year-to-date high of 1362.4 (08 September), to yesterday's (Friday's) low of 1262.8 before settling out the week 1278.9? Yes. Am I nonetheless trusting that the infamous 1280-1240 box will hold, such that price shall then spring back up? Yes. That stated, as noted as week ago, 'tis becoming rather irksome, (one of Mum's favourite words when annoyed), to see per the above graphic gold's rather replaying last year "all over again" --(Lawrence Peter "Yogi" Berra). But as we've twice learned in this millennium, stock market crashes are good for gold, and as you know, we sense another is due to unfold.
'Course at we oft put forth, the good news is that 'tis far better to be positioned in something which has so much room to rise (i.e. gold) versus that which has so far to fall (i.e. the stock market): per this writing, our "live" price/earnings ratio for the S&P 500 at 43.3x is essentially its record high equivalent just prior to the S&P's full 50% "correction" which ran from March 2000 through October 2002, affectionately to then be dubbed the "dot.com" crash, within which time frame gold rose as much as 42%.
From then, fast forward through the intervening 57% "FinCrisis" crash of October 2007 through March 2009, within which time frame gold rose as much as 20% inclusive of having to bear its own damage during that Black Swan Event, and here we are today -- at least by our purview -- ready for the S&P to crash all over again.
Query: given the FinMedia and analysts going on and on about earnings "strength", shouldn't the S&P's p/e therefore be declining rather than rising? Recall that of the 446 S&P 500 companies which reported during Q2 "Earnings Season", only 216 of them (48%) bettered their bottom line from Q2 of the prior year. Earnings "strength"?
Back in the Spring of 2014 in the midst of rising stock prices lacking earnings support, we were writing about being on "crash watch"; such condition since then has markedly amplified itself ... and yet ... 'tis almost as if no one sees it. To quote George Kennedy (as Ben Bowman) whilst peering through his telescope in the film "The Eiger Sanction" ('75) at the climbers on the monstrous Swiss mountain, its rocky surface about to be covered with a sheet of ice: "They won't even know it's coming until it hits."
Combining the fundamental lack of real earnings with ridiculously-stretched technical measures, the S&P is the most overbought I've ever seen it, money managers playin' loose and fast with their clients' cash, on the threshold of the "Look Ma! No earnings!" crash. Or perhaps within the ensuing whining 'twill go down as the "They Didn't Tell Us The Truth!" crash: that would fit in nicely with the declining Economic Barometer at which we'll shortly look. You may have even seen the Reuters piece this past week that "U.S. investors are not rewarding companies for generating good earnings consistently, opting instead for a stockpicking strategy that might be called 'growth at a high cost.'" Like one's entire savings? Either way, in the spirit of last week's missive wherein we brought back one of our dire domino sets, let's bring back another as well:

(Note: for those of you scoring at home, the overnight limit down on the S&P 500 futures contract remains 5%, which is at present would be -127 points, or some -1,100 "Dow" points: and that's just to get the market open come the morning).
At present for gold, we turn to the weekly bars and see the ascending parabolic Long trend now getting teased by lowering price nine weeks into the blue dots' upside run. As stated in the graphic, a move in the ensuing week below 1263 and that trend flips to Short. True, gold did well in rebounding 16 points off Friday's low to practically sit back atop the 1280-1240 box. Still, we know Octobers past on balance have not been not friendly for gold. The gauntlet has thus been thrown for King Gold to rise to the month's challenge; (and a stock market crash would give it that chance):
Next we've gold's daily closes from the All-Time Closing High of 1900 some six years ago. The various horizontal measures along with the almost flat 300-day moving average show us just how "boxed in" price has become when revisiting this area time and again. Still, the overall trend from the lows of 2015 remains up:
And what remains down is the trend of the Econ Baro:
"But that's a pretty good turn off the bottom there mmb..."
Squire, as you know, the Baro tends to oscillate more than trend endlessly in the same direction: a good example of that is when (to coin an old economic adage) "things are getting worse more slowly", such conditions can cause the Baro to rise. Moreover, there were some good turn-around reports which came in this past week, despite the hurricane-affected loss in non-farm payrolls of 33k. To wit: September's Hourly Earnings sported a spritely gain from August's 0.2% growth to 0.5%; the Unemployment Rate fell from 4.4% to 4.2%, (albeit there's the uncounted folks dropping from the workforce which can belie that measure); the Institute for Supply Management's readings for both manufacturing and services increased; vehicle sales marched higher; and for August there were whirl-around changes from negative to positive in both Factory Orders and Construction Spending. Thus we've that most recent rise in the Econ Baro.
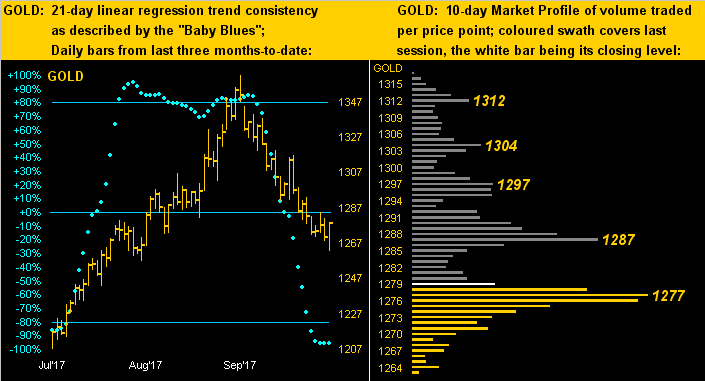
Time to rise as well for the precious metals? To the following two-panel chart of gold we go. On the left are gold's daily bars from three months ago to date: note that the baby blue dots of 21-day linear regression trend consistency have bottomed. That does not preclude price from further falling; but once the dots commence their upward curl price shall hopefully be out of peril. On the right in gold's 10-day Market Profile, for the first time in the past few weeks we find price not buried at the bottom the stack, but rather at the high of Friday's trading swath. As labeled, the initial upside challenge is to re-take 1287:
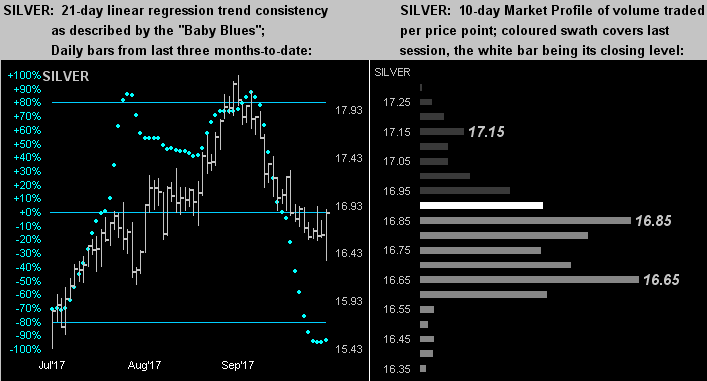
The picture is much the same for Sister Silver, yet Friday's resilience was sufficient to already provide some lift to her "Baby Blues" (left). And as for her Market Profile (right), keep on reboundin' baby! Time for those mid-to-upper 16s to provide support:
We'll wrap it here with The Gold Stack. Again, note the abundant nearby levels 'round the row labeled "Gold Currently":
The Gold Stack
Gold's Value per Dollar Debasement, (from our opening "Scoreboard"): 2718
Gold’s All-Time High: 1923 (06 September 2011)
The Gateway to 2000: 1900+
Gold’s All-Time Closing High: 1900 (22 August 2011)
The Final Frontier: 1800-1900
The Northern Front: 1750-1800
On Maneuvers: 1579-1750
The Floor: 1466-1579
Le Sous-sol: Sub-1466
Base Camp: 1377
2017's High: 1362 (08 September)
Neverland: The Whiny 1290s
Trading Resistance: 1287 / 1297 / 1304 / 1312
10-Session “volume-weighted” average price magnet: 1286
The Box: 1280-1240
Gold Currently: 1279, (expected daily trading range ["EDTR"]: 14 points)
Trading Support: 1277
10-Session directional range: down to 1263 (from 1317) = -54 points or -4%
The Weekly Parabolic Price to flip Short: 1263
The 300-Day Moving Average: 1259 and falling
2017's Low: 1147 (03 January)
The entitled query thus stands: "Again to Gold when Stocks Explode?" Note the use of the word "when". One might not wish to look when it all goes wrong. Tick... tick... tick... (Gold! Gold! Gold!)

Mark Mead Baillie has had an extensive business career beginning in banking and financial services for two years with Banque Nationale de Paris to corporate research for three years at Barclays Bank and then for six years as an analyst and corporate lender with Société Générale.
For the last 22 years he has expanded his financial expertise by creating his own financial services company, de Meadville International, which comprehensively follows his BEGOS complex of markets (Bond/Euro/Gold/Oil/S&P) and the trading of the futures therein. He is recognized within the financial community of demonstrating creative technical skills that surpass industry standards toward making highly informed market assessments and his work is featured in Merrill Lynch Wealth Management client presentations. He has adapted such skills into becoming the popular author each week of the prolific “The Gold Update” and is known in the financial website community as “mmb” and “deMeadville”.
Mr. Baillie holds a BS in Business from the University of Southern California and an MBA in Finance from Golden Gate University.


