Ain’t Just Gold Been Headin’ Down…


Before we graphically elaborate on this week’s double-entrendre Texas-speak title, let’s be up front as regards a mis-guided inference from a week ago. Therein we wrote with respect to Fitch’s downgrading StateSide credit from AAA to AA+ that: “…it remains to be seen if raters Moody’s and S&P follow Fitch…” to which a charter reader of The Gold Update pointed out S&P already having dropped their rating to “AA+” 12 years ago. Given we command accuracy in all that leaves these fingertips, this correction is obligatorily warranted.
Now in transiting from Kings’s English to this missive’s title drawl of “Ain’t Just Gold Been Headin’ Down…“, we begin with the following graphic normally reserved for our month-end missives. ‘Tis our ’round-the-horn view of all eight BEGOS Markets across the past 21 trading days, (i.e. from one month ago-to-date). The day-to-day consistency of the grey diagonal trendlines is denoted by the baby blue dots:
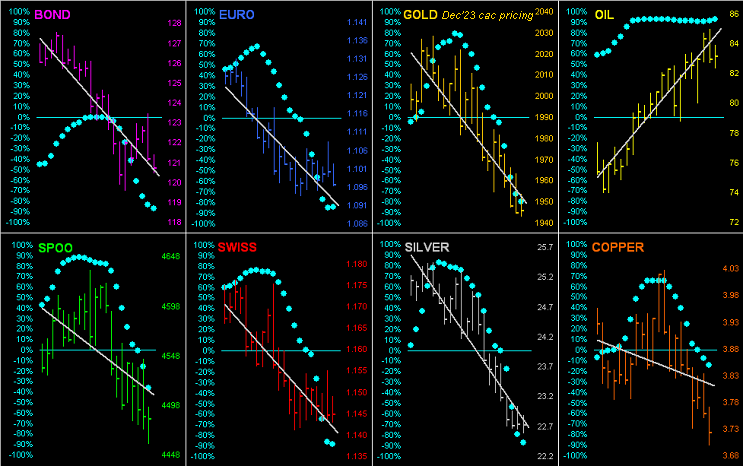
And quite clearly — save for Oil remaining bold even as the Dollar maintains a currency toehold — hardly is it just Gold that’s been getting sold; rather ’tis the balance of bunch, (again ‘cept for Black Gold).
Further, the firming Dollar suggests the Federal Reserve’s foot is “expected” to stay on the interest rate pedal, (or again as a long-time StateSide colleague would quip, the Buck continues to “lead the ugly dog contest”).
Indeed wholesale inflation — which for you WestPalmBeachers down there leads retail inflation — just recorded for July finds the Core Producer Price Index having made its largest monthly pace leap (+0.4% from June’s -0.1% to now +0.3%) since that for March 2022. Such suggests the Fed’s money noose looks to remain tight rather than return to loose. Recall too the Fed-favoured Core Price Consumption Expenditures Index through June still ran a bit in excess of the Fed’s 2% annualized inflation rate; the July PCE reading is scheduled for 31 August with the Open Market Committee’s next Policy Statement not due until 20 September. And a lot can happen (understatement) between now and then.
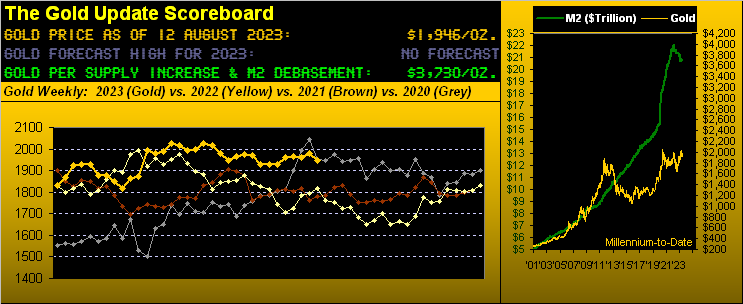
Within the debiting deluge we turn to Gold’s weekly bars and parabolic trends from a year ago-to-date. And even initially inclusive from two weeks ago of +40 points of December futures premium over spot, Gold has been unable to break above the red-dotted Short trend, price settling out the week yesterday (Friday) at 1946, (still +33 points over spot’s 1913 level). To break said trend in the ensuing week requires a rise of at least +43 points (from 1946 up through 1989), which technically is “in range” given Gold’s “expected weekly trading range” is now 50 points. Specific to statistics, century-to-date Gold is now in its 48th weekly Short trend, the average duration from 2001-to-date being 11 weeks, this current stint now 12 weeks. Thus if stretching for positives, one might opine that the current trend is getting a bit “short in the tooth, partner”…

Meanwhile, still “short” on establishing any kind of trend these days is the Economic Barometer, this past week’s 10 incoming metrics finding six having improved — and thus four having not — period-over-period. “But it’s an uptrend!”, they say. “No it’s a downtrend!”, they say. To be sure, the yo-yoing chop-chop continues it way:
‘Course, within the overall FinMedia rah-rah of inflation nearing the Fed’s 2% target such that another “pause” is in the offing, we’re nonetheless told that borrowing money to purchase real estate is nearing a cost of 7%. Why so high if inflation is so low? Seems quite the large income spread for the bank that pays some 3% to collect some 7%. Yet as Q2 Earnings Season drifts towards its close, in glancing at banks’ earnings, about 40% of those reporting had lower bottom lines than in Q2 a year ago. The good news is: at least that sudden spate of bank illiquidity during this past March quickly stopped, right? “Whew! That was close!”
As for the S&P 500, at least it finally is correcting, albeit thus far to a rather wee extent. From the year’s high of (4607) to yesterday’s low (4444) spans just -3.5%. And given our initial S&P Futures target from that top is 4455, having since reached down to as low as 4459, we’re nearly there, albeit as herein previously penned: “Other in-house measures suggest the 4300s.” As well, our “live” price/earnings ratio for the S&P 500 — which recently was nearly 60x — has come off, such reading now still an otherwise ridiculously-high 44.8x given annualized risk-free dough pays 5.265% at the three-month T-Bill window; (the yield on the “all-to-risk” S&P is now 1.526%). Still, we believe reversion to the mean will out: it always does. (Anyone remember the March 2009 month-end P/E of the S&P? 13.3x). Too as we tweeted (@deMeadvillePro) this past week, mind the website’s MoneyFlow page, its leading measures of late now weaker than the decline in the S&P itself.
“Also don’t forget that we’re getting close to September, mmb…“
A little seasonal spice there from our Squire. Indeed, September into October have on occasion been torrid times for stocks. Certainly the stars are well-aligned for fallout this time. But then again, they’ve been well-aligned as such since the days of COVID came to be with nary a material pullback to see.
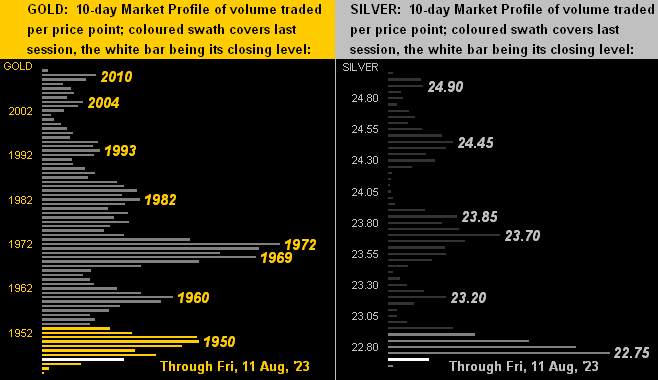
In the interim (short or long as it may be) what we can below see are the 10-day Market Profiles for Gold on the left and for Silver on the right. Therein we’ve present prices (Gold 1946 and Silver 22.75) buried at their respective bases. Moreover as noted in Gold’s aforeshown weekly bars, the Gold/Silver ratio is now 85.5x, the highest week-ending level since that on 23 June (86.0x). Again from the “Means Reversion Dept.” to price Silver via the century-to-date mean ratio of 67.7x puts it at 28.76, (i.e. +21% above today’s 22.75). Again: “Got Silver?”
So as these “Lazy-Hazy-Crazy Days of Summer” –[Nat King Cole, ’63] now work through the so-called “Dog Days of August” let us not be too remiss to “check out”. For the data drums continue with the ensuing week’s slew of 14 incoming metrics for the Econ Baro, including the Conference Board’s lagging “Leading Indicators” for July. Uptrend? Downtrend? The consensus leans to the latter.
Thus what’s on your platter? Hopefully Gold!
Oh nice touch there, Squire, on the Sam Pepys’ Silver plate!
Cheers!
…m…
www.TheGoldUpdate.com
www.deMeadville.com
and now on Twitter: @deMeadvillePro
********

Mark Mead Baillie has had an extensive business career beginning in banking and financial services for two years with Banque Nationale de Paris to corporate research for three years at Barclays Bank and then for six years as an analyst and corporate lender with Société Générale.
For the last 22 years he has expanded his financial expertise by creating his own financial services company, de Meadville International, which comprehensively follows his BEGOS complex of markets (Bond/Euro/Gold/Oil/S&P) and the trading of the futures therein. He is recognized within the financial community of demonstrating creative technical skills that surpass industry standards toward making highly informed market assessments and his work is featured in Merrill Lynch Wealth Management client presentations. He has adapted such skills into becoming the popular author each week of the prolific “The Gold Update” and is known in the financial website community as “mmb” and “deMeadville”.
Mr. Baillie holds a BS in Business from the University of Southern California and an MBA in Finance from Golden Gate University.


