Anatomy Of A Breakout


The following discussion sheds some light on the recent Gold breakout as seen in GoldHeart Waves.
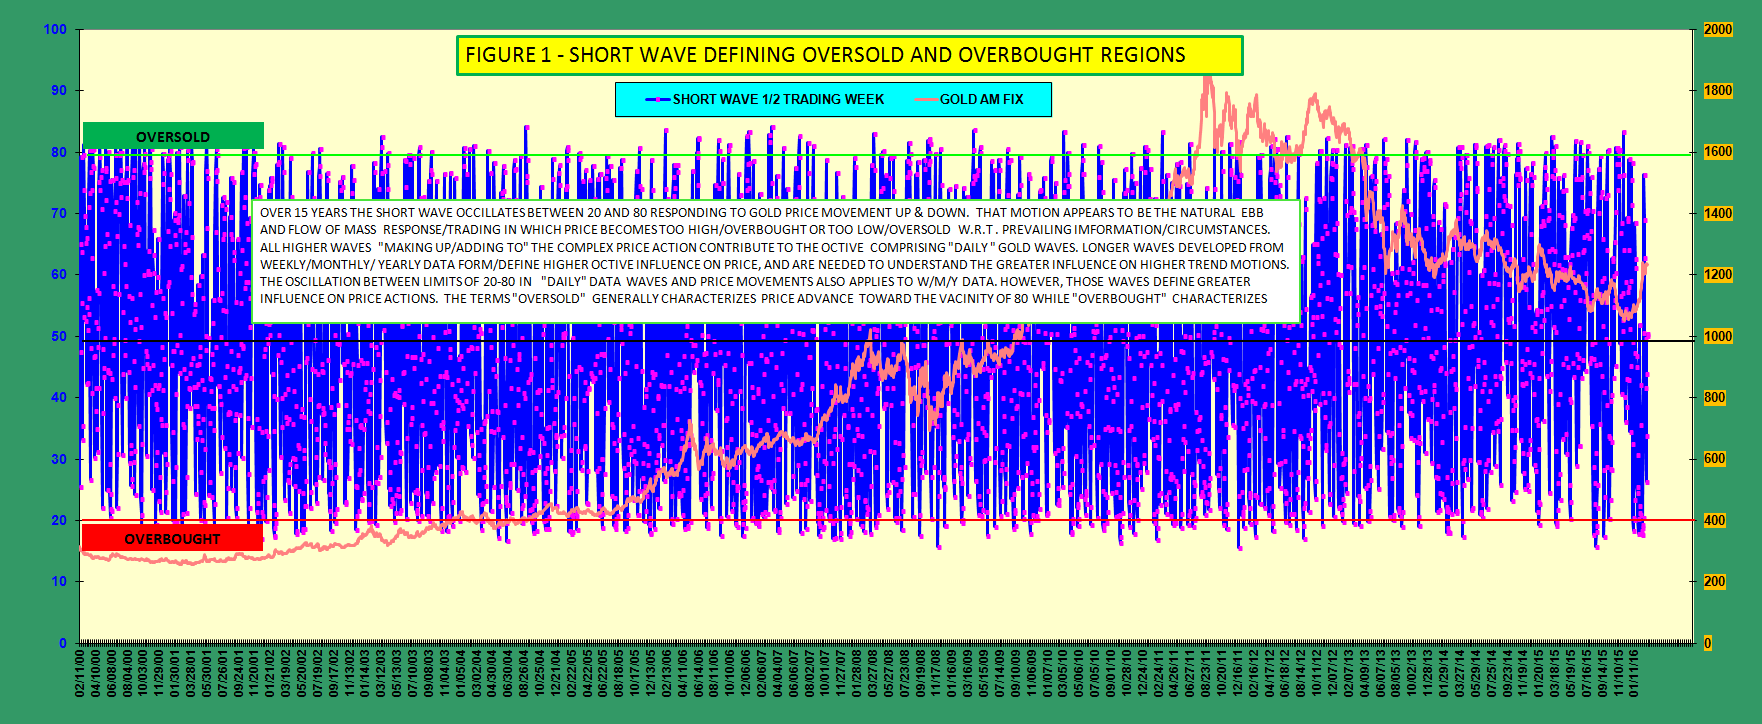
CONCEPT OF OVERBOUGHT/OVERSOLD LIMITS (Figure 1)
I've added Figure 1 as a quick refresher on the concept of overbought(OB)/oversold (OS) conditions used in the GoldHeart analysis for those that are new to the concept. Price action is broken down into cyclic motions that identify oversold/buying and overbought/selling opportunities. The range of this condition is based on a scale from 0 to 100. Above the neutral point of 50 is defined as oversold. Below 50 is overbought. The extent that a cyclic wave is above or below defines the relative condition of the Gold price in time. Ideally, the cyclic wave oscillates between OB/OS (80/20), but often reverses short of these limits.
The cyclic limits of the shortest wave used in analysis involving 8 primary waves per Yearly/Monthly/Weekly/ Daily Chart is 1/2 trading week. The regularity of this wave oscillation and its correlation with price movement was the basis for algorithms developed for cyclic analysis. Note the regularity on Figure 1.
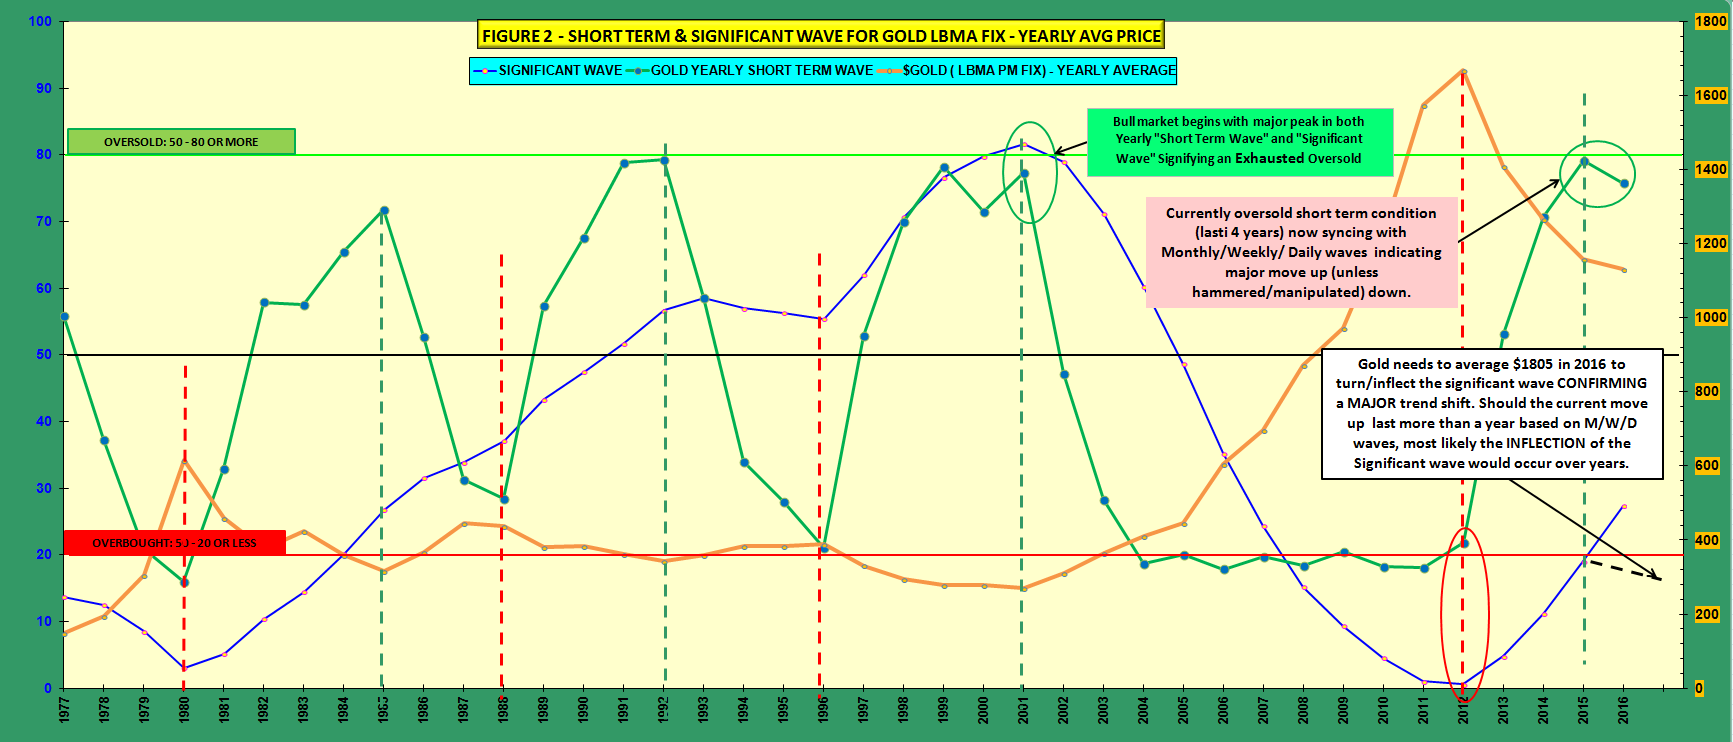
YEARLY CHART (Figure 2)
- Figure 2 displays the YEARLY "Short Wave" and "Significant Wave"(SW) history identifying the start of the 2001 Gold bull market breakout. From that point in time the waves cycled over several years and eventually reached overbought extremes in 2012, at which time both waves bottomed/reversed in extreme overbought turned. This ended an exhausted major cycle and peak in price. Subsequently, the tide changed and moved into a new period of major overbought correction. Presently, the (SW) now measures about 27 on the overbought scale, and is slowly working off the overbought condition.
- Should the YEARLY Gold fix average price reach $1805 in 2016 as shown, a new signal/(wave reversal shown) for a major oversold trend (similar to last) would be in play. This however would take ground shaking upward movement in price this year. Possible yes, but more likely in 2017/2018. It would depend on how the current oversold M/W/D waves develop and effect upward price movement. Hopefully, similar to the 2008-2012.
- It is highly likely that there will be negative attacks along the wave paths at strategic time points to break down/discourage price advances. This would result in needing more time for a healthy development of a YEARLY oversold condition. The immediate change affecting price is more visible the shorter Monthly, Weekly and Daily waves that build toward the major Yearly Wave change. Those waves appear very promising at this time.
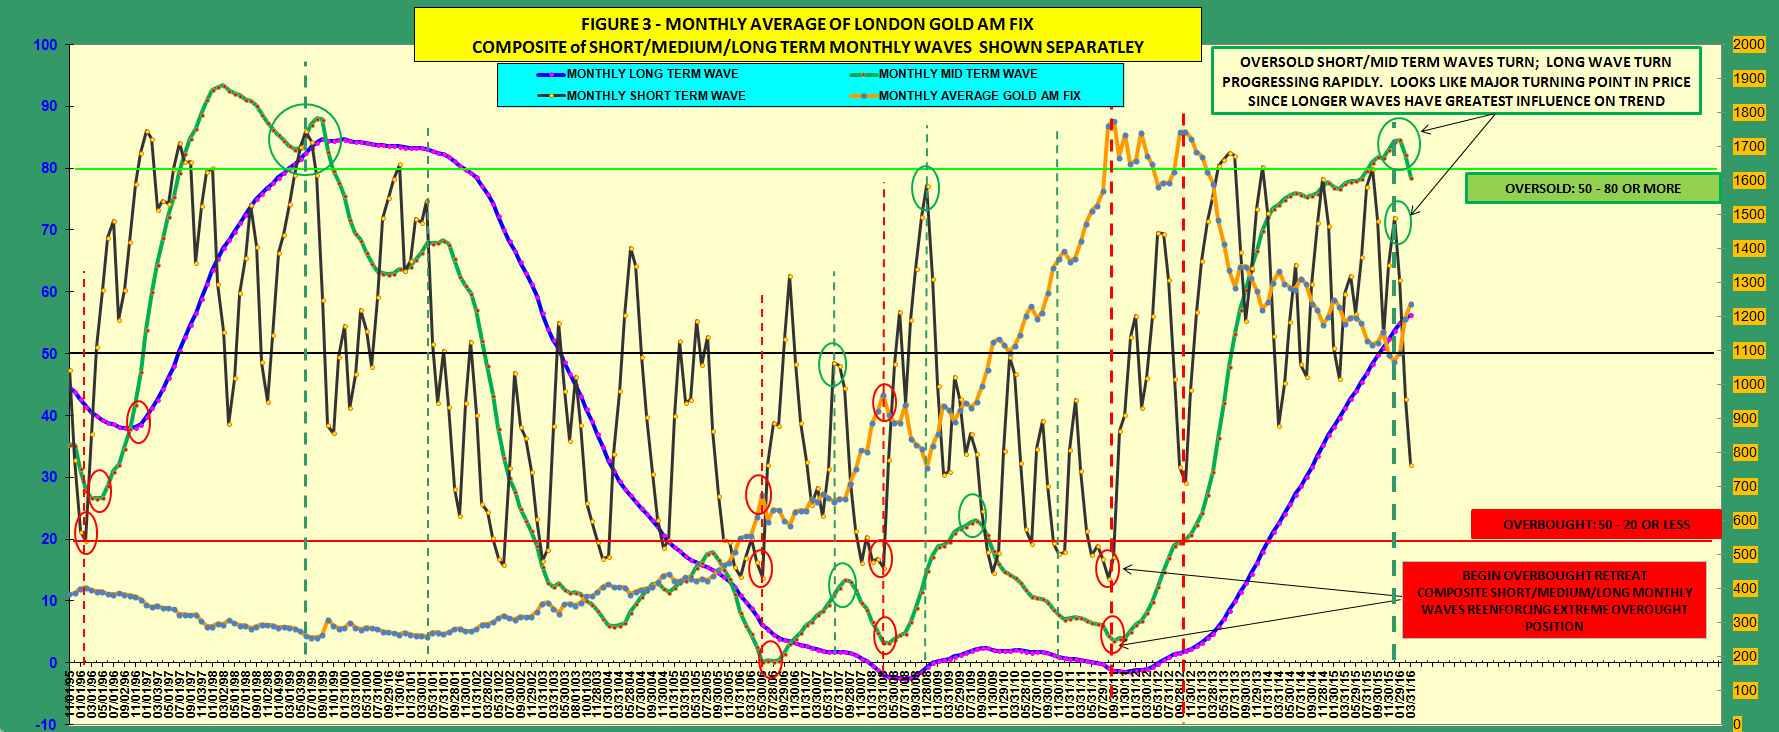
MONTHLY CHART (Figure 3)
- In the MONTHLY chart I have decomposed the SIGNIFICANT WAVE (SW) into the 3 waves used in building the (SW). These waves more clearly show the separate phasing of Short/Medium/Long Waves and their interacting/phasing effects on price movement. I have circled some typical turning points in price based on turns/phasing of those waves. Note especially, that when they sync and turn together at overbought or oversold times, the price movement is abrupt and clear in response. Seeing where waves are (relative to oversold/overbought conditions) allows one to sense when prices begin significant moves OR when they will be "hit hard" by negative forces sensing a critical time period. It's only when the YEARLY chart has tuned oversold that the effects of negative forces diminish.
- The recent breakout in price has been primarily based on Short & Medium term Waves shown in Figure 3 simultaneously turning oversold. Note that the Long term Wave reading at oversold/56 could roll over in a few months as prices rise during the current breakout. Overall, the MONTHLY trend looks very good at this time -- and a major factor confirming price breakout.
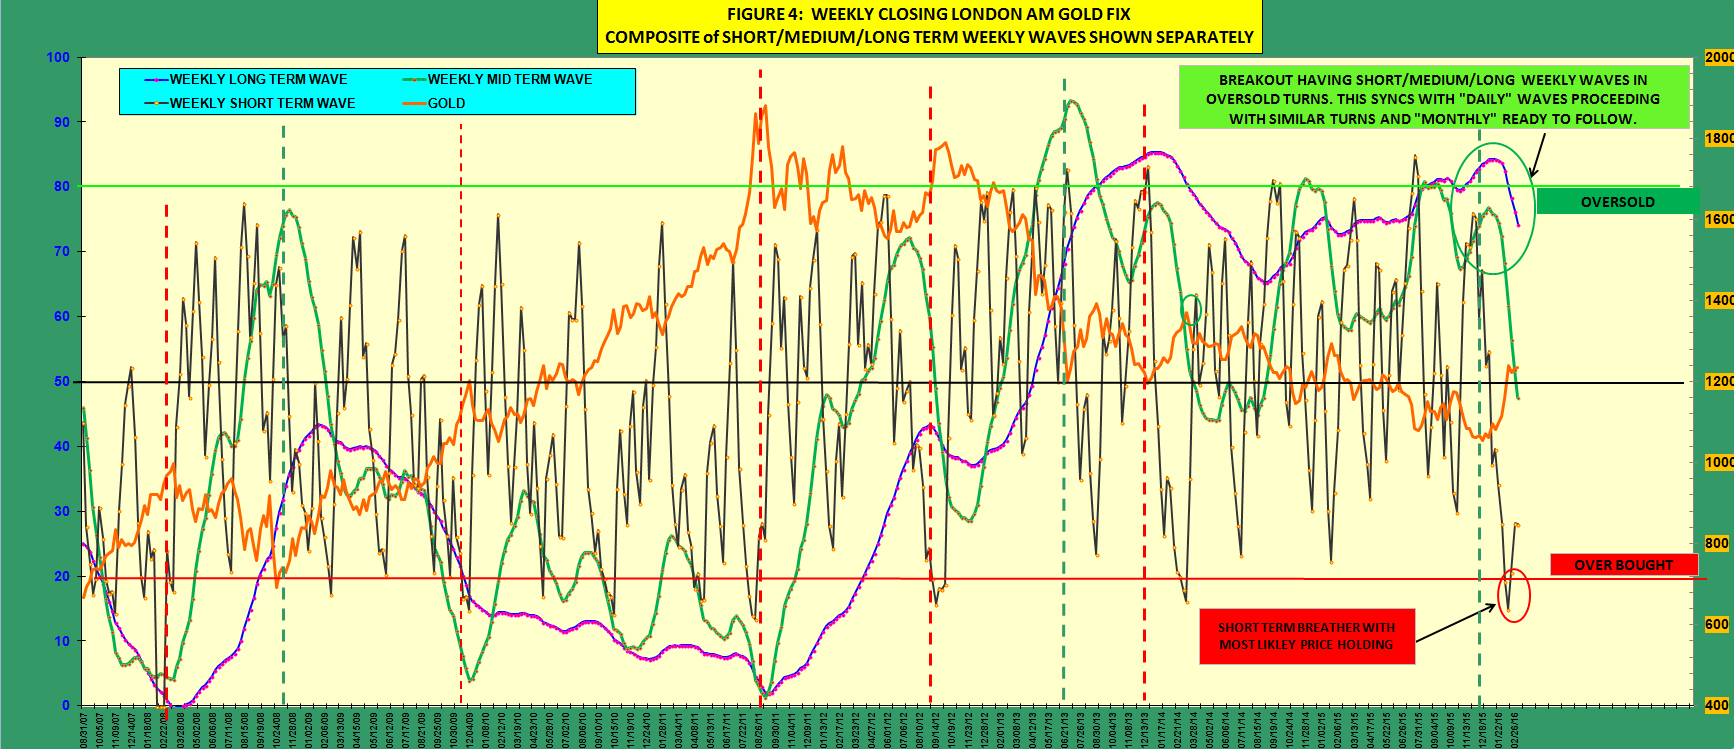
WEEKLY CHART (Figure 4)
- The Weekly chart also indicates separated Short/Medium/Long Waves that have turned similarly to those on the Monthly chart. These are shorter waves than Monthly, and are now phasing with Monthly waves. Note that the Short wave turned first, with Medium & Long waves following soon after. The current syncing of the Monthly/Weekly waves at this time reinforce the observation that a significant oversold breakout has occurred at this time.
DAILY CHART (Figure 5)
- As all the other charts were being readied for an oversold price rise, the moment of birth can be seen on the DAILY Chart /SIGNIFICANT WAVE occurring on 12/21/15. This turn delivered our Christmas present and lead the way to oversold turns in WEEKLY & MONTHLY charts that followed reinforcing the birth of the breakout. You can begin to see how these price movements are cyclic and made rational.
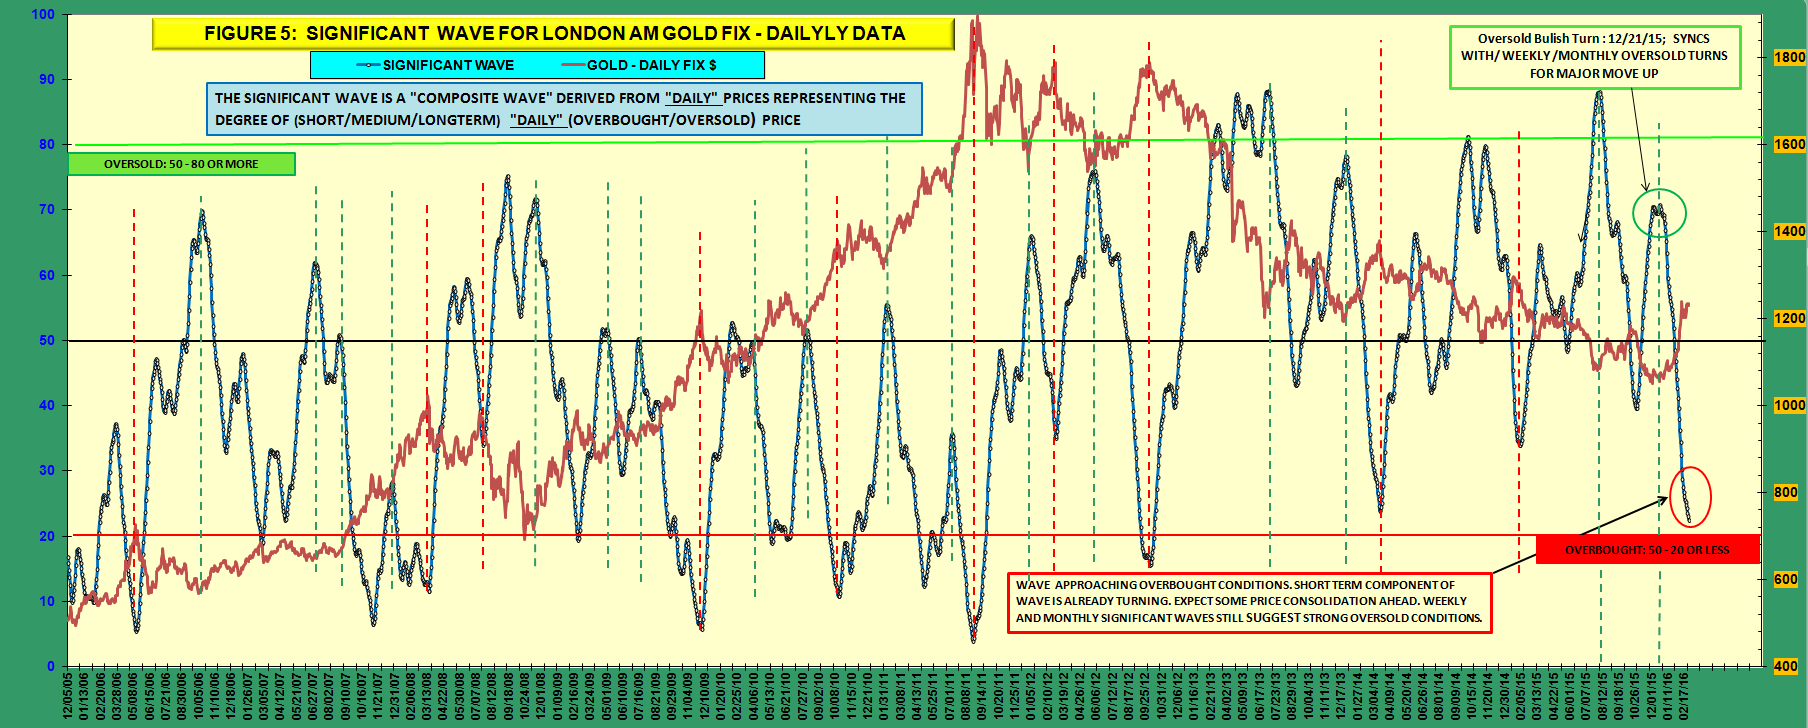
CURRENT NOTE: If you focus of the SIGNIFICANT WAVE on the DAILY chart, and the SHORT WAVE on the WEEKLY chart, you will notice we are approaching overbought conditions in the short-term and are currently experiencing a turbulent price environment. However, I believe the longer waves on all charts should carry us through this period…and in time, result in a decent price rise.
Will advise when critical change is on the horizon. GoldHeart


