And on the Seventh Day Gold Rested


In respectfully gleaning from said genetic phrase, we query: might one classify Gold's sevenday +158-point move from the 03 November low of 1618 to the high yesterday of 1776 as "biblical"? Perhaps a bit of a stretch that ... but it wasn't bad. Now that you're curious to know, let's put this move's stint into context across the past 50 years as follows; again, these are seven-day low-to-high moves:
■ Points-wise, +158 ranks 28th-best, so as to be in the 99.8th percentile
■ Percentage-wise, +9.7% ranks 189th-best, so as to be in the 98.4th percentile
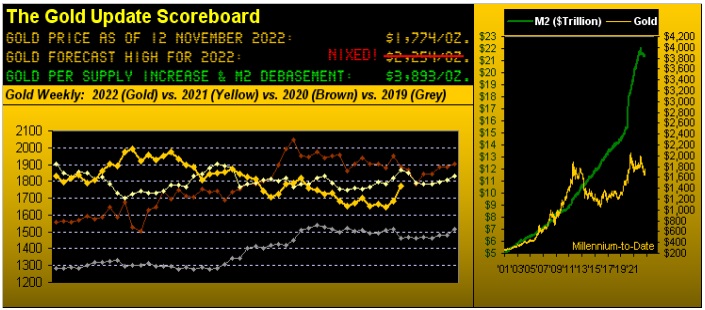
So yeah, by either measure, that's pretty good ju-ju. Yet as you ad nauseam know: "change is an illusion whereas price is the truth." And Gold obviously needs many more such moves toward truth just to gain the opening Scoreboard's present currency debasement value of 3893. For even in settling this past robust week yesterday (Friday) at 1774, the price of Gold today is but 46% of its valuation.
By comparison, the S&P 500 based on average earnings generation is priced today at 166% of its valuation. (Do not go there).
As to the rational for Gold having just recorded its best net up week (+5.3%) since that ending 09 April 2020: did Gold just GO! in a terribly tardy response to years of currency debasement (i.e. is this IT?); or was Gold merely caught up as "just another commodity" in Thursday's communal price surge?
Gold on Thursday alone posted a net gain of +2.9%; but not to be left out were the S&P 500 + 5.5%, the Bond +3.1%, Silver +3.0%, Copper +2.7% and the Swiss Franc +2.2%. Regardless of whether Gold was -- or was not -- simply an "also-ran", the pump was enough to dump Gold's weekly parabolic Short trend into the dust bin, and in turn herald a fresh parabolic Long trend per the rightmost blue dot in our bars by the week from a year ago-to-date:

And as herein written a week ago, such flip from Short to Long would put "...Gold en route to a retest of the 1800s..." As Stewart said to Mr. P in the iconic 1999 Ameritrade advert: "Let's light this candle."
As to duration and "how far up is up": for the past 10 parabolic Long trends the average and median duration are both 14 weeks. But of more import: the median gain in points is +149 which added to the current 1774 price = (drumroll please) 1923. Why is that number so familiar? Because 'twas Gold's All-Time High in 2011 that lasted for nearly 13 years. Yet first things first: Gold initially faces structural resistance from 1785-to-1883, (just in case you're scoring at home). Nothing is easy.
'Course Thursday's across-the-board price party to celebrate the suddenly dead Dollar was in response to retail inflation having been deemed as "slowing" even as the so-called Consumer Price Index's "headline number" of a +0.4% pace in October was the same as the +0.4% pace in September. So no receding of inflation there...
"But it was the Core CPI reading being only half what it was that caused the rallies, mmb..."
Ah yes, Squire, 'twas that infamous "Neither Do We Eat Nor Drive" number that set off the euphoria, October's "core" reading being just +0.3% versus +0.6% for September. One wonders if such nonsensical statistic shall yet again come under scrutiny to be scrubbed, given it unrealistically being really rather silly, (unless you live in a self-sustaining yurt ... and yes we have at least one valued reader that actually does).
Further, hardly is the CPI (full or core) the Federal Reserve's favourite gauge of inflation. As you regular readers know, their focus is on the Core Personal Consumption Expenditures Index which two weeks ago as reported for September was +0.5%. October's read arrives on 01 December, (the early forecast for which is to remain steady from September, i.e. again, no receding of inflation there).
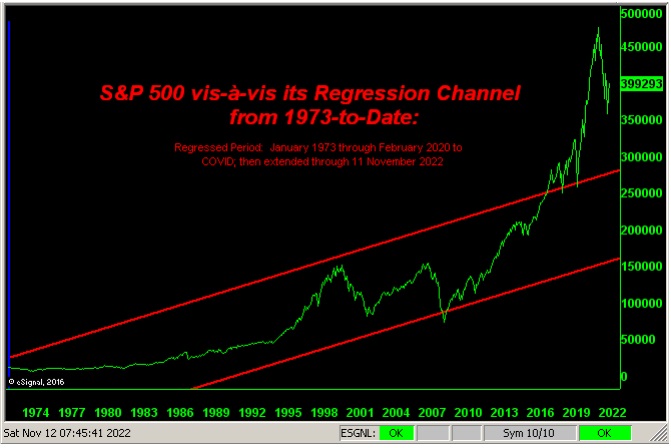
But the stock market didn't care. This past Thursday's 208-point rise in the S&P 500 was its third-largest daily net gain in history, (and the +5.5% percentage net gain 15th-best in better than 50 years). In turn coming off a mediocre Q3 Earnings Season, the honestlycalculated "live" S&P price/earnings ratio today of 37.1x remains as excessively high as ever, especially given U.S. Treasury dough pays 4% as a riskless investment, (barring Old Yeller yelling for help). So keep watching this space as 'tis a long way down to the mean:
Too by this next graphic, "had COVID never happened", 'tis a long way down as well for the S&P to its regression channel; (recall that the amount of created COVID relief money essentially equaled the ensuing market capitalization increase in the S&P 500; else we'd likely still be in the channel):
But wait, there's more: this is the cumulative points difference for the past three months-todate of the S&P's MoneyFlow relative to the Index itself. A favourite leading indicator of ours, that's a big difference, indicative of eventually lower levels:
Then there's the Economic Barometer which via Q3 data has had a substantive lift of late. But should that sudden rightmost down-hook be of concern? We'll find out if next week's slate of 17 incoming Econ Baro metrics can "straighten it out" so to speak. To be sure, whether or not inflation actually is abating, the StateSide consumer is battening down a bit: Consumer Credit -- a key measure in economic participation -- slipped in September for the fourth month in the last six, and the University of Michigan's "Go Blue!" Sentiment Survey initially for November just dipped the most since June's initial read. Even ChinaSide, their goods (i.e. "everything" sold at Walmart) are in less demand. Too, we read of significant job reductions in the thousands at huge-cap S&P companies, (i.e. Amazon, Faceplant...) Then with mortgages, cars, and variable rate loans, the Fed's interest squeeze of "pain" is making itself felt. Thus: is there really that much about which to be cheering?
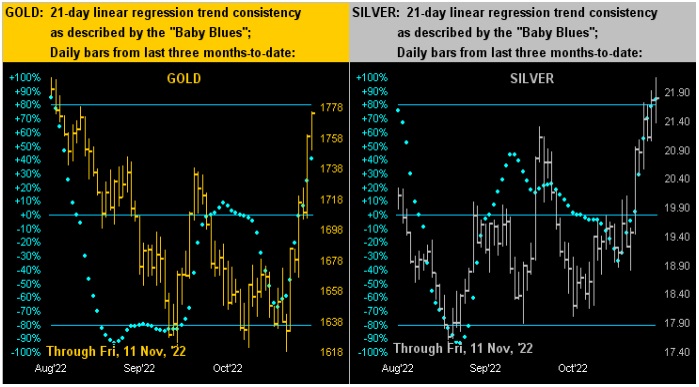
'Course, investors' cheering the precious metals these past couple of weeks is most deserved. We've noted on occasion over the years that Gold and Silver -- unlike most markets -- tend to rise faster than they fall. (For example: Thursday's spike in the S&P was quite the rise; so wait'll we see the steepness of stocks' next fall). Yet across the daily bars for the past three months-to-date for the yellow metal on the left and the white metal on the right, the rises are steeper than the falls. And the baby blue dots of trend consistency clearly are reinforcing for the uptrends. What we don't know is upon the next creaming of commodity prices -- notably should recession return -- if Gold and Silver alone can stay aloft; they didn't so do during this year's Q1 and Q2 recession. But for the present, this graphic looks great, especially with the aforeshown weekly parabolic trend for Gold now newly Long:
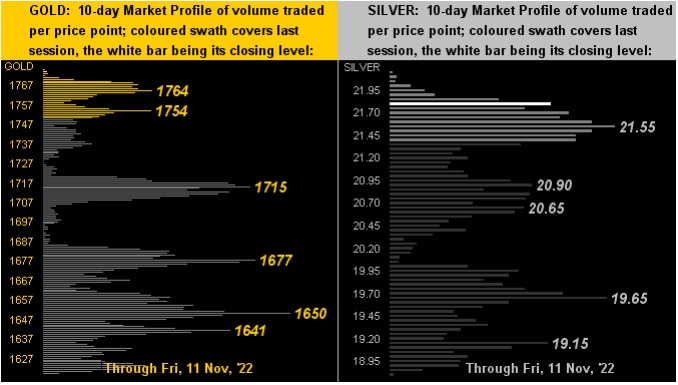
And as for the 10-day Market Profiles for Gold (below left) and for Silver (below right), the underlying trading support prices stand numerous and stark as labeled:
We'll close with a COVID-related note. After all, "'tis the season", right? In this part of the world, France's Academy of Medicine noted a week back that returning to masques is judged as "necessary" in facing the "triple epidemic of COVID, bronchitis and the flu." 'Course as the Academy does not make law, we'll see how their recommendation is accepted by the "Once We Gotcha, We Gotcha Dept." Then StateSide, from "The Opposite Ends of the Curve Dept." came a report this past week from Dow Jones Newswires that "Covid’s Drag on Workforce Proves Persistent" and "The virus is still keeping millions of Americans out of work..." But yet we then further read that more and more full-time workers are going for second part-time jobs such as to keep their income up with the cost of inflation. So what does it all mean? Apparently, millions of folks are not working even as they seek second jobs. Probably comes down to who's counting whom. From our view, here are some abaci upon which you can count: Gold and Silver!
Cheers!
...m...
********

Mark Mead Baillie has had an extensive business career beginning in banking and financial services for two years with Banque Nationale de Paris to corporate research for three years at Barclays Bank and then for six years as an analyst and corporate lender with Société Générale.
For the last 22 years he has expanded his financial expertise by creating his own financial services company, de Meadville International, which comprehensively follows his BEGOS complex of markets (Bond/Euro/Gold/Oil/S&P) and the trading of the futures therein. He is recognized within the financial community of demonstrating creative technical skills that surpass industry standards toward making highly informed market assessments and his work is featured in Merrill Lynch Wealth Management client presentations. He has adapted such skills into becoming the popular author each week of the prolific “The Gold Update” and is known in the financial website community as “mmb” and “deMeadville”.
Mr. Baillie holds a BS in Business from the University of Southern California and an MBA in Finance from Golden Gate University.


