April 2013 Revisited


Two dates in the history of the precious metals will stand out above all others for some time to come – April 2013 and August 2020; two occasions when the price of gold fell $200 in one shot. The two events differ in some essentials, but also share a number of similarities. Both offer possible evidence of collusion in the markets. The 2013 event was to resume and accelerate a bear market. Now the objective was to buy time by interrupting a strong bull market. So far, nearly a week later, prices are holding to their steeply rising trend gradients. Should these trends, as discussed a week ago, continue to hold until early in October, projections for gold above $2200 and silver above $40 at that time remain in place.
Globally the number of new COVID-19 infections remain quite constant, while the number of deaths decreases slowly. In the US, both rates are holding steady on a plateau, with no clear decline in sight. This does not bode well for the economy. It is reasonable to think that the lack of control and of measures for personal safety during rioting and protests have something to do with this. If that happens to be true, the odds of a slowdown in the rates of new infections and deaths before the election November are good – and, perhaps depending on the result, for longer.

For many years, commentators on the PM markets have said, “Be patient and wait until the supply of gold and/or silver has become so tight that the Big US Banks can no longer control metal prices through the Comex futures exchange. Only then their prices can increase to properly reflect market forces of supply and demand.”
When the price of gold was suppressed to near $250/oz during 2000-2001 (which is another story that has been told here), the gold mines were no longer profitable and supply fell away. The price of gold rallied steadily to about 2008 when the Great Financial Crisis wiped billions from balance sheets in all global currencies. This loss ignited increasing demand for valuable hard assets so that the price of gold rallied steeper and was joined by the price of silver.
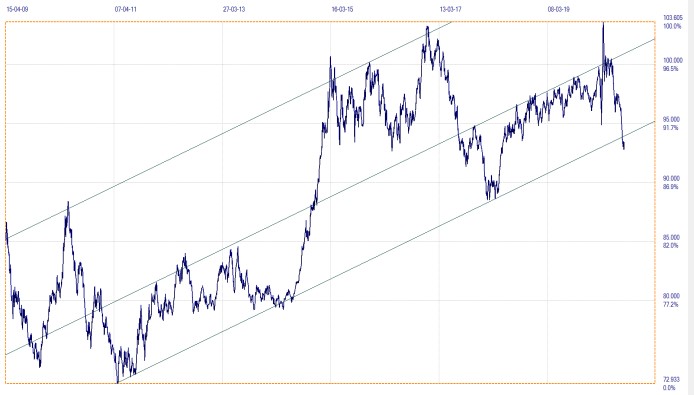
Their prices reached all time highs in 2011 and, conversely, the value of the US dollar against a basket of other currencies fell to a low of 72 as measured by the dollar index. This created panic in the upper reaches of the US and the “Hounds of Hell” were let loose on gold and silver.
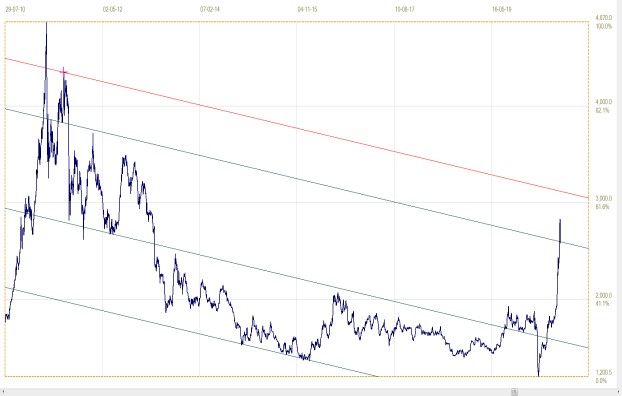
Dollar index Silver
The two charts show the recovery in the value of the dollar post-2011; slow at first while silver held well above its price in 2008. Then, as silver plumbed the depths after April 2013, the dollar managed to rally steeply. Gold did not fall as far as silver nor remained low as long, which as early as 2016 was evidence that silver was the bigger threat, as recounted here on a number of occasions.
However, when in 2013 metal prices started to recover from the initial attacks and the dollar was still weak, it was not tolerated. In mid April a massive attack was launched. If memory serves, in two days of consistent selling of contracts on the Comex futures exchange, contracts approaching 2.5 years of gold production was dumped onto the market irrespective by how much the prices fell.
On 11 April, gold was fixed at $1565. US insiders must have been alerted to what was going to happen, as shorting had the London PM fix at $1535.50 on the 12th. Then the selling started later during US trading and continued the next day to have the London PM fix on the 13th at $1395 – down by $170 (10.9%) from the fix on the 11th, with intra-day spikes reflecting greater loss. Since then, every gold rally was capped; silver – with fewer above ground reserves than gold and beginning to feature more in micro-electronics and medicine – being suppressed even more than gold while loaded with higher margins on Comex.
Then, later in 2015, the long awaited squeeze on available metals gradually took hold. Initially, the prices could still be controlled. However, by 2018 the price of gold started a sustained if slow rally. The silver price continued to drift sideways and lower and completed a double bottom at $14.40 in May 2019, before starting its own rally. Attention was then focused on a brave and wealthy investor who had purchased a very large number of March 2020 options on silver – presumably when the price of silver rallied into 2016 - with strike prices that by then were well in the money. The cost of the options was several millions of dollars and the potential profit by that time multiples of the premium amount.
By late February, the price of silver had risen to $18.75, probably delivering $3 to $4/oz on many thousands of contracts, each of 5000ozz of silver. It is no wonder the Big Banks which had sold the options were in a panic. On March 10th the price of silver futures was $17.07/oz. When the intense attack of the next few days on silver was over on the 19th, the price was $12/oz, lower by nearly 30%. There, as always, has been no official investigation of this event that brought any guilty party before the courts. The blatant manipulation of gold and silver prices clearly has official US sanction, even when the Banks protect their own interests!
Forward to the present.
On Friday 7 August, the prices of gold and silver set new highs in their rallies that had started late in May. In London, gold fixed at $2031.15, silver at $28.33/oz. Interestingly enough, the high PM fix for gold was at $2067.15 on Thursday, 6 August. Similar to what happened in April 2013, when on the day before the Big Attack the gold price dipped lower, as if insiders were shorting the price.
On Monday, 10 August, Comex announced hefty margin increases on gold and silver contracts. This change forced over-exposed speculators to sell enough of these positions to meet margins on the rest. Small traders who can barely afford one contract, had to close. One report had it that a very large volume of silver contracts was dumped onto the market as well, which resulted in very high trading volumes. On Wednesday 12 August, after almost three trading days since the margin hike, the gold PM fix was at $1931.90 and the silver fix at $25.81 – lower by $135 (-6.6%) from gold’s high fix on the Thursday and by $2.46 (-8.7%) from silver’s Friday fix; both with much lower intra-day prices.
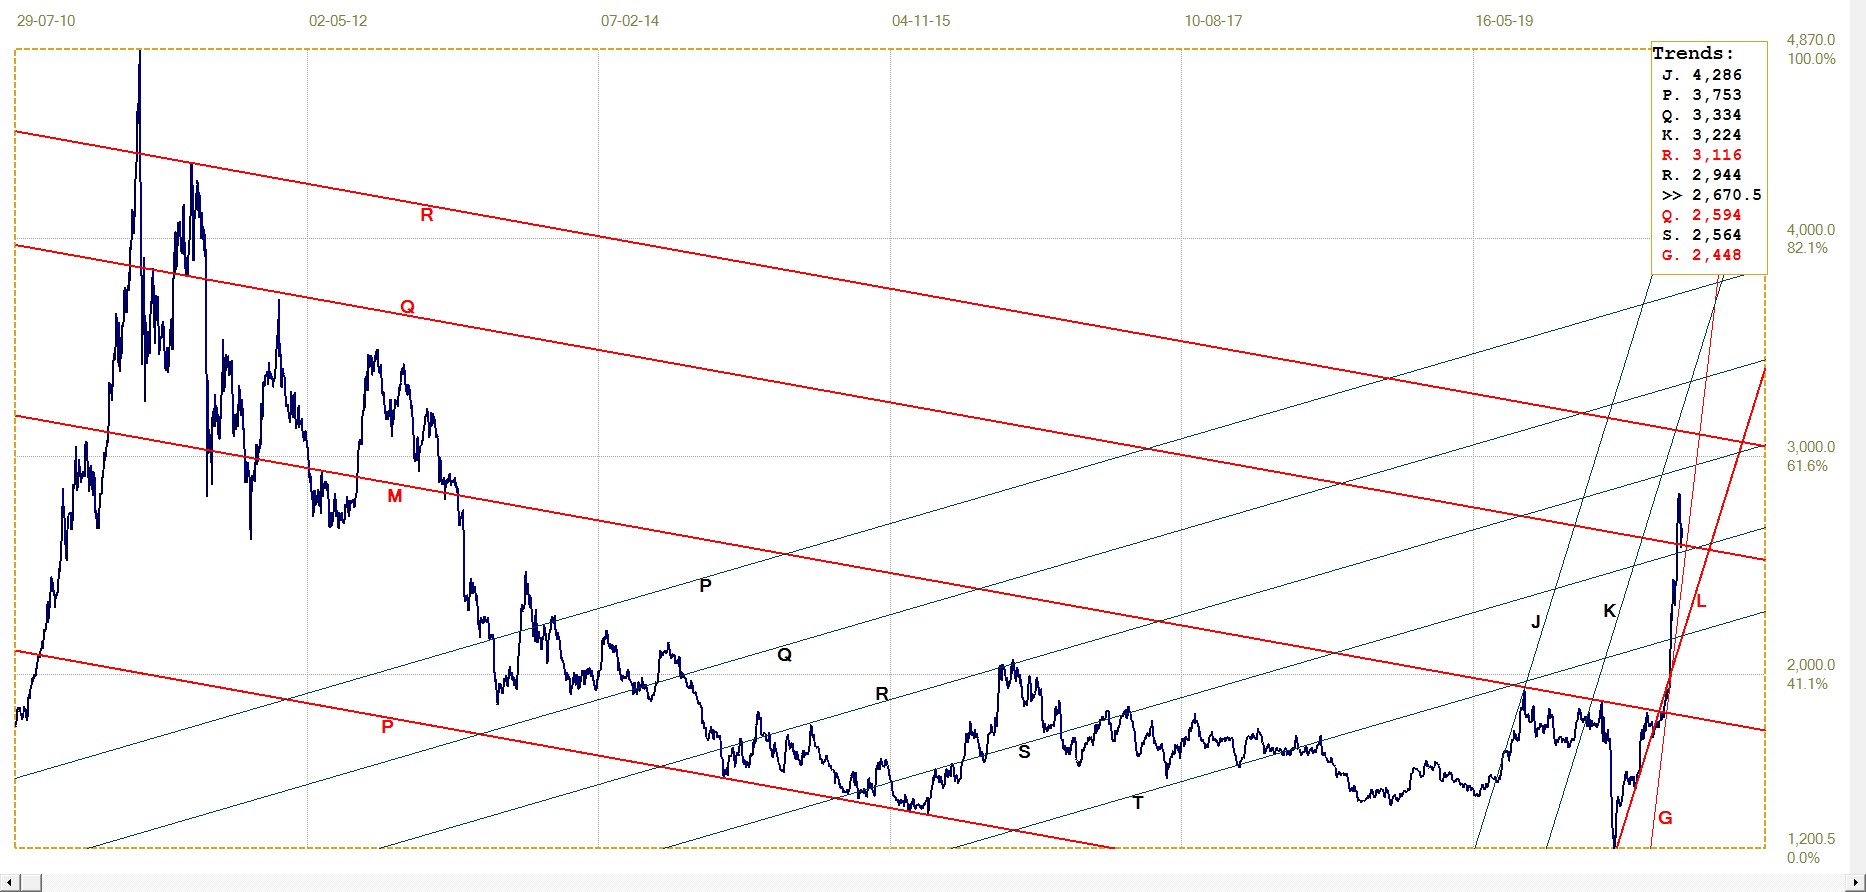
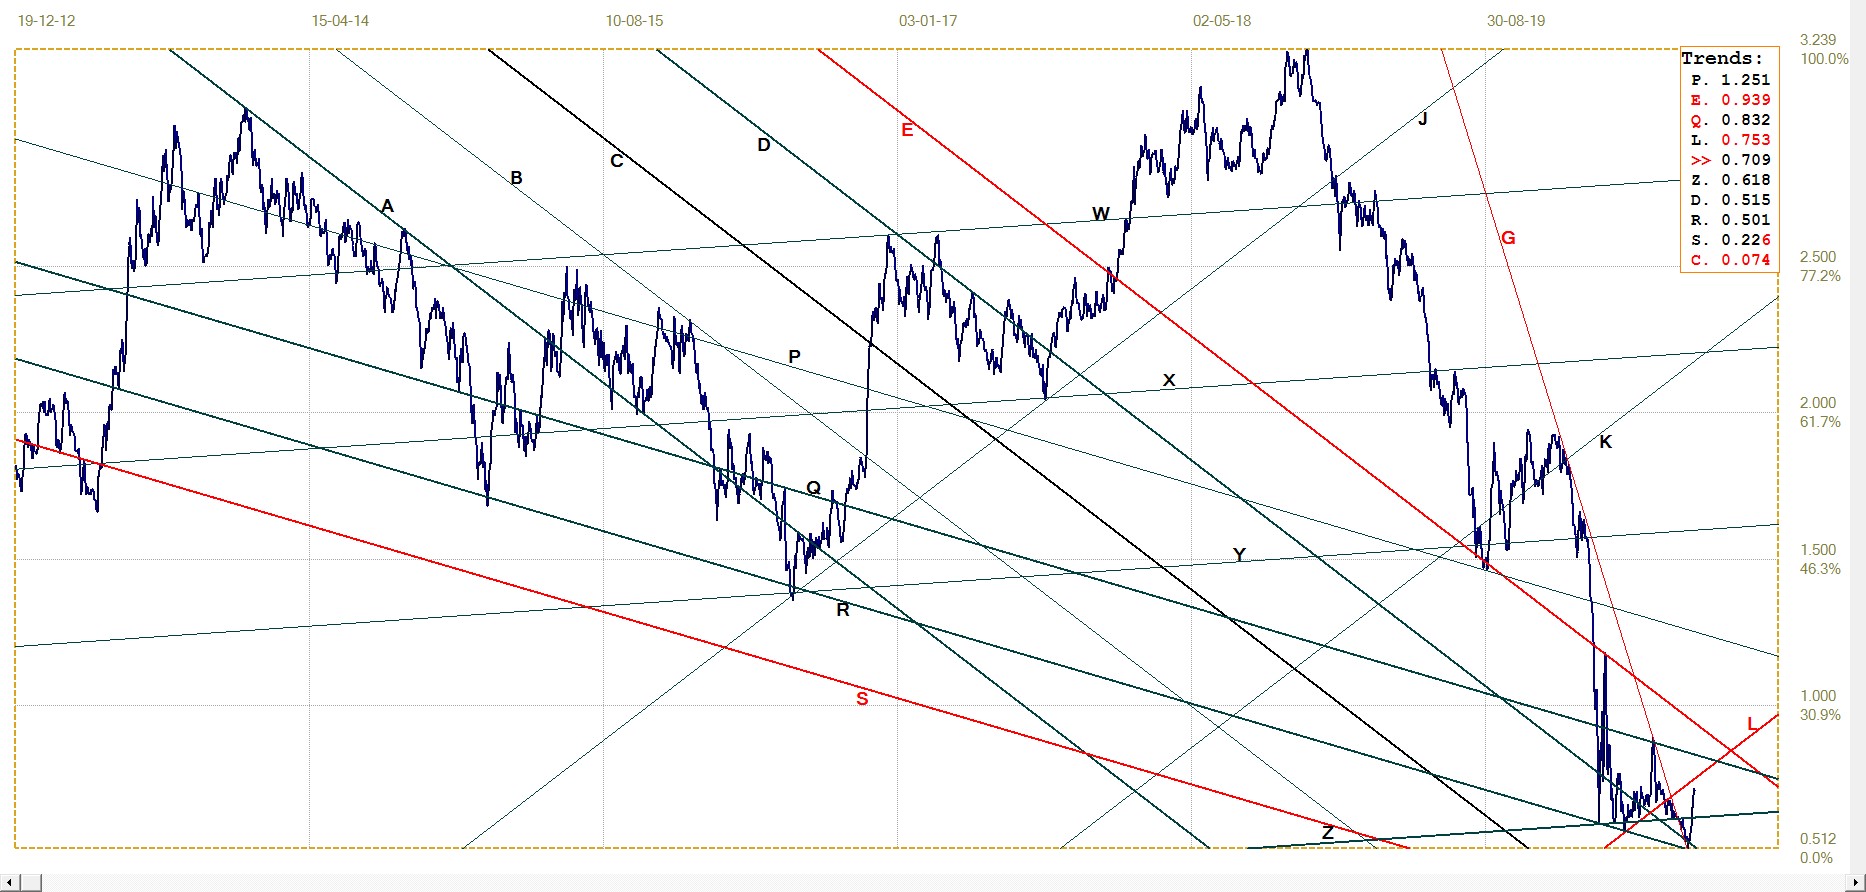
In my US Markets report of 9 August, after the recent highs of the metals, two charts were used to project where the prices of gold and silver could be early in October should their recent steep trends – as indicated by steep trend lines that are part of the established patterns – be sustained until then. The trends and projections are intact as long as the two steep trend lines are intact. The later parts of the charts updated to Friday are reproduced below.
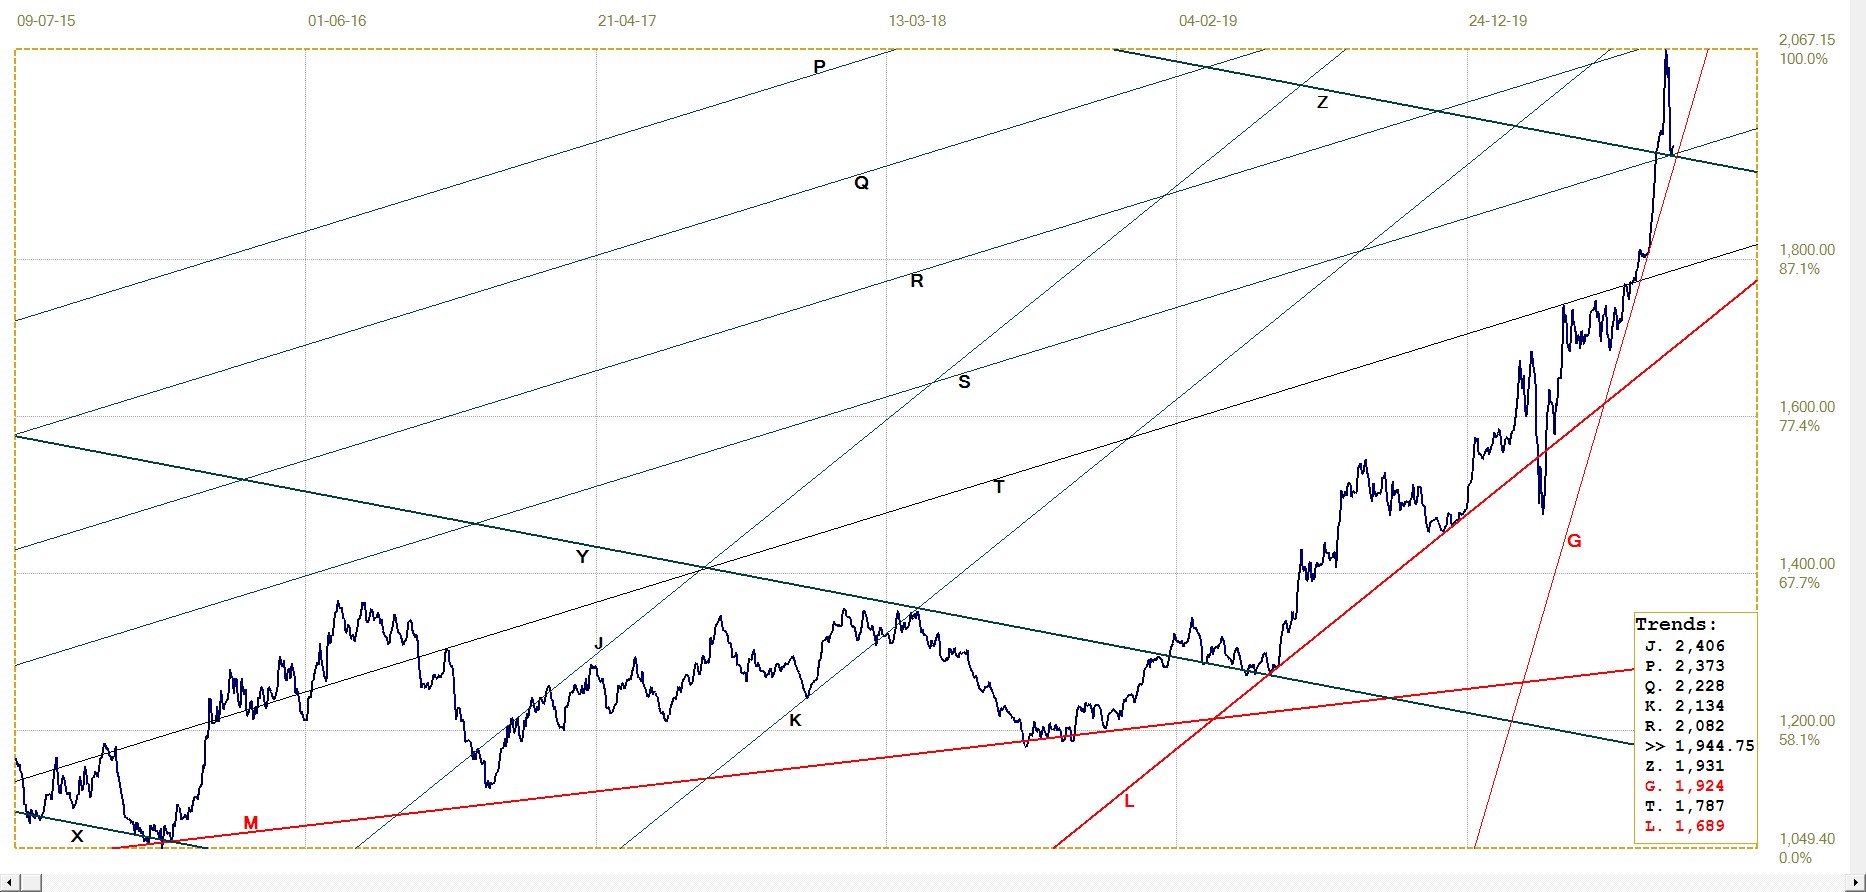
Gold price. London PM fix. Last = $1944.75
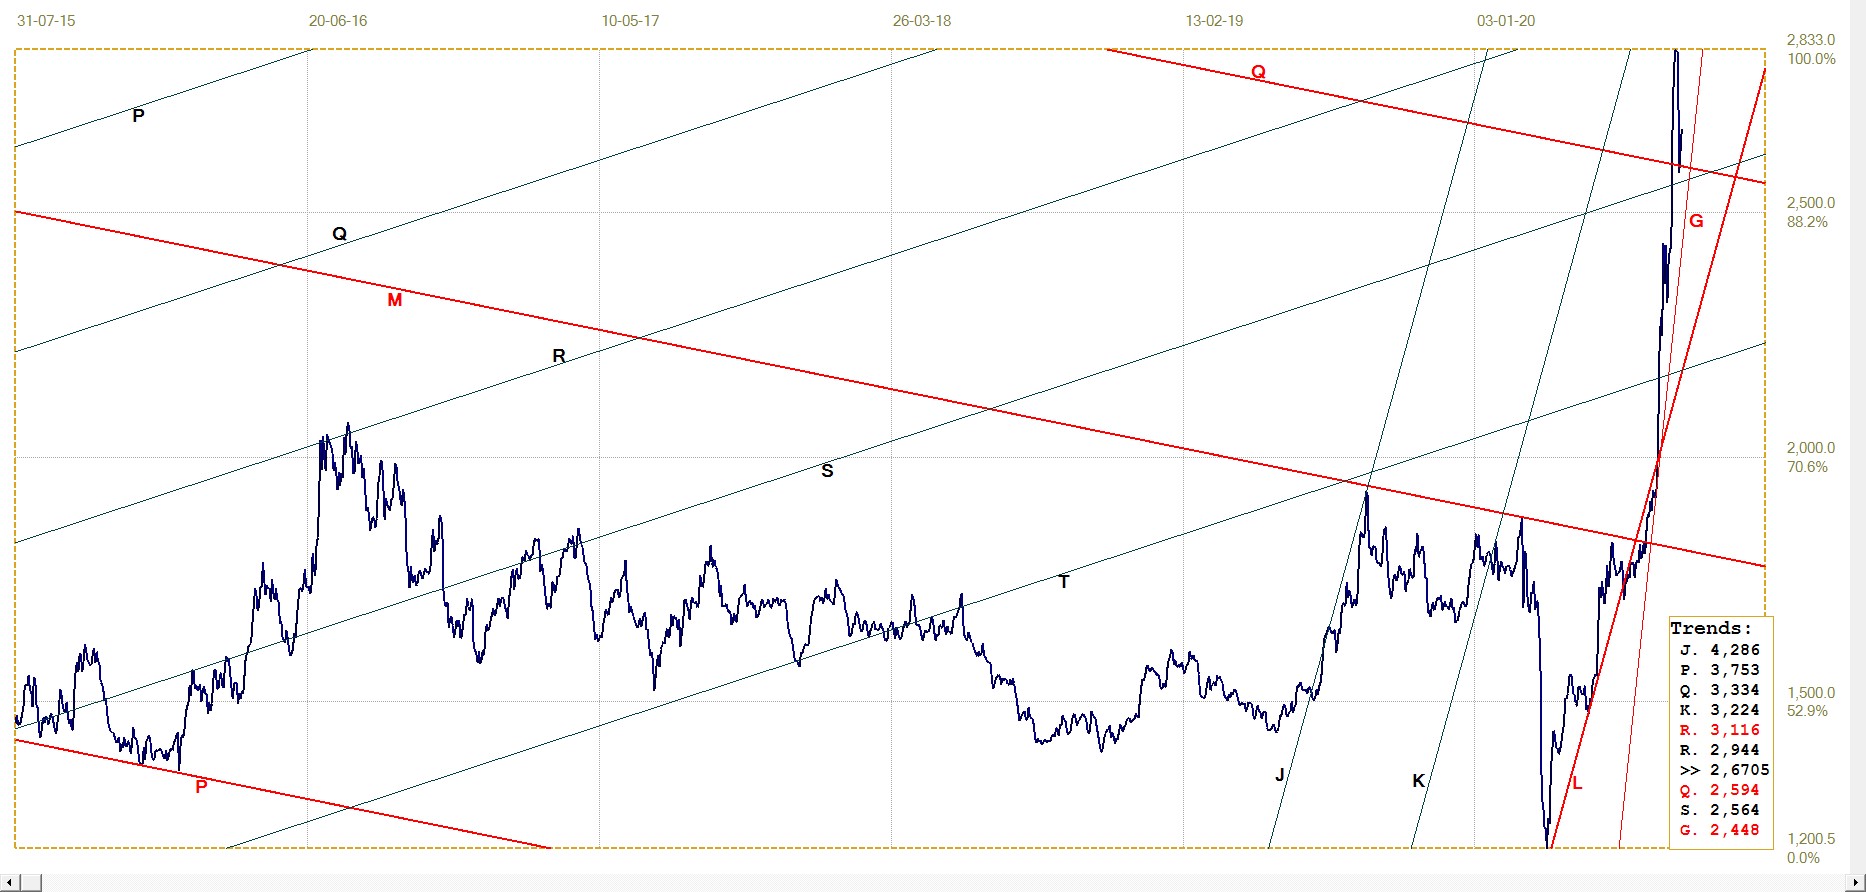
Silver price. London daily fix. Last = $26.705
The two charts show that because the prices of the metals until last week had accelerated at a steeper rate than the trend lines, shown as G on both charts, a cushion had developed between the prices and the trend lines. In both cases the cushion was wide enough to absorb the steep declines in the prices.
The values for the two G lines in the trend tables are the projected values of the trend lines for Monday, 17 August. The gold PM fix on the Monday has to be at or above $1924 and the silver fix above $24.48 in order to hold the trend line. The daily increase in the values of the trend lines are $5.60 and $0.25 respectively.
Comparison of the events in April 2013 and August 202.
In both cases, intra-day prices of the metals were slaughtered by 10% or more on the day lows over the course of 2 days. In April 2013 the attack to achieve a decline of this order required the selling of contracts equal to multi-year gold production. This time, the attack may not have required that volume, because of a timely hike in Comex margins that primed the market for a sell-off. Additional selling only helped to speed up and extend the decline.
In April 2013, the high dumping volume did not have the assistance of sudden margin increases to get the selling going. However, on 16 April 2013, shortly after the sell-off attack was completed, Comex decided the sudden volatility has increased market risk, which therefore deserved higher margins. The increased margins on top of the preceding sell-off added further pressure on longs to close positions and thereby also delayed any resurgent buying off the new low prices!
This time, the shock of higher margins of a “two hands washing each other” collusion operation had to come first to prime the markets for the selling to come. It seems likely that regulators in the current climate might ask some awkward questions if there had been an out of the blue massive selling attack, as in 2013. The suddenly higher margins offered a convenient reason for the panic to close positions at best by speculators caught on the wrong foot. Also, the risk of too strong buyer interest at bargain prices in a climate of low reserves might have scared off the Banks from repeating the dumping what was done in 2013.
As mentioned, after the attack in 2013, all rallies in the two metal prices were soon capped by increased selling and the bear markets continued. Buyers were apprehensive and the markets were submissive and reacted lower and demand for gold and silver could be satisfied relatively easily.
The difference from 2013 after the earlier attacks in March this year is evident on the above two charts. Gold rebounded immediately, with silver – as the main target with a bigger sell-off – reacting a little sluggishly. Yet it did not take silver all that long to set off on a steeper gradient than that of gold, as evident in the gold-silver ratio that declined from a high near 125 to a recent ratio closer to 60.
It is tempting on the evidence to make a flat statement that the metal prices are going to remain above the two steep trend lines and do so into October – with gold then reaching to $2200 or higher and with silver near $40/oz. However, prudence requires at least some qualification. It will not be a surprise when these levels are reached, but it might fail against the deadline – which does not imply these bull markets are over and done. It is fully expected the markets will continue higher, but perhaps not indefinitely at the current steep trends indicated by lines G. Both charts, however, also show two channels JKL, steeper for silver than for gold, that then should have a better chance of containing the longer term rising trends.
It logically can be expected that some control will be maintained over the prices of gold and silver for long enough so that the black boxes of the hedge funds switch from being long of the metals to shorting them. If successful, this would provide the banks an opportunity to close more of their short positions.
Near the beginning of June, the Commercials were net short of 256253 and 53947 contracts in gold and silver. By early July, the numbers were 310463 and 56406, respectively, to show that selling was continuing to unsuccessfully try and rein back the rallies. In the August 7 report, they had declined to 277345 and 51120 and a week later even more, to 268331 and 45660.
The net short OI had first increased during June into July and then decreased into mid August by 33% for gold and almost 20% for silver – which again shows the resilience of the demand for silver. Whether this is sufficient for the banks to relax their suppression remains to be seen.
On Wall Street neither the S&P500 nor Nasdaq set new highs last week, while the DJIA is still well below achieving a new all time high. The yield on the US 10-year is back above 0.700% and crude is holding above $40, but has so far failed to break above its nearby resistance at $42.50.
Euro–Dollar
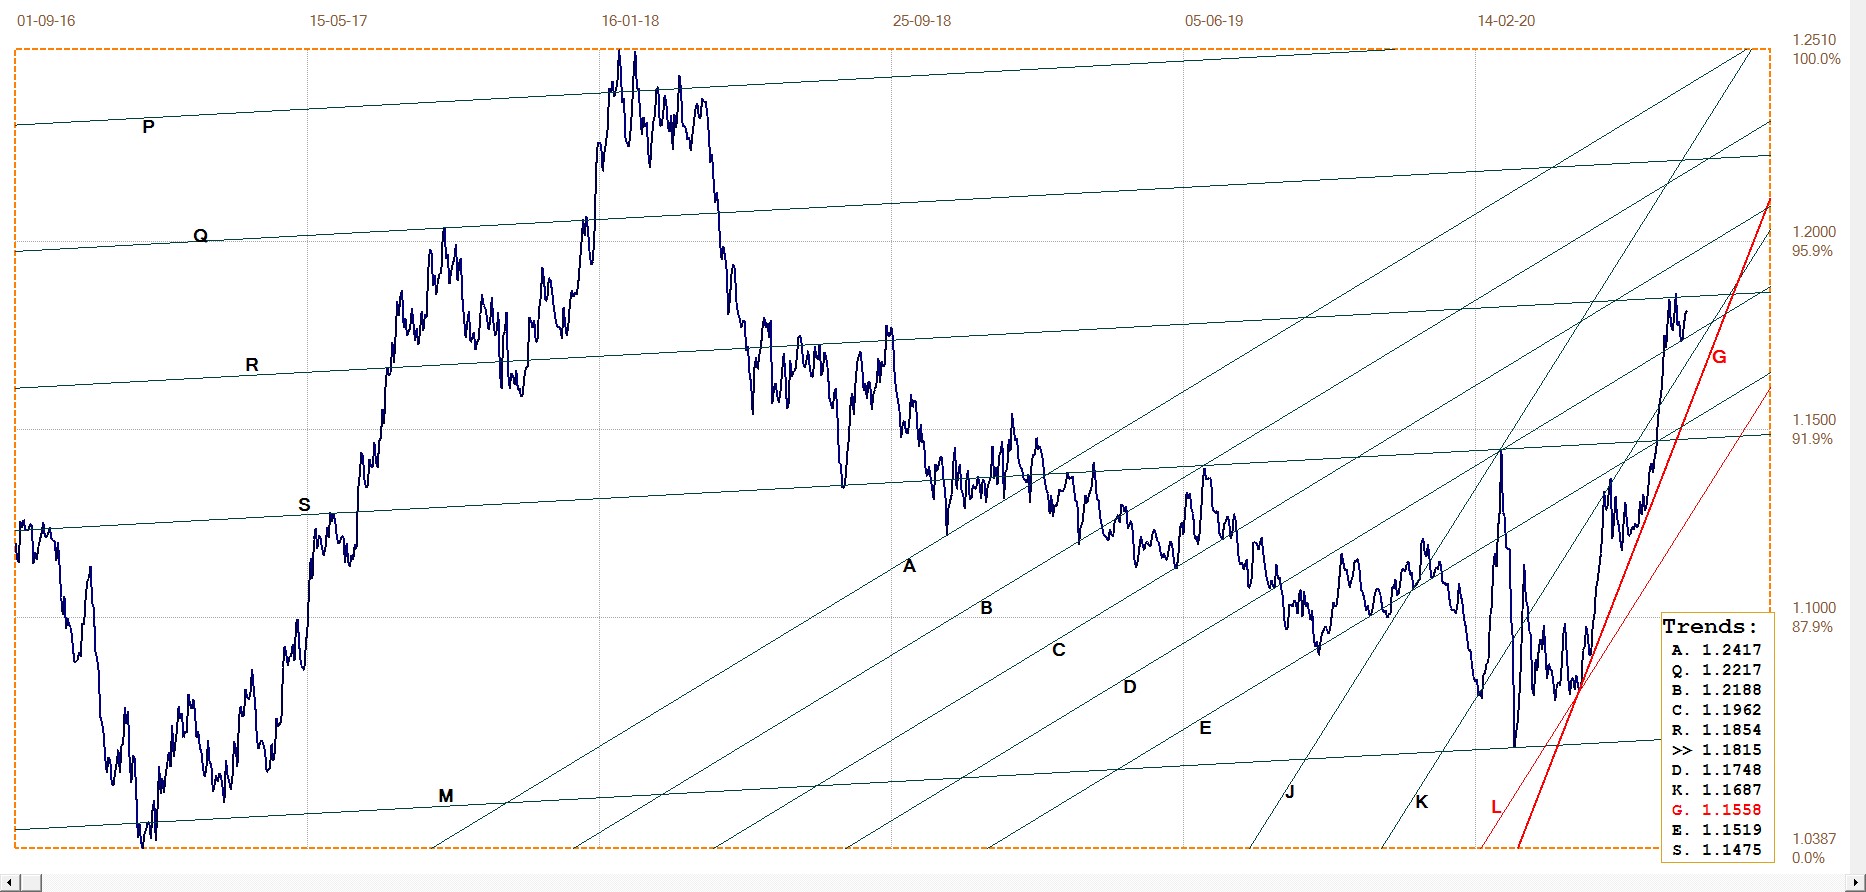
Euro–dollar, last = $1.1815 (www.investing.com)
Recent strength in the dollar had the euro reversing off line R ($1.1854) and then – as the dollar lost ground again – reversing higher off line D ($1.1748) again. It seems set to be trapped between lines R and D until a break either way – higher? – sets a new direction.
DJIA Daily close
If one had to look for a reason why the DJIA has not followed the example set by the S&P500 and Nasdaq to achieve new all time highs, it might be that the reason lies with the RobinHooders and all the smal day traders being caught up by the smart phone apps promoted by low cost brokers.
It would appear that apart from Tesla and perhaps some of the FAANGS, much of the trading performed by these people are rumour-driven on the many websites that are said to have mushroomed into existence as chat rooms to herd the new day-traders into the same direction. Perhaps the DJIA will have its turn when the Fed realises that the mass of small traders are direction the new liquidity into the smaller stocks on the NYSE and into the heavyweights on the Nasdaq exchange. Then the Fed can even up the indices and markets by looking for larger issues on the NYSE to get the emotional boost of a new all time high for the DJIA.
And by doing so, extending the bull market in the DJIA to hold above the steep gradient of line G (27 016).
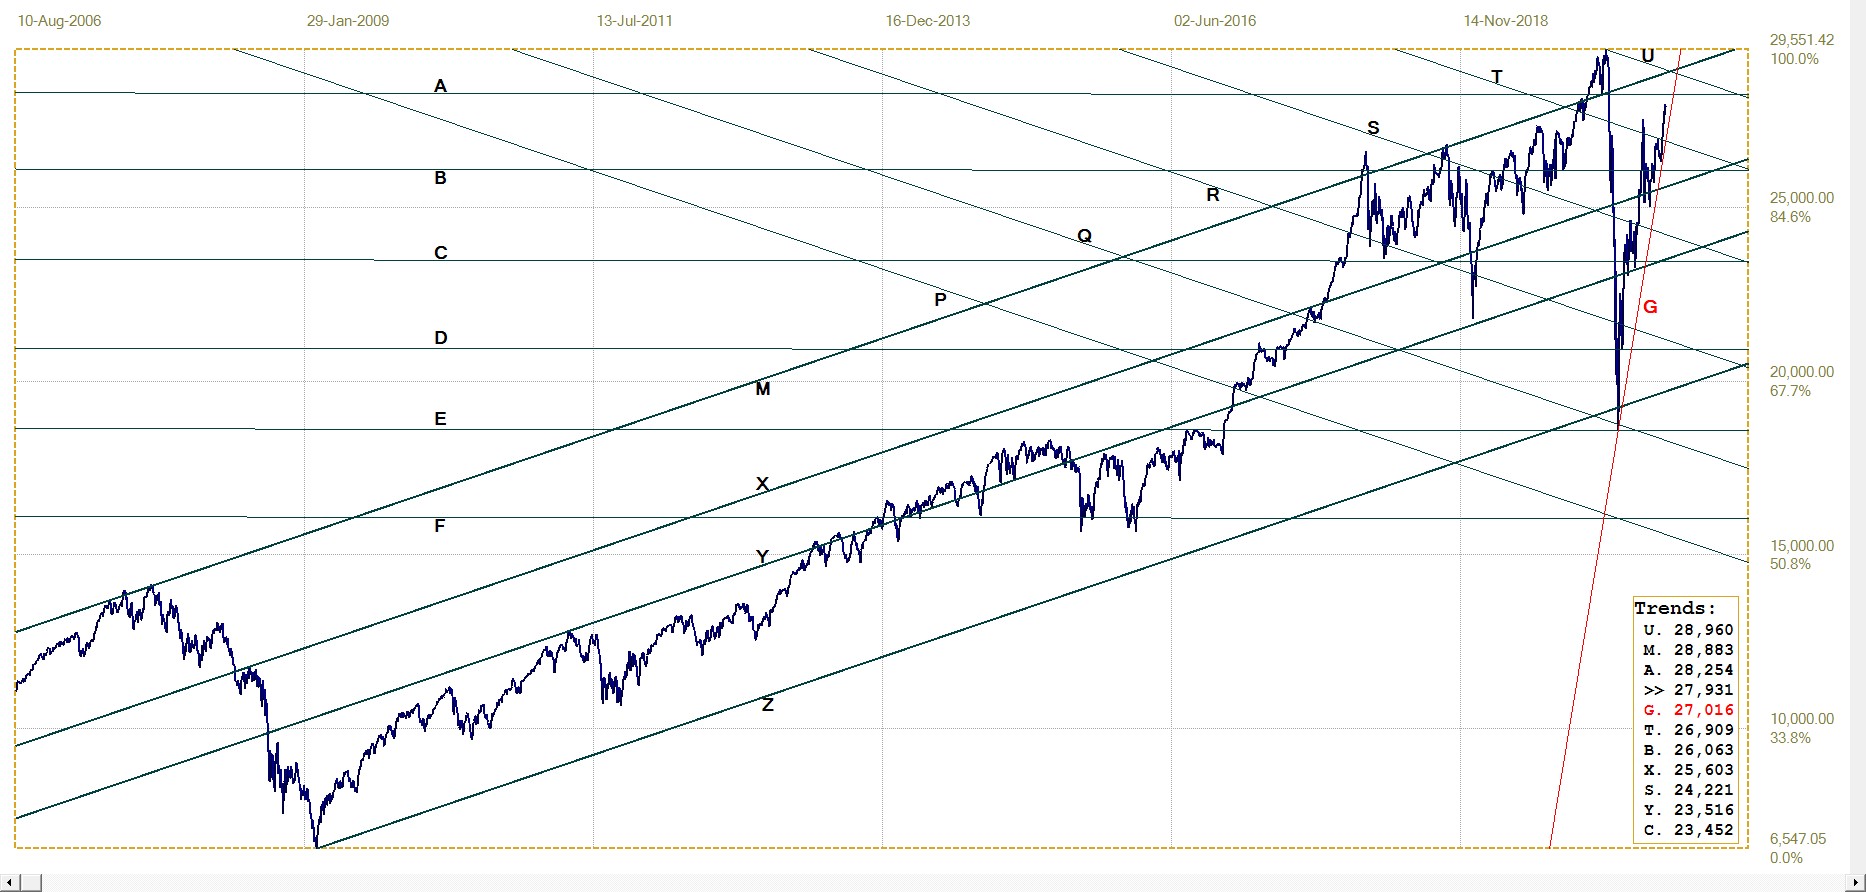
DJIA, last = 27931.02 (money.cnn.com)
Gold London PM fix – Dollars
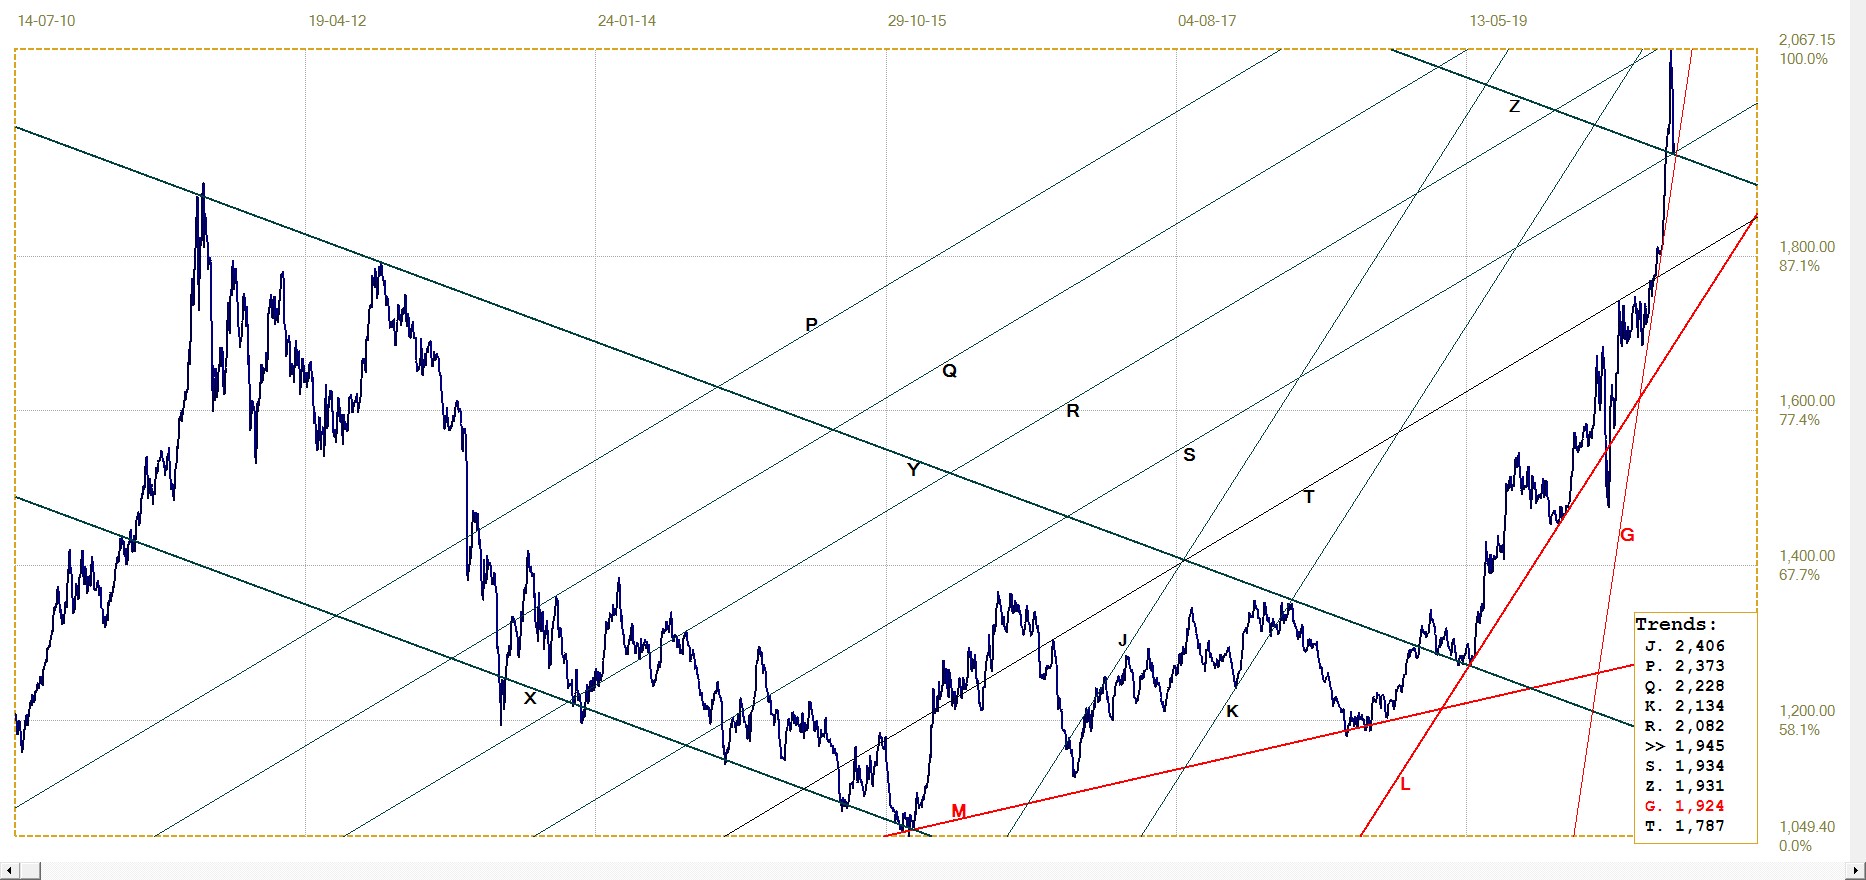
Gold price – London PM fix, last = $1944,75 (www.kitco.com)
As discussed earlier, the London PM fix still has the price of gold holding above the steep gradient of line G (1924). Both lines Z ($1931) and S ($1934) also right now act as good support. This does not preclude a break lower but they raise the odds on technical ground for the minor recovery so far to continue, even if this follows a lower gradient that in due course breaks sideways and below line G ($1924).
While, if that were to happen, the target at about $2200 for early October probably will be missed, this would not imply the end to the bull market. Based on the news and charting evidence so far, the medium to longer term bull market in gold – and in silver as well – is set to continue.
Euro–gold PM fix
The steep run higher to line Q (€1757) was shown last week to be evidence that the price of gold rallied on inherent strength, not only because of earlier weakness in the US dollar. The sharp reversal lower that has approached lines R (€1636) and L (€1629) is therefore a reaction to the steep fall in the dollar price of gold and not because of the stronger dollar.
As per the chart of dollar gold, the price in euro is expected to hold above the current support for the time being, with improvement to come.
Euro gold price – PM fix in Euro, last = €1643.31 (www.kitco.com)
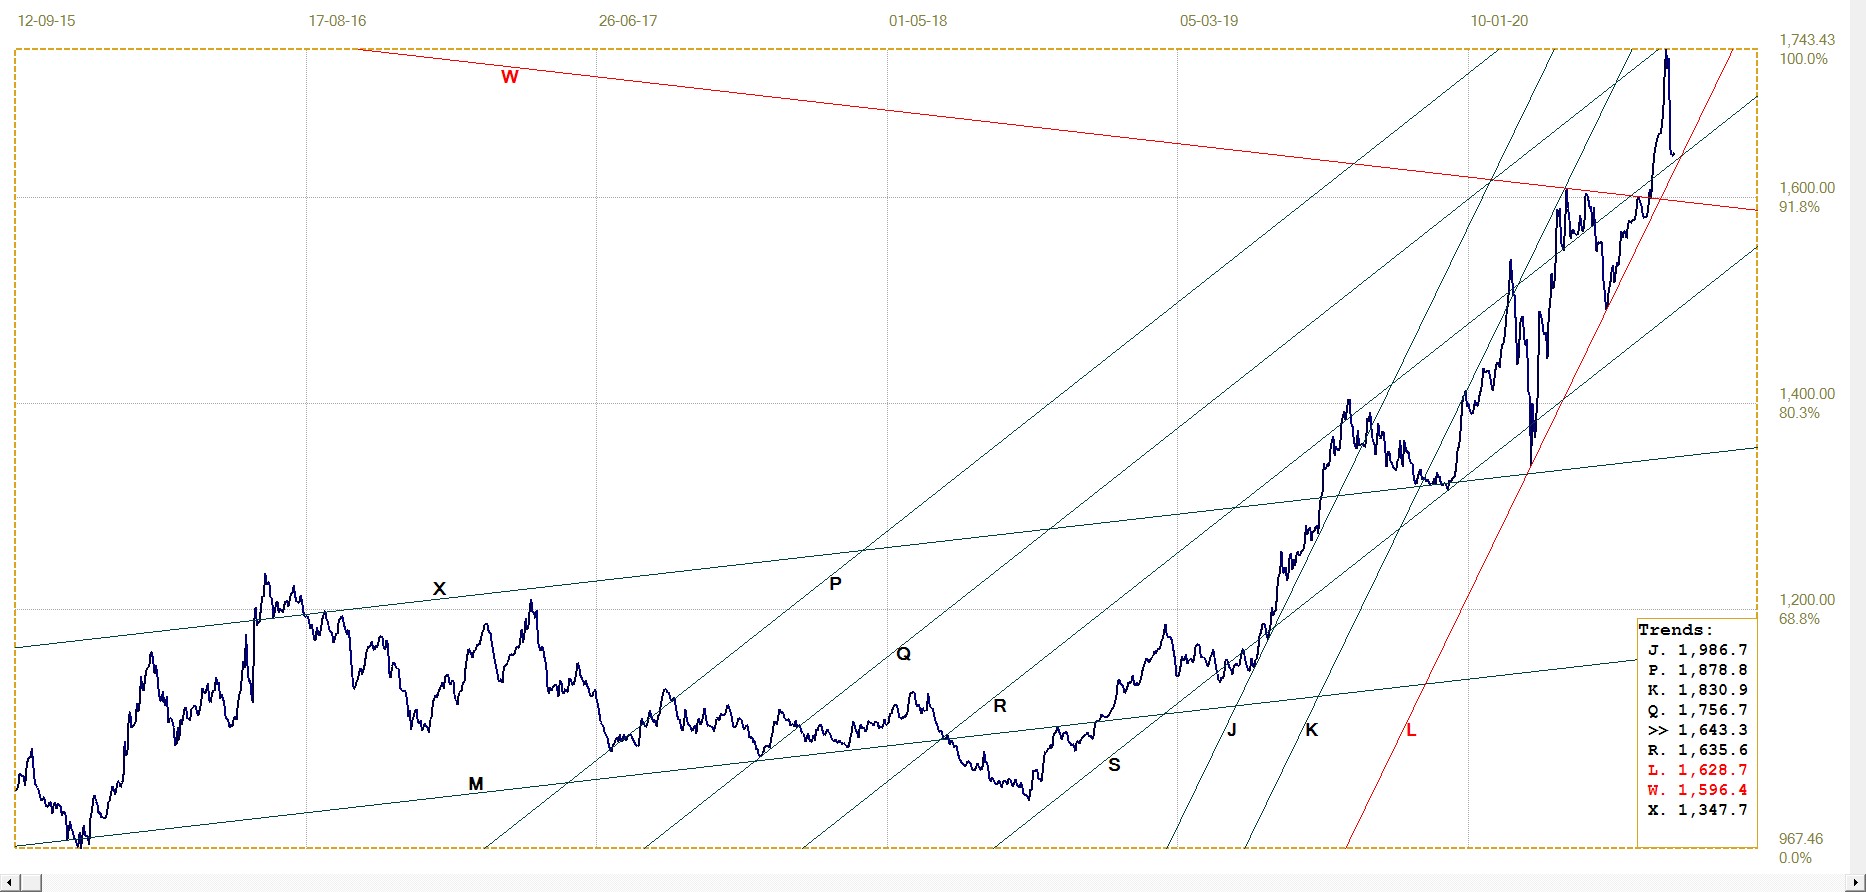
Silver Daily London Fix
Silver daily London fix, last = $26.705 (www.kitco.com)
Much the same applies here for silver as for the dollar and euro prices of gold. The steep fall held at line Q ($25.94) and reversed slightly during the last two days of the week. It is also still holding above the steep line G ($24.48). Not far below these two level of support from line Q, is additional support from line S (25.64). For the early part of this week, these two lines provide some protection for line G, up to the point where its steep gradient carries it above the shallower trend lines.
U.S. 10–year Treasury Note
U.S. 10–year Treasury note, last = 0.709% (www.investing.com )
The yield held at and reversed higher off line R (0.501%) to break higher above the steep line G, back above channel CD (0.515%) and than also above line Z (0.618) – the lower boundary of the broad channel system XYZ.
This move higher removes the threat of lower yields for the time being, while line Z holds. A break back into channel KL (0.753%) is however needed to signal a rising trend in the yield – which could develop should the economy signal a return to near normalcy after the COBID experience. This might require more time, though, given that trend in the statistics at the tops of the report.
West Texas Intermediate crude. Daily close
For some weeks now, the price of crude has inched higher at worm-like speed, first to break sideways from the steep channel KL ($35.14) and after that failed to hold above line G ($49.01). After this break the gradual trend higher has continued, approaching but as yet not breaking above resistance at line Q ($42.59). A break clear above at line Q is needed to signal improving demand for crude that would also be a signal that the economy is reviving.
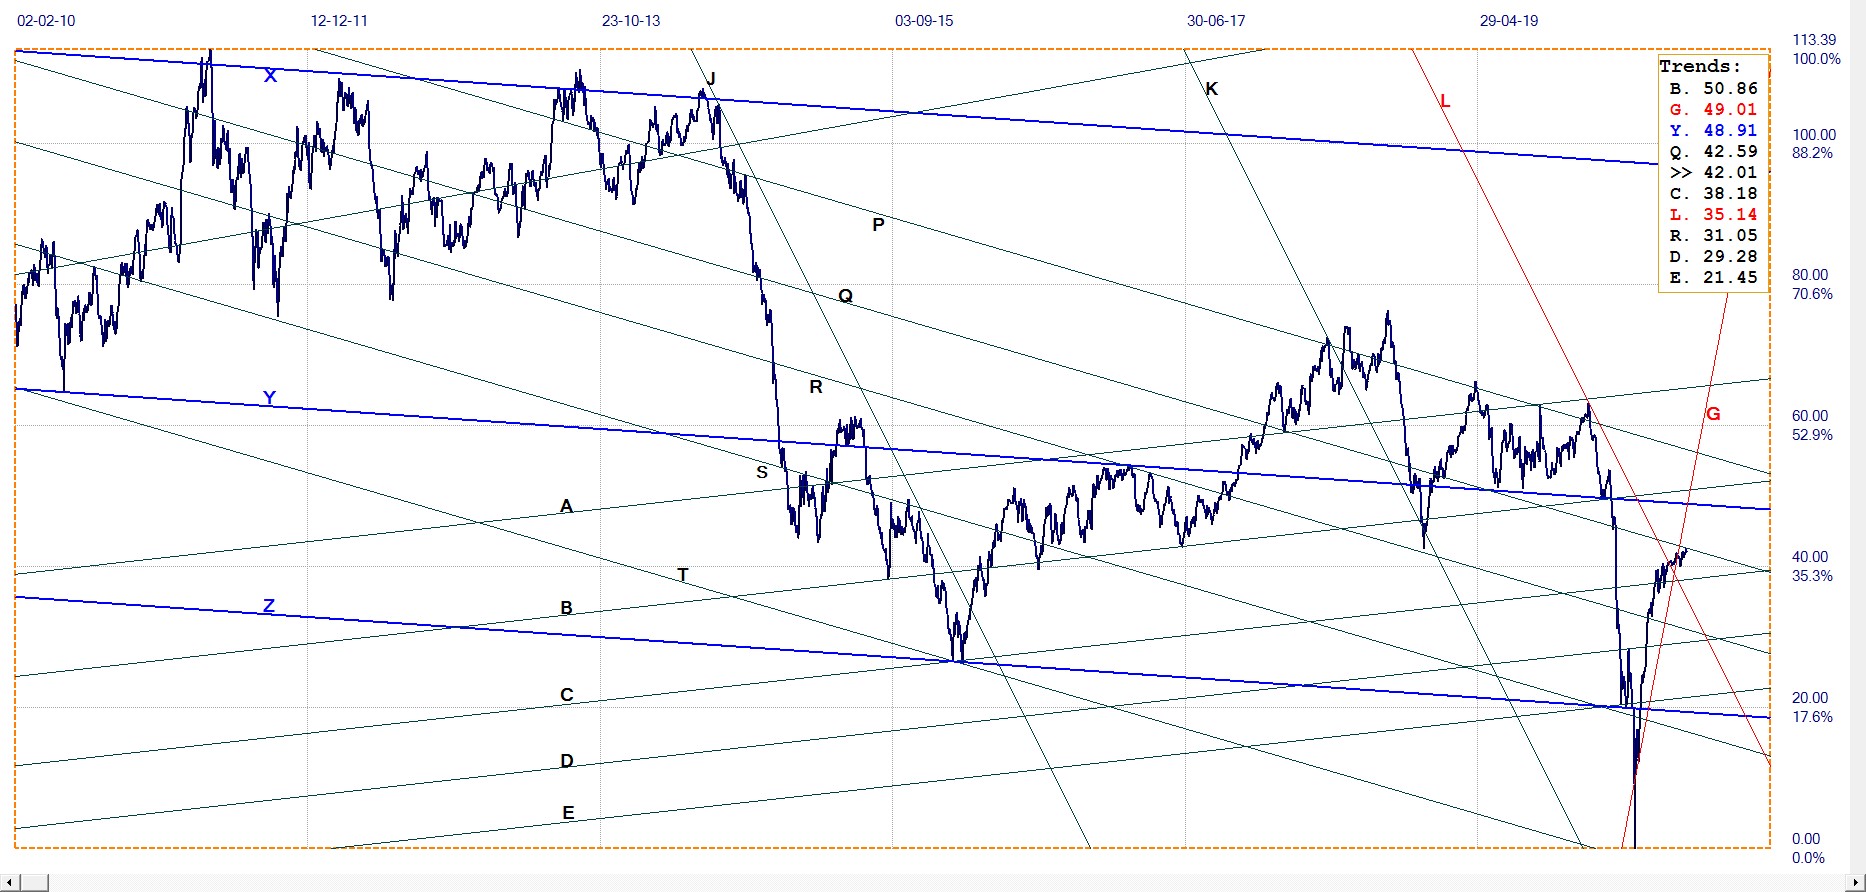
WTI crude – Daily close, last = $42.01 (www.investing.com )
*********
More from Gold-Eagle


