Are Wall Street’s Legs Buckling?


Wall Street was given a wake-up call toward the end of June when, after almost three months of dithering sideways, the DJIA fell by about 1000 points in just two days of trading. This steep fall seemed to confirm what Trump had been saying about the US economy – it was in a decline and had been so ever since the NAFTA agreement was signed, with resulted in much loss of jobs of high paying manufacturing jobs. It was too close to the truth and Americans had to be convinced that Trump is in fact only scare mongering. The best way to do that was to show that Wall Street was as healthy as could be – by breaking clear above the 18000 ceiling. Which happened; but if real investors are so keen on buying equities, why did the DJIA last week end in the red on four of the five days? Has it become like the Coyote, hovering and treading air while staring down at the desert far below?
Yellen had a lot to do with Friday’s yo-yo market that started very bullish before a slide deep into negative territory. There was the usual – and for many traders the expected – late rally, but this tome it could not follow through and it ended with a negative slant right at the end. All the warnings from Yellen and Fed’s spokespeople that ‘we will be watching the data’ clearly tells all who hear that the ‘imminent rate increase’ is nothing more than jawboning the market a little to make the high DJIA more believable. But a definite rate increase while the markets are so top-heavy is quite unlikely. It could be the recently ‘bullish investors’ will have second thoughts.
Gold and silver continue to be beaten on the head, with silver facing the brunt of the attack. It is clear that the objective is to get the silver longs to abandon their positions and hand a nice profit to the short sellers. So far this has not happened, although on Friday some did close positions – but not enough to make a difference. The gold open interest picked up more than 5000 new longs (preliminary data), as a sign that selling gold was being used as the lever to push the silver price lower.
Silver has shifted down into the dumps, but so far it seems only the retail longs are running away – the bulk of the longs with proven deep pockets are sitting tight.
The yield on the 10-year Treasury note responded on Friday to the hints about the imminent rate increase and has broken above 1.60% since mid June. This could be only a brief outlier, or a start to the Treasury selling that many internet economists have been predicting – almost as many as are writing Wall Street way down. Yet, market predictions are like the pudding – the proof is in the eating. We’ll see.
Euro-Dollar
The second rebound higher off support, at line L ($1.1022) confirmed that channel KL plays an important role in the bullish development of the euro-dollar chart. On the other hand, channel UV ($1.1330) plays a similar part in the bearish aspect of the chart; the euro tested resistance at line V during the week, but closed lower. A break above channel UV is needed to further confirm bull channel KL.
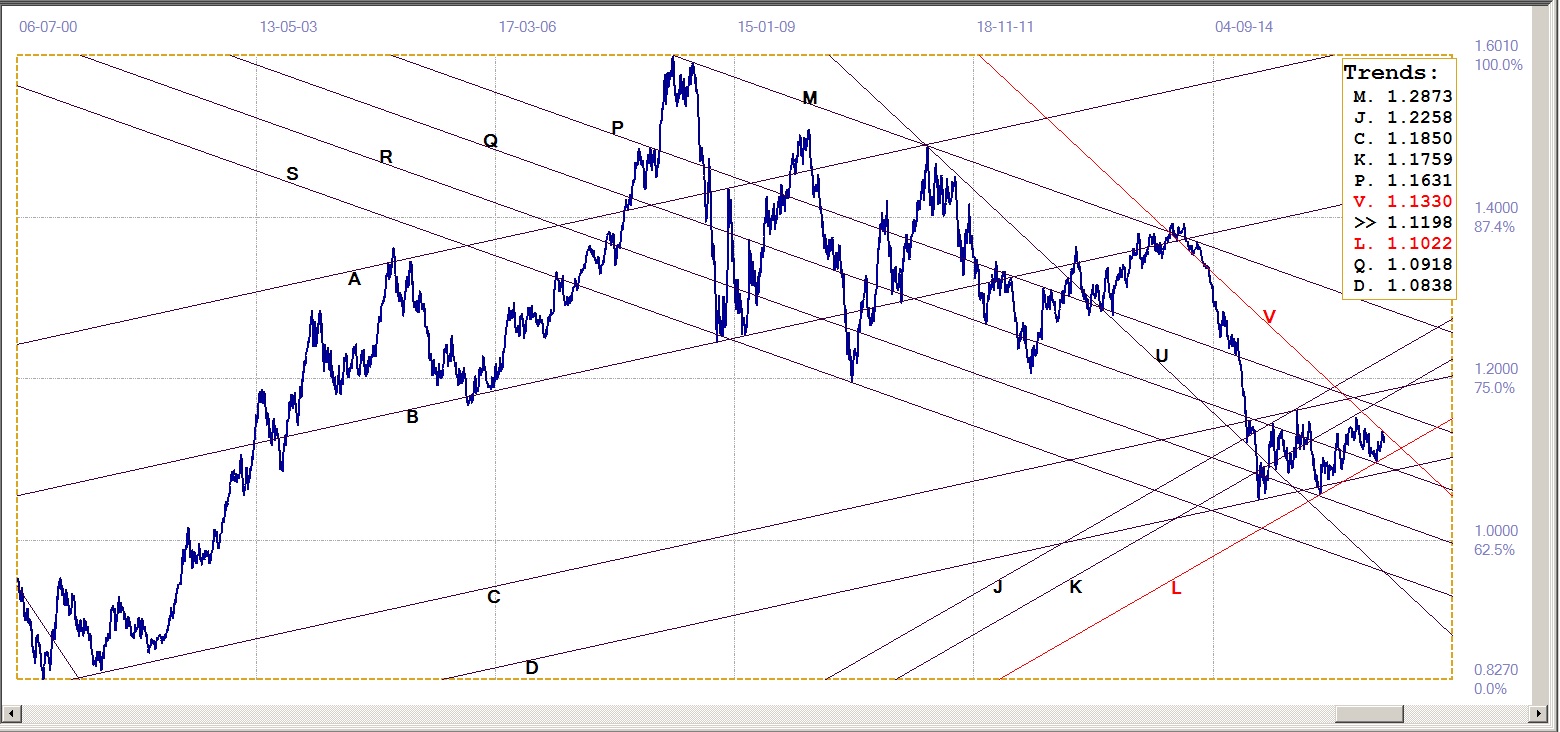
Euro-dollar, last = $1.1198 (www.investing.com )
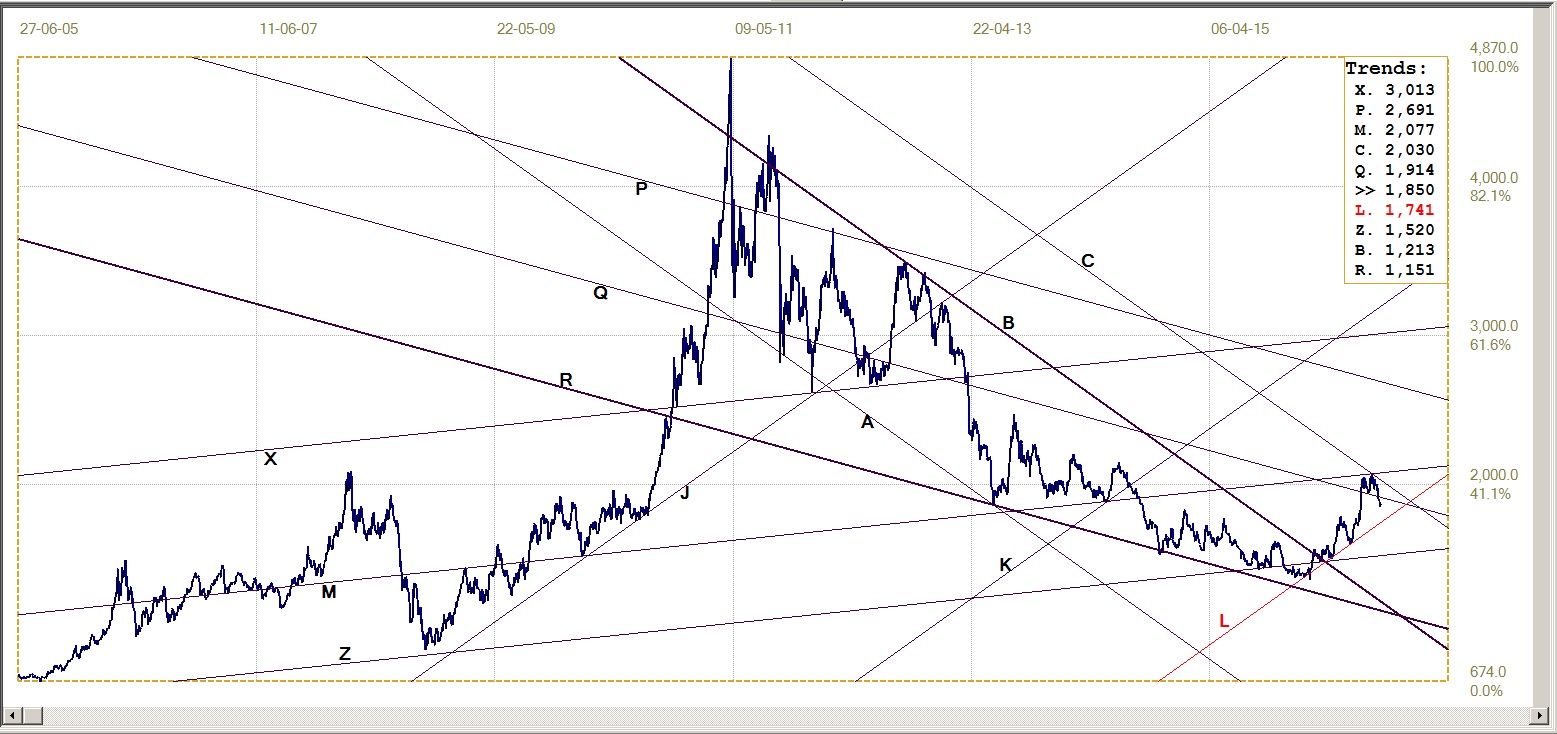
DJIA
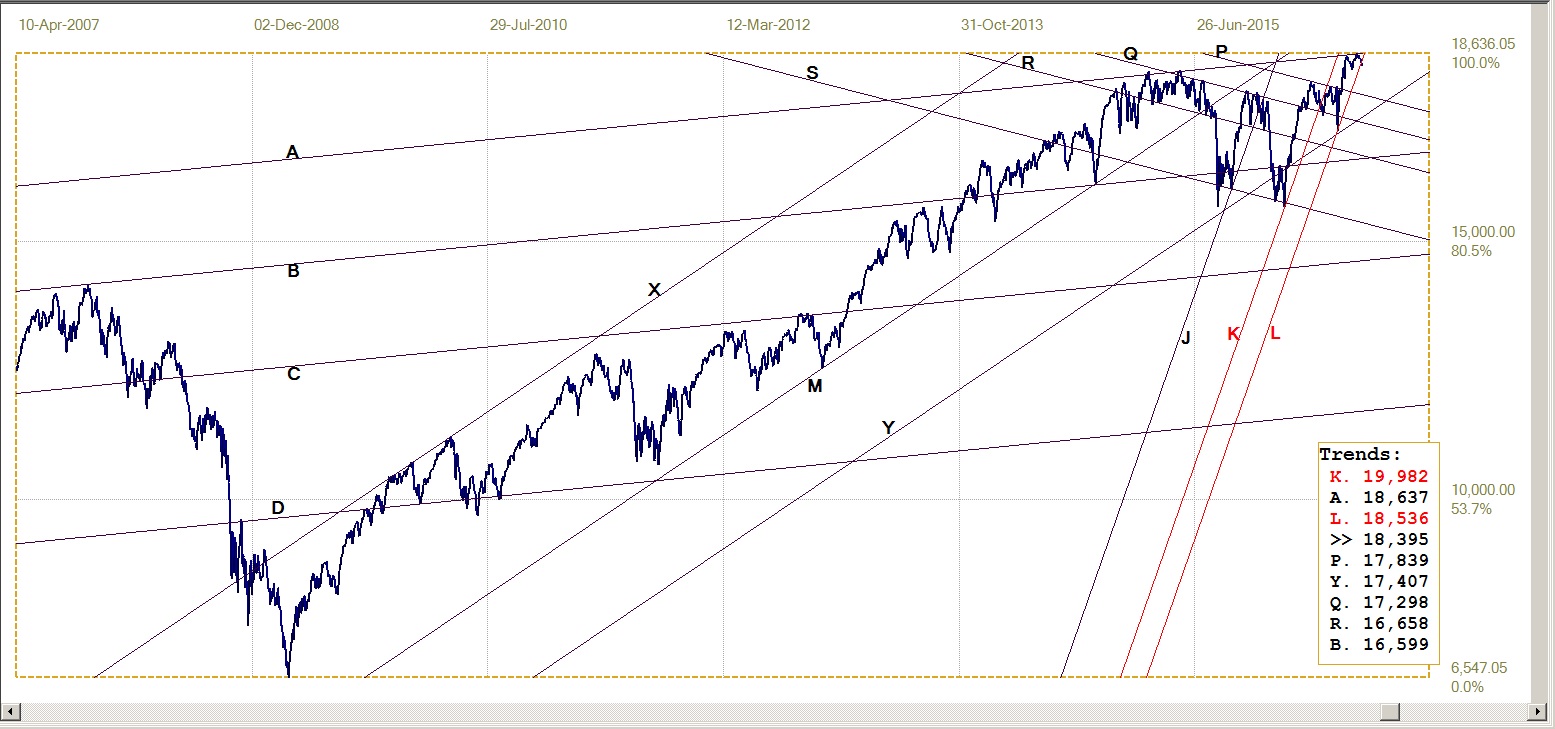
DJIA, last = 18395.40 (money.cnn.com)
A modified analysis of the DJIA shows that the recent and perhaps unexpected rally that broke above bear channel PQR (17839) ended with the tight double top at the resistance of line A (18637), The move lower off the double top ended resting just off the support of the lower boundary of the steep bull channel JKL (18536).
What happens soon should either dispel the speculation in the introduction that the equity bulls behind the recent rally beyond the 18 000 level have realised that they have become too bullish for their own good, or provide evidence that whoever has been buying stocks in the face of recent selling pressure is not too concerned about making an eventual profit; similar to the waterfall sellers of gold and silver futures!
Gold PM Fix - Dollars
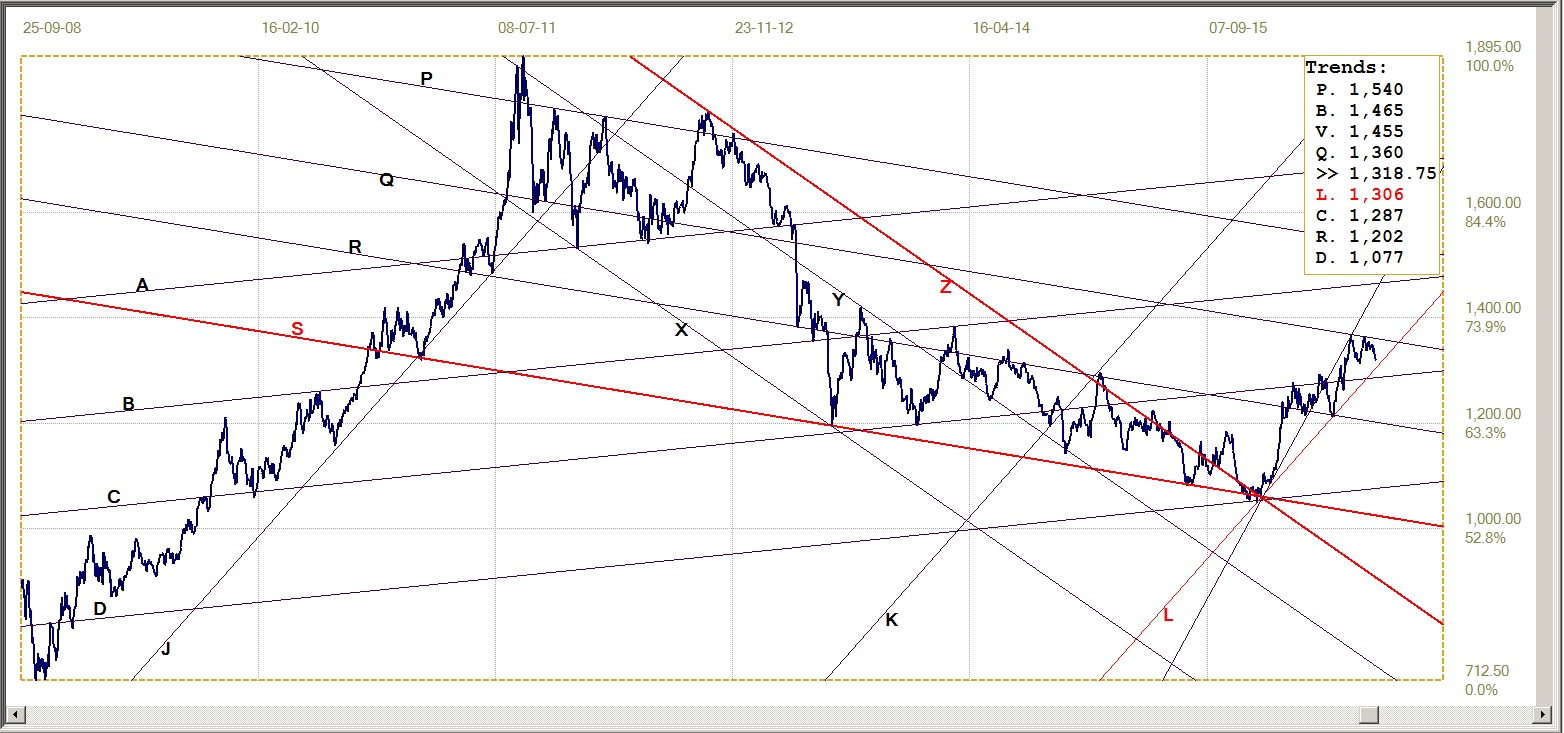
Gold price – London PM fix, last = $1318.75 (www.kitco.com )
The second gold rally off support at line L ($1306) broke above resistance at line C ($1287), but the failed to extend the trend above line Q ($1360) or recover into the old and steeper bull channel of which line V ($1455) was the lower boundary. That was when strong selling halted the gold rally as it moved above the $1350 level and just made it to line Q. The resulting correction was not very deep before the rally resumed to test resistance at line Q again – and again without success.
The new reversal lower has held above the important support along line L – at least so far, with First Notice Day on Wednesday, 31st August. As always, gold will remain under pressure until that day is history.
Gold PM Fix – Euro-gold
Following the sharp if brief break above line R (€1209), the dollar price of gold and the value of the euro maintained good enough balance to keep the euro gold price near to that support line. Two weeks ago, a the stronger euro and the steady gold price had the euro price of gold breaking below line R, accelerating lower to break below support at line W (€1180) as the selling intensified last week.
The euro price now has a bearish bias, likely to test the support at line L (€1151). The euro is holding quite steady to the dollar, with some weakness late last week But it is the gold price that will be the focus of unwelcome attention this new week as FND comes onto the radar and it can be expected to hold somewhat steady at best, perhaps testing the $1300 support.
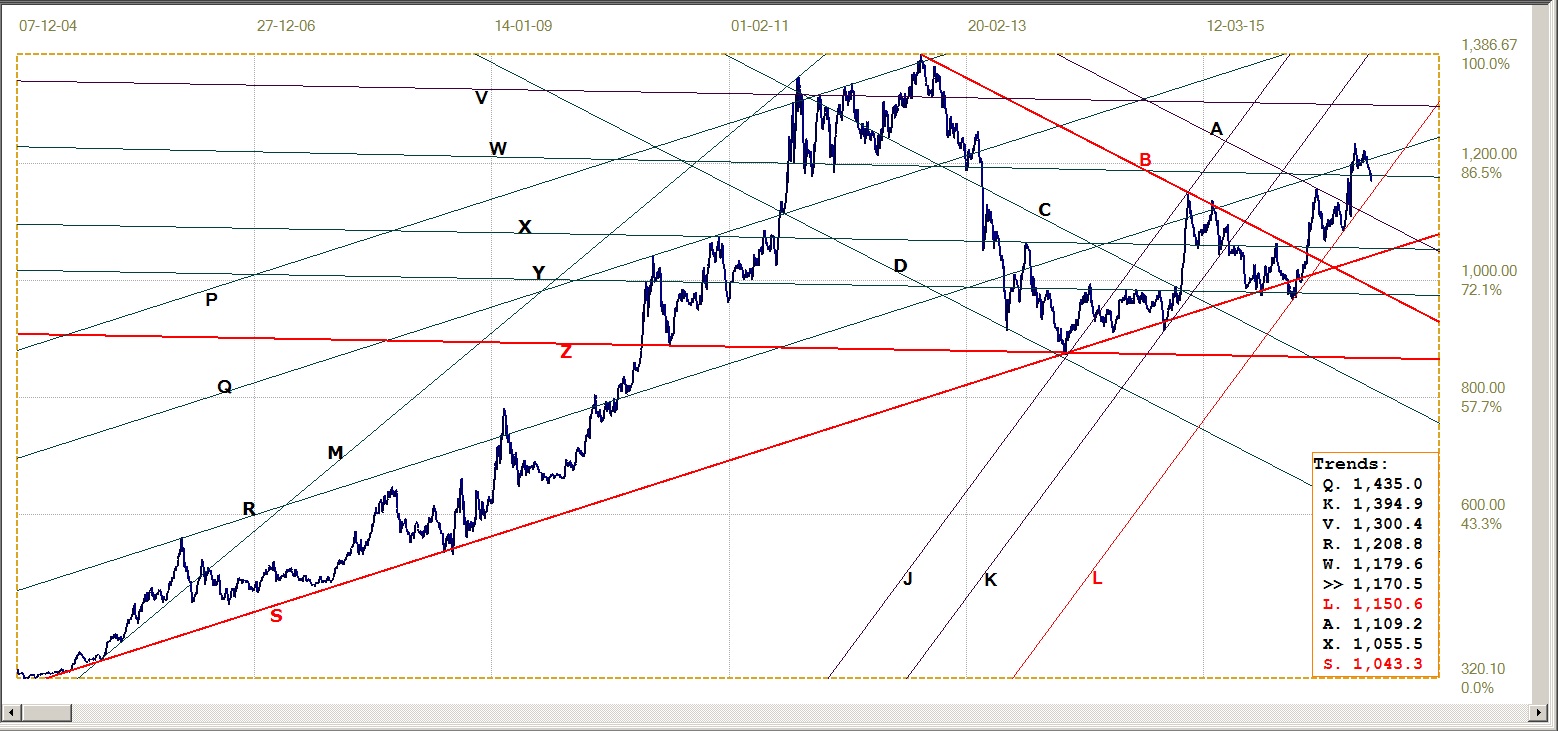
Euro gold price – PM fix in Euro, last = €1170.5 (www.kitco.com)
Silver Daily Fix Chart
Silver is holding well above its support at the lower boundary of its bull channel at line L ($17.43), but this channel is not as steep as that of the gold price. Visually, this runs counter to expectations that silver should outperform gold, but that view is vindicated when comparing the performance of the two metals since the recent low at the start of the current rally: gold has improved by 29.5% since December while silver rallied 37.5% over the same period, substantially better than gold.
The new double top for silver is similar to what gold has recently done, but silver, after holding well under the first period of selling, is now breaking much lower than gold. This might be since September is a big silver month and it is not so for gold. If this happen to be the reason for the greater suppression, the silver price should perform even better once the FND has come and gone.
Silver daily fix, last = $18.67 (www.kitco.com )
US 10-year Treasury Note
The yield on the US 10-year Treasury note has now moved higher out of its volatile consolidation phase of recent weeks. The June rally had a low yield of 1.56% and when the rally later resumed, this low became important market support. The sell-off following the low at 1.358%, early in July, on a number of occasions during the subsequent consolidation tried to extend higher beyond the recent important low, but without much success.
Reaction to the Yellen presentation at Jackson Hole on Friday was bearish enough to push the yield higher, above the market support of the important June low. This week should reveal whether this was only a knee-jerk reaction that will soon correct again, or whether it was the beginning of a medium to longer term bear trend. The jump higher is testing the steep lower boundary of bear channel KL (1.626%) while also breaking marginally above the bull channel YZ. Any further weakness, to break clear above lines Z and L, should be seen as confirming a new bearish trend.
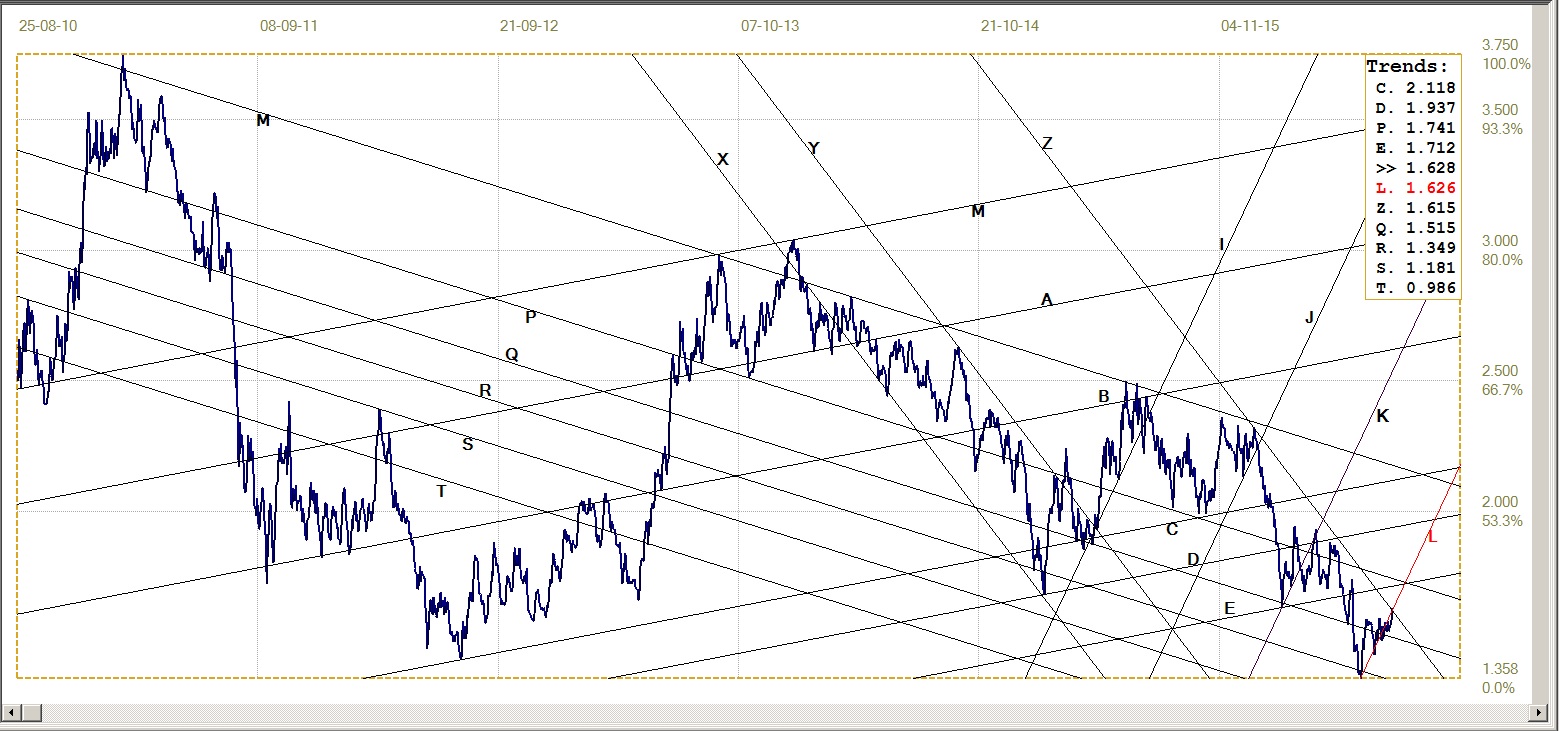
U.S. 10-Year Treasury note, last = 1.628% (www.investing.com )
West Texas Intermediate Crude. Daily close
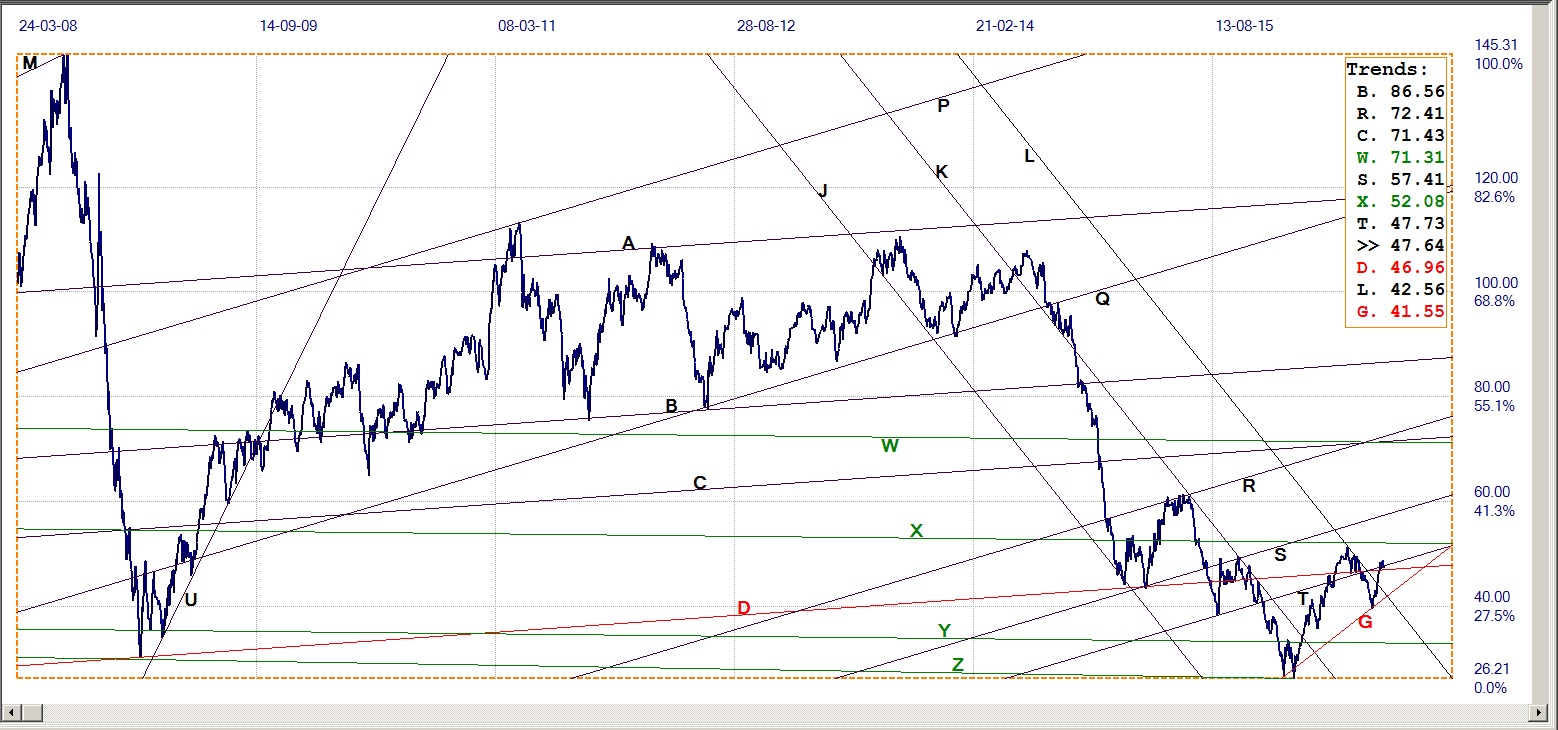
WTI Crude – Daily close, last = $47.64 (www.investing.com )
The recent break below the key $50/bbl psychological support found new support at line G, ($41.55) from where the price soon rebounded again. However, this time its rally ran out of breath at the resistance at line T ($47.73) after managing to break just above line D ($46.96). So far, there has been no new and serious challenge to the $50/bbl level and the price has settled in a quite tight range.
The influence of the price of crude on Wall Street seems to be less now that a few months ago – perhaps the risk to the banks have abated with some form of backup for the drillers in trouble with their loans – but it would be a surprise of crude also is not receiving some form of semi-official support, directly or indirectly, to assist in proving Trump wrong about his views of the economy. It can be imagined that each and every factor that could boost the DJIA would be recruited.
©2016 daan joubert, Rights Reserved
chartsym (at) gmail(dot)com


