AUDNZD False Break Low?
 share
share
 share
share
 share
share
 share
share
 share
share
n previous reports on the AUDNZD, I have stated that the longer term technicals appear bullish. Hence I have been looking for an opportunity to enter into long positions on this recent pullback. There was an aborted attempt around a month ago but there now appears another opportunity arising. Let's take a look at it using the daily chart.
Daily Chart
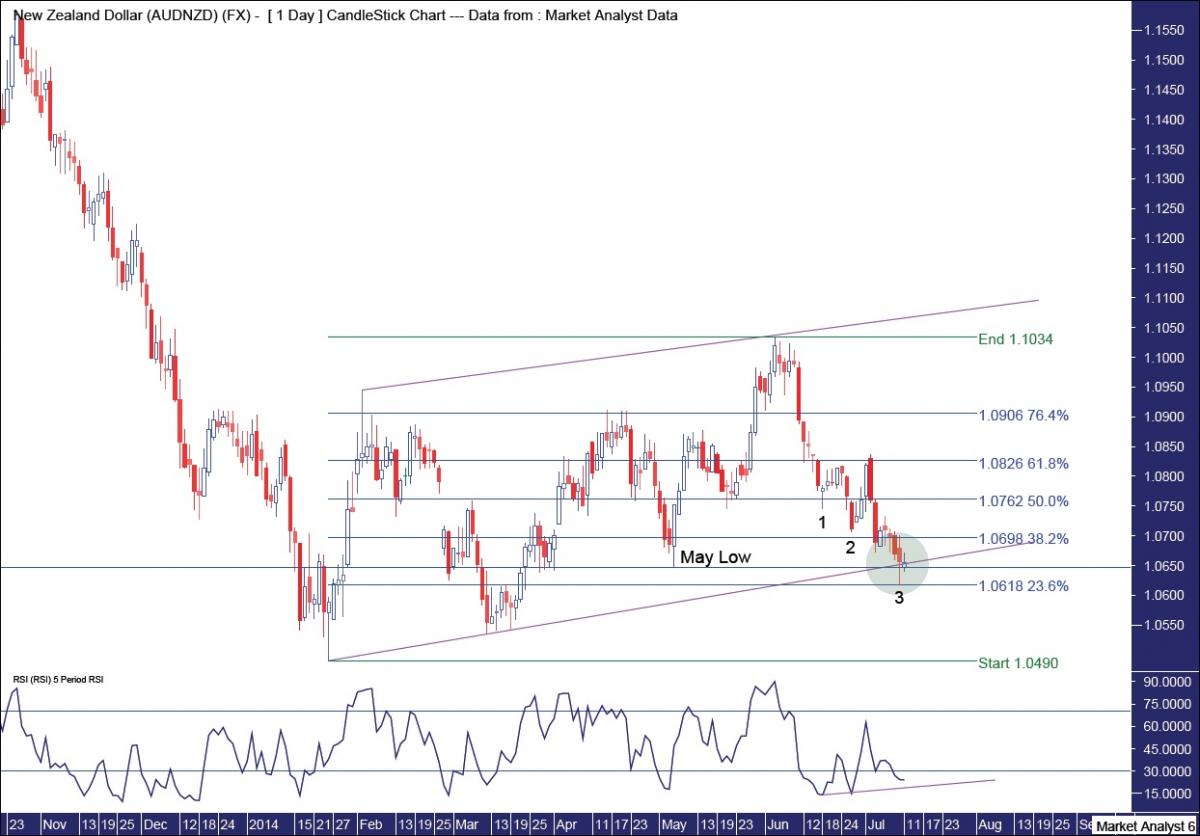
This low was also a marginal break of the May low of 1.0647 and with no follow through to the downside so far this low is shaping up as a false break low. False breaks are my favourite bottoming (and topping) pattern as I like to see the sellers flushed out. Stops would have been building below the May low so now that they have been taken out the coast is clear, so to speak. However, in this case we have a marginal break of not only the May low but the lower uptrend channel as well. A double false break shall we say?
I have also added a Relative Strength Indicator (RSI) and it can be seen that each of the last three lows is accompanied by a less weak RSI reading. So it appears we have a triple bullish divergence and it is generally after the third low with higher RSI reading that we can expect a significant move higher.
So it appears that conditions are ripe for a turn here. If this pans out as suggested then we can look further out in time in the next report.
********
Please register your interest in my website coming soon. Any questions or suggestions, please contact [email protected]
© 2014 Copyright Austin Galt - All Rights Reserved
Disclaimer: The above is a matter of opinion provided for general information purposes only and is not intended as investment advice. Information and analysis above are derived from sources and utilizing methods believed to be reliable, but we cannot accept responsibility for any losses you may incur as a result of this analysis. Individuals should consult with their personal financial advisors.
share
share
share
share
share


