Barron's Averages 1938-88 & Volume Trends in the DJTMG
There are many different industry groups in which investors can risk their investment capital. At the NYSE, people can make (or lose) money investing in consumer goods, high-tech, financial services, basic materials and many other enterprises. But not all stock groups are created equal; some groups have a commanding presence in the market, while others' footprints are very small. These positions are not static; they change as the economy, and society evolves over time.
Barron's from 1938-88, published their Barron's Stock Averages, which divided the stock market into 27 different groups. Some of these groups are still with us: auto manufacturing, steel, and retailing. However, to follow these market sectors in a Dow Jones publication today, one must now use the Dow Jones Total Market Groups. Interestingly, the Barron's Gold Mining Index (BGMI) is the sole survivor of the discontinued Barron's Averages series, and to this day, is still based on Thursday's (not Friday's) closing prices, because in 1938 it took an extra day to compute the data, using pencil and paper, to meet Barron's Monday's publishing date.
The table below shows the performance of the Barron's Averages with the Dow Jones Averages and US National Debt and CinC included, indexed to 1.0 from their first publication date in February 1938 to show their performance by their final publication date 50 years later in October 1988. Note how today's hot financial sectors (#21, #27, #29 {financial services & banking}) lagged far behind the rate of inflation (#11) before derivatives and credit cards began to dominate these sectors.
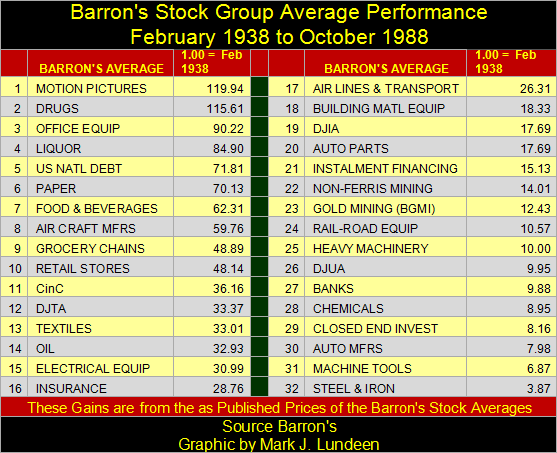
Some stock groups, like Rail Road Equipment Manufacturing, are now extinct. Baldwin Locomotive, once a hot stock in Barron's, went down with the demise of coal-fired steam locomotives. Seven decades ago, steam locomotives were ubiquitous. In 1938, who could have predicted that their days were numbered? Steam locomotives were long gone long by 1968. I haven't a clue what companies were included in this index in 1988.
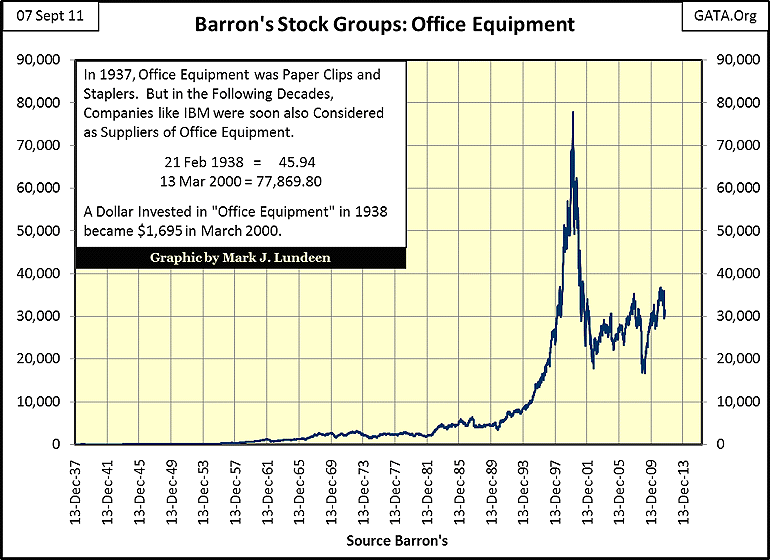
Since 1938, other stock groups have transformed themselves beyond recognition, for example, Office Equipment. Long ago, office equipment was thought of as staplers and paper clips. High-tech office equipment in 1938 was amimeograph machine. All that changed when IBM, and other computer manufactures, began a digital revolution in the office. The Barron's Stock Averages never had a Computer Group Average; they just inserted these high-tech companies in the Office Equipment Average along with the stapler manufacturers . As we can see in the chart below, the results for investors were spectacular!
But unlike today, when investors have many ETFs and sector-specific mutual funds to choose from, investors in 1938 could not invest directly in the Barron's Stock Averages. First of all, the "unit-trusts" industry (mutual funds) from the 1920s had been completely devastated by the Great Depression; that, and Barron's never properly promoted their stock averages. I've been through every issue of Barron's several times in my market research, and I've never seen an issue where Barron's published a table listing the companies in their stock groups. Occasionally, they would plot one of their stock groups with the Dow Jones for a performance comparison, and list the companies in, say the BGMI or their Steel average. But that was it.
The data for the Barron's Groups ended with Barron's 17 October 1988 issue, so I extended these series using price data from the DJTMG, using a correction-factor. In extending the Office Group chart seen above, I decided not to use the DJTMG Office Equipment Index, choosing instead to use their Technology Index to continue the plot above from 1988 to 2011. I did this as digital equipment and software vendors' presence in the modern office are much more extensive than paper clips and staplers. I realize that some will question this decision, but in my defense, manufacturers of paper and pencils and primitive adding machines were certainly not the driving force behind the 90 fold increase in this index from 1938 to 1988! FYI: the March 2000 blow-off top in the Office Equipment (DJTMG Tech Index) chart took the plot from 4,144.61 in 1988 to 77,869.80.
Not all groups have prospered since 1938: take the Barron's Steel Average. In the late 19th, and early 20th centuries, the American steel industry was the crown-jewel of the stock market, but that all changed after July 1959. Well actually the change began in the 1940s, with the steel workers' union opposition to management's efforts to modernize the American steel industry. The unions were successful in saving steel worker's jobs, increasing wages and benefits, so America entered the 1960s with a steel industry stuck in the 19th century. The problem with that was, after America bombed the German and Japanese steel industry to rubble in World War 2, we then funded Germany's and Japan's reindustrialization with the Marshall Plan in the early 1950s. Beginning in 1960, Andrew Carnegie's 90-year old steel mills could no longer compete with the foreign, and very modern steel industry built after WW2.
But from 1950-59, there was little recognition of this in the stock market, as is evident in the table below where steel climbed to #4 on the list at its peak in July 1959. Notice how growth in the US national debt was also high on the list, as had been the case since 1938.
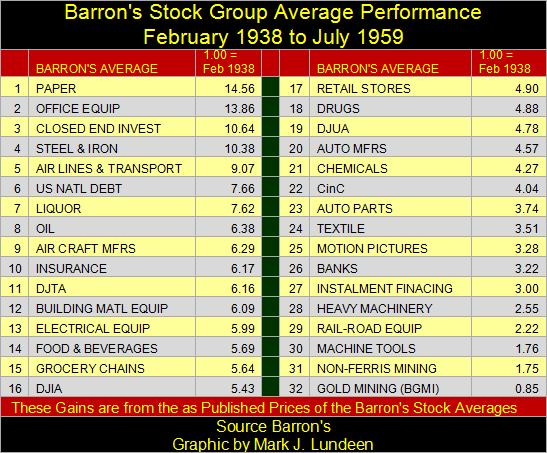
During this 21 year period, the Barron's Office Equipment Average increased by a factor of 14, while steel stocks increased by 10; that plus healthy dividends made the steel stocks a major market sector in the 1950s. In this country, as elsewhere, there is always someone shooting themselves in the foot by concentrating on short-term gains, while refusing to consider the strategic long-term implications of their actions. As for American steel workers, they enjoyed full employment during the 1950s, but by the 1970's, their industry had become the "rust belt." Few, if any American steel workers ever received the generous retirement packages negotiated by their unions in the early 1950s. Isn't it strange, how when we want it all, we frequently end up with nothing.
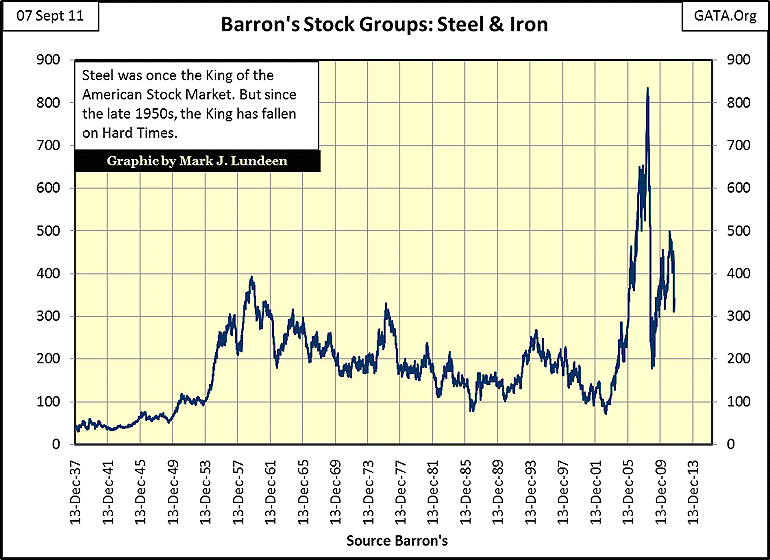
Examining the 50 year historical record of the Barron's Stock Averages, it is very apparent that from 1938-88, running with the pack and investing in the current hot group was not necessarily a sound investment strategy for the longer term. But there were exceptions to that, like investing in high-tech office equipment.
I wish I had market capitalization data for the various stock groups. Fortunately, I do have weekly data for the Dow Jones Total Market Groups (DJTMG) which includes volume data for each of its groups. Trading volume should be an adequate proxy for market cap. I examine each group's weekly volume as a percentage of total weekly trading volume for all the groups in the DJTMG, and then compute each groups' trading volume as a percentage of the 100% total. Trading volume from week to week can be very erratic, so I take a 10Wk moving average of the data to smooth out short term extremes.
Looking at last week's data in the table below, where banking, energy and high-tech take the top 10 spots, I think trading volume proves to be a very serviceable proxy for market cap. Something to keep in mind; the Barron's Stock Average tables above are indexed for price gains over many years, but the DJTMG tables that follow rank trading volume for the specific week listed.
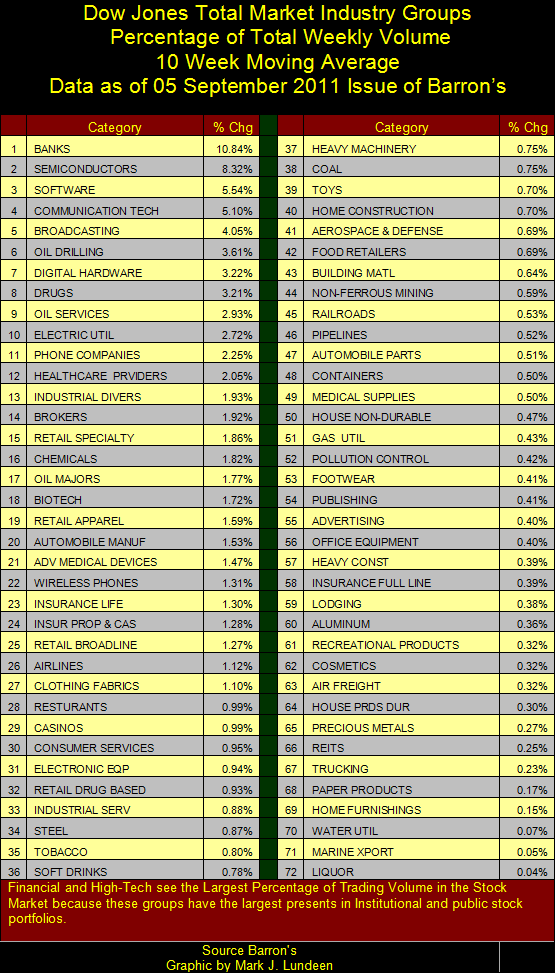
Trading Volume for the banking and high-tech industries (#1,2&3) is huge. Using a 10 week moving average, these two groups comprised 24.70% of all the trading volume for all 72 market groups last week. To get an idea of exactly what this means, the top 2 groups in the table above have as much trading volume as groups #27-72 combined! American banks and high-tech stocks must be widely held by professional-money managers around the world.
To show how relative trading volumes change over time, let's take a look at this data for Barron's 16 March 1992 issue. Remarkably, from a trading volume perspective, the stock market has changed little over the past two decades, with financial and high-tech groups still the trading volume leaders, but there are differences. Look at oil drilling; it moved up from #47 below to #6 above, as well as the life insurance group.
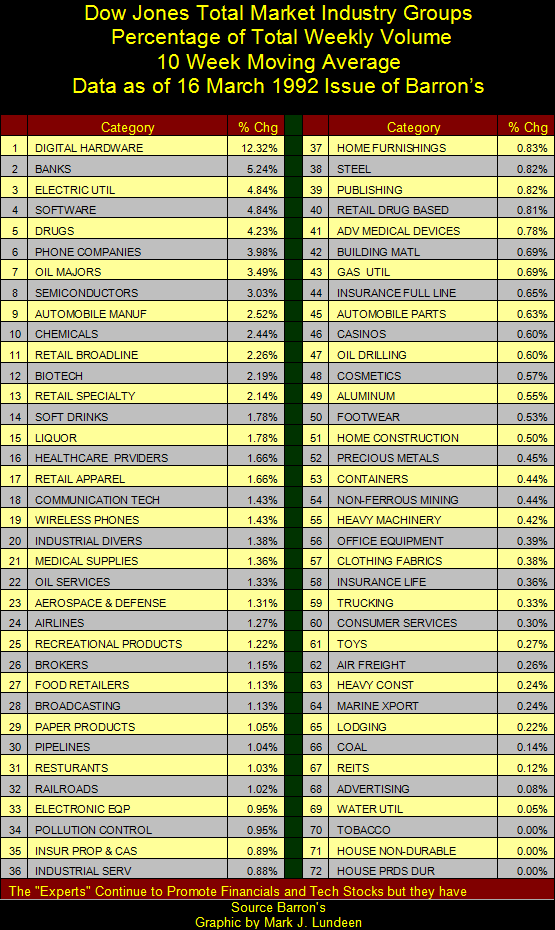
The point of all this is that given sufficient time, things change whether we like it or not. Volume data for the Barron's stock groups unfortunately does not exist. But if it did, I'd expect the steel industry from 1938-59 would have been in the top 10 in trading volume, exactly as the banks and high-tech groups have been since 1992. This will eventually change, as today's heroes have a way of becoming tomorrow's zeros, and today's zeros have a way of becoming tomorrow's heroes. Let's look at today's heroes: high-tech and banks.
Since 1960, high-tech has revolutionized the world. Market commentators in 1960, people like me, used a manual typewriter to write their reports, and sent their opinions to their readers using the US Post Office at $0.04 a letter. By 1992, publishing had become digital. Back in 1959 when steel was still a major stock group, patternmakers used to work in laminated pine using hand tools to carve exacting models for the tool and die industry. Many parts for NASA's early rocket engines started out as a block of wood, carved to demanding specifications by union patternmakers. The same was true for planes, trains and automobiles. But since software companies took their place in the top ten in volume, patternmakers have used Auto Cad and a computer.
Let's face it, high-tech has been an old bore for over a decade. Since I purchased my first computer in 1988 (which ran DOS 5.0 and Borland's Quattro spread sheet), my life has never been the same! Last February I upgraded my hardware; I didn't notice much difference, except that now I'm running Microsoft's Window's 7, a high-tech downer in my opinion. If I could, I'd go back to Window's XP and MS Office 2003.
So, what's new and exciting in high-tech today: Ipads, Ipods, Kindles, playstations and social networking companies. Economically speaking, the introduction of the first electronic spreadsheet and Auto Cad had more impact than these toys. Mobile phones are getting creepy. Not only can their owners download and view full length movies on their tiny screen (assuming the battery lasts that long), but they also enabling the authorities to track their owner's daily movements with real-time global satellite positioning. And people pay for this?
It's hard to believe that this, and social networking stocks are causing all the high-tech excitement in 2011. It's more likely that today's high-tech excitement is actually the last gasp of marketing a dying market niche before it becomes just another trivial and mundane investment. Like the industrial revolution's steam locomotives, steel, silent movies and electric lighting (all former high-tech darlings of the American stock market), the digital revolution's high-tech darlings will inevitably slide down in the volume rankings; because in the stock market, hot high-tech investments have a shelf life.
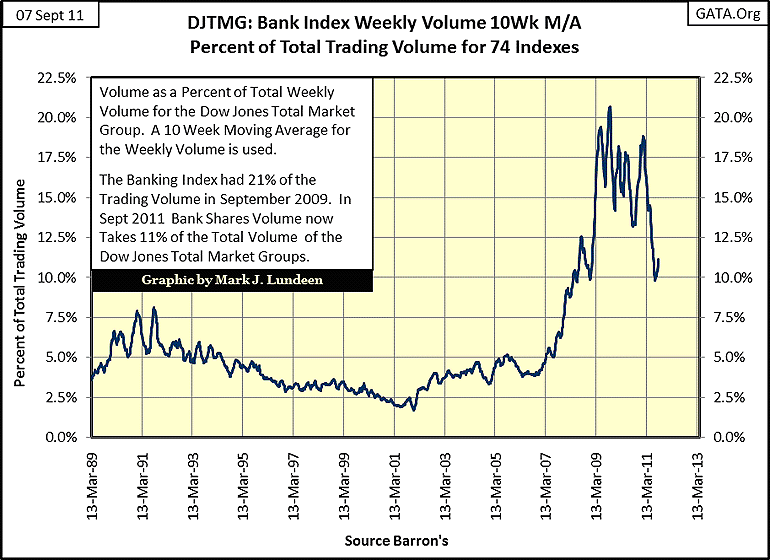
That banks will never go away is an undeniable reality, but that doesn't mean that investing in banking stocks will provide a profit to investors when adjusted for inflation. As shown by the Barron's Stock Averages, they were sub-par investments from 1938-88! And there's nothing permanent about our banking system's current slash-and-burn business model. The post-Bretton Woods banking system's business model, managed by central banks, using dubious financial derivatives by the hundreds-of-trillions, and an ever expanding money supply has been very profitable for the past two decades, as long as the tax payers could be tapped for a few trillion dollars now and then.
But four decades after the Bretton Woods' $35 per ounce of gold link was severed, the banking system has fouled its nest with trillions-of-dollars of illiquid-toxic reserves. The big NY banks who have made derivatives their main focus, should have been shut down years ago by regulators. That the Federal Government has allowed these banks to continue to operate, and make massive campaign contributions to legislators and presidents, should tell us just how corrupt the financial markets have become. Amazingly, with all the problems known about the big NY Banks, the DJTMG banking group volume still makes up 10% of total trading volume in the DJTMG. How is that possible? Like steel in the 1950s, the market has not priced this fact into the valuations of the financial shares. But like steel in the late 1950s, someday it will.
Between now and then, we should see volume explode in the banking shares as everyone, for reasons of financial survival, dumps their shares of these perennial bad-boys of global finance.
Wall Street is aware of the problem, as we can see in this Bloomberg article:
In this article, the big banks see * their problem * as one of "Irrational Prudence Syndrome", where investors go to cash instead of doing the "rational" thing by buying and holding the investments offered by the financial industry. After the high-tech and mortgage debacles, where people lost their life's savings, * OR *, lost their life's savings and are now crippled with debt after the real estate boom went bust, many people are only now waking up to the reality that ever since Alan Greenspan first "injected liquidity" into Wall Street during the panic of 1987, there has been no future investing in monetary inflation, no matter how attractively Wall Street packages it.
What the above article doesn't address is what happens when the "Irrational Prudence Syndrome" becomes terminal, and savers begin to realize that there is absolutely no difference between keeping their life savings on deposit at a bank, yielding 0.15%, or investing in Wall Street's latest investment darling, (such as Enron, Worldcom, or Etoys). Either way, by holding a wasting asset over time (the US dollar), they will end up with a 100% loss. It's an ugly prospect knowing your money will die before you do!
We should expect to see the current volume rankings of the DJTMG change dramatically over the next ten years as the public awakens to the fraud that now passes for finance. I expect to see the current darlings of Wall Street: high-tech and finance, moving down the list, as oil, copper, steel, and precious metals mining rank in the top 10 of DJTMG trading volume over the next ten years. Don't be surprised to see gold mining stocks becoming trading volume leaders in the next few years.
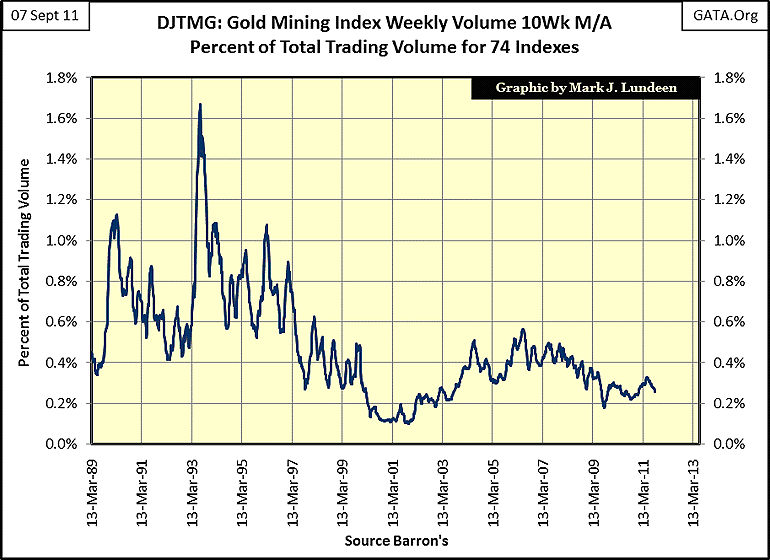
Since 1989, non-ferrous mining has never comprised even 1% of total trading volume in the DJTMG. This is absurd.
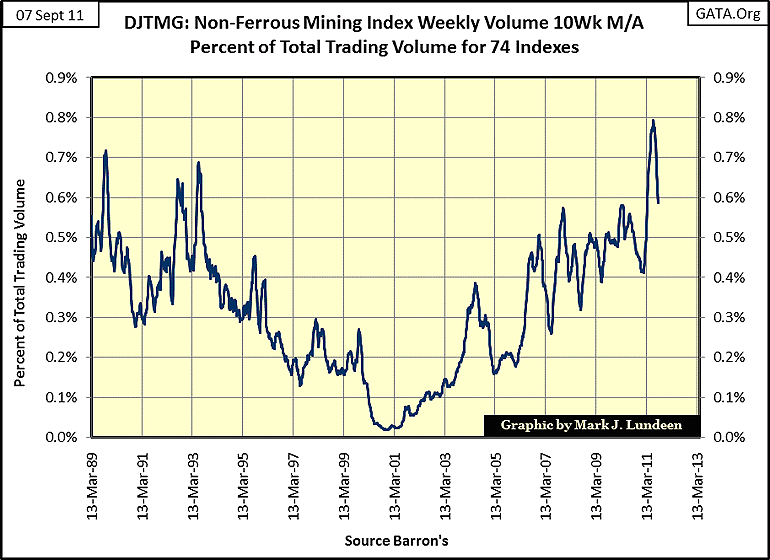
But as we see below, the stock market has been enthralled with semi-conductors and software companies for over two decades. But note that since 2001-02, volume for high-tech has been trending down, as trading volume for non-ferrous mining has been trending up. Seeing these reversals in trading volume from ten years ago makes me more bullish on base-metal mining than high-tech.
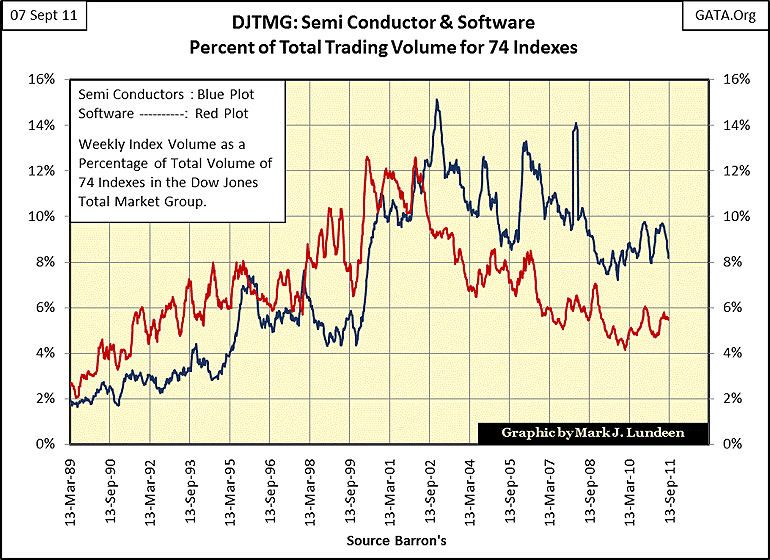
Nothing lasts forever, and that goes double for decade-long trends in the stock market. In the next decade, I expect we'll see rags-to-riches market stories coming from boring old precious and base-metal mining, and the current crop of high-tech billionaires will become living relics from a bygone era. One thing for sure, if we are to survive, banking shares must fall out of favor for reasons of economic necessity, as their fraudulent business model becomes extinct.
[email protected]


