Barron's Gold Mining Index And Gold & Silver In 1920 Dollar Terms: THEY'RE CHEAP!


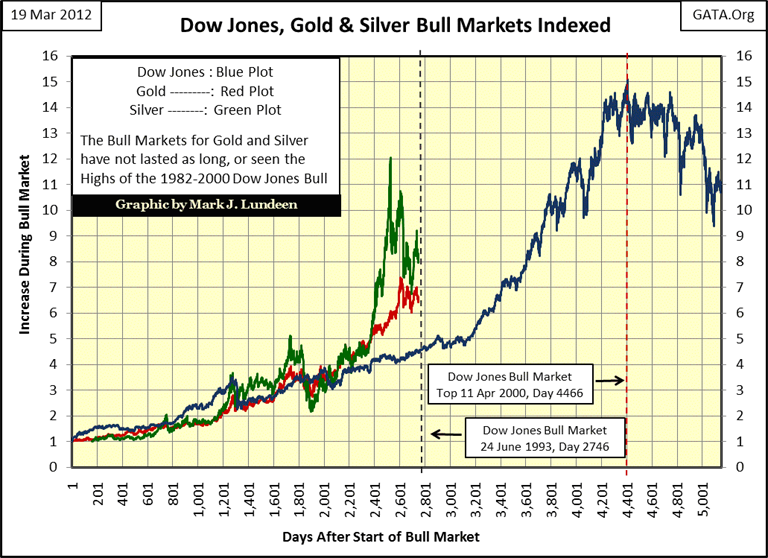
So how's the bull market in gold and silver going? As seen below, they are doing just fine. In fact gold and silver are doing better than the Dow Jones 1982-2000 bull market was at its day 2,746 on June 24, 1993. If we compare the progress of gold and silver to the Dow Jones, and all too many analysts mistakenly do, we might come to a conclusion that we are at, or have passed the mid-point of possible gains for our favorite metals.
But why use the Dow Jones, or any stock market index as a bench-market for what is possible for the old monetary metals? Look at the situation this way; the price of anything, and everything, is determined by the supply and demand in the market. This is true even with our current "regulated market" system.
It's important to realize that if the Federal Reserve's "Wiz Kids" could have "stabilized" the markets during, and after the credit crisis * without * printing money to support financial-asset valuations, they'd have done so. But to feign demand for financial assets that is absent in the market, central banks are forced to bloat their balance sheets by trillions of dollars, euros, or whatever unit of currency they print. So, governments and their bankers still find themselves subservient to the law of supply and demand. If they want prices higher in the stock and bond markets than market's natural fundamentals would have them, the "policy makers" have to step in and become top bidders in the markets, paying prices no one else will, using as many tens of billions, or trillions of dollars of monetary inflation as it takes to achieve today's contrived asset prices.
In any event, the supply and demand characteristics for the stock market are completely different than for the old monetary metals' market. Take a look at the number of stocks trading at the NYSE and the NASDAQ from 1938 to today. The supply of listed stocks trading on the NYSE and NASDAQ expanded greatly, until the end of the high-tech boom. This is especially so after the start of the 1982-2000 bull market in stocks. I don't have the data, but due to secondary offerings and stock splits from 1980 to 2000, companies like General Electric must have increased their total authorized stock float by at least a factor of ten. The huge increase in common stock listings, and the increasing number of shares traded from stock splits and secondary offerings, had a huge effect in the valuation of stocks and indexes, as money coming into the market had more and more choices to flow into.
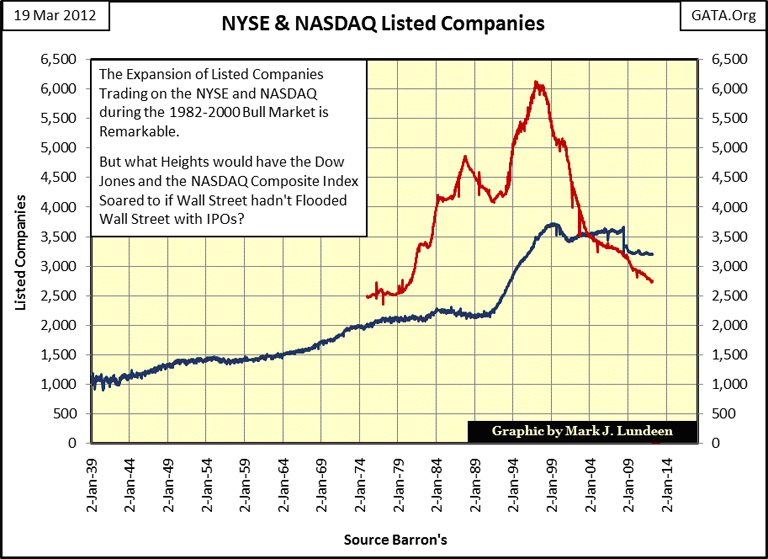
I'm not suggesting that there is anything wrong with this. Well, actually there was with the NASDAQ from 1995-2000, as Wall Street's M&A boys flooded the stock market with garbage IPOs for internet stock, but that is another story. I'm just noting that in a free market system, the success of Coke Cola in the stock market will always result in a Pepsi Cola being eventually listed too; it's called competition.
But gold and silver are completely different, because Wall Street can't increase the supply of * Actual * gold and silver in the physical metals market via IPOs, as "investment bankers" did in the stock market from 1982-2000. Only exploration and mining companies can increase real metal in the metals markets. Also, ounces of gold and silver never declare stock splits. The relatively fixed nature of the available supply of metal exposes the price of gold and silver bullion to the full impact of money panicking towards it. Or at least will after the New York and London paper markets and precious metals ETF managed by the big NY banks such as GLD & SIL are weighed, and found wanting.
It's also important to realize that during the 20th century, financial assets, * not * gold and silver, were the primary beneficiaries of monetary inflation. Twice since 1920, the US Treasury increased dollars in circulation beyond the US Treasury's gold reserves needed to redeem them. Ultimately, this inflation caused the US government to reneging on its US dollar's gold obligations, but before these defaults, the Dow Jones experienced massive-inflationary bull markets. The first gold default was in 1934, which resulted in the Federal government confiscating its domestic gold coin and bullion. Then again in 1971, Washington defaulted on its global gold obligations. However, before paper dollar inflation forced a gold default, in both cases the stock market saw significant bull markets from 1921-29, and 1948-66.
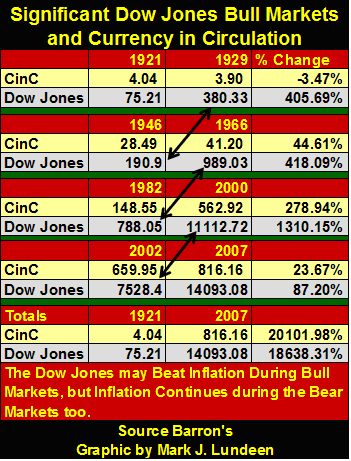
A small note (and table), for the next chart is necessary here. If the 1949-66, 1982-2000 and 2002-07 Dow Jones bull markets don't appear as much of a bull market in the next chart, it's because these plots for the Dow Jones and the BGMI are corrected for CinC inflation. In other words, they are plotted in 1920 dollars. The table below, using weekly closing values, gives the specifics for US Currency in Circulation (CinC) and the Dow Jones. Look at the 1921-2007 totals. I think this makes the case that since 1921, after taxes and inflation, the Dow Jones has been a losing investment as the Federal Reserve, year after year, has relentlessly inflated the US money supply, and the Internal Revenue Service taxes phantom capital gains.
Note in the table below, the beginning of each Dow Jones bull market starts at a value below its former bull market top (see arrows), while the Fed's CinC after 1929 (listed in billions), only increases year after year.
Returning to the chart below; since 1920, bull markets for the Dow Jones and the Barron's Gold Mining Index have had a relationship with monetary inflation. Inflation is the prime mover for Dow Jones bull markets, until the inevitable monetary crisis arrives. At which point the BGMI is driven upwards as flight capital floods into mining shares, as wealth seek safety from deflating financial assets. It's as simple as that. Now for the third time in ninety years, this pattern is about to repeat itself with the BGMI, and mining and exploration stocks on the edge of their biggest bull market in its history.
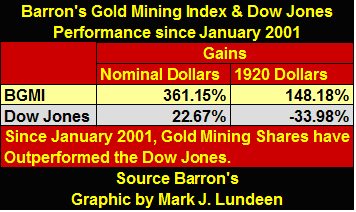
In fact, it has already begun. Since 2001, the BGMI has outperformed the Dow Jones in inflation corrected, and nominal terms. I'll be the first to admit the junior producers and exploration companies have been in a funk since 1997, but since 2001 the major gold and silver producers have been great investments, and will continue to be for a long time to come.
That the financial media has chosen to ignore these long-term trends is largely due to how investment advice is propagated in today's media: by star, know-nothing reporters who have chosen to focus on the opinions of beached whales in the financial assets markets, or hot traders looking for fast money, people whose time horizon is never longer than a few months. But this ninety-two year chart tells the real story: the BGMI is just a currency crisis away from once again blasting-off to amazing, inflation adjusted highs. Take a few moments and study this chart carefully.
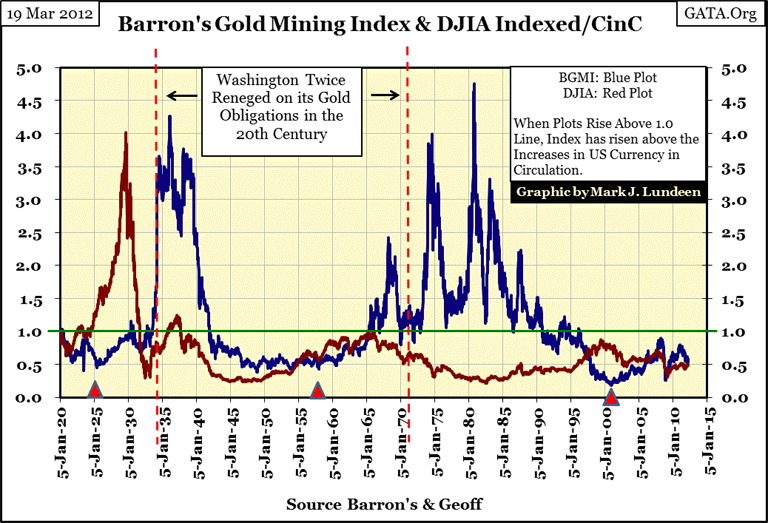
It's obvious that two major 20th century Dow Jones bull markets occurred during an inflationary cycle * before * a monetary crisis resulting in a US Treasury gold default. * AND * after the default, the BGMI saw a tremendous bull market that exceeded the gains seen in the previous Dow Jones' bull market. And it looks like the BGMI is going to do it again.
Today the US Treasury cannot directly default on its gold, as it demonetized gold in 1971, so it has no direct gold obligations to default on. But ejecting gold from the global money supply forty years ago will make the coming monetary crisis even more destructive. Also for decades, governments and their central banks have actively suppressed the market price of gold and silver by using phantom gold and silver in the New York and London paper markets. In March 2010, Jeffrey Christian of the CPM Group testified before the CFTC that the NY and London gold markets had 100:1 leverage in their paper contracts. That's insane, even criminal; selling every one ounce of gold they had to one hundred people in a futures market. What happens if only 2% of the contract holders ask for delivery? These markets will be exposed as fraudulent.
Think of this! That means that the current price of gold is based on the assumption that there is 100 times more the gold than is currently in existence! Also, European governments are becoming concerned with what the Federal Reserve is doing with their nation's gold stored in New York; which the Fed is in no hurry to explain.
"Fraud and falsehood only dread examination. Truth invites it...Whoever commits a fraud is guilty not only of the particular injury to him who he deceives, but of the diminution of that * confidence * which constitutes not only the ease but the existence of society." -- Dr. Samuel Johnson, 1709-1784: English man of Letters and Moralist
All and all, a historic collapse in "confidence" in financial assets, and national fiat currencies is at hand. A day is soon coming when a panic into the actual precious metals will start. The large gold and silver miners in the BGMI will perform as they always have in the past: wonderfully. But I expect the gains in the junior producers and exploration companies will be breadth taking. Why might that be? Because in the past ten years, central banks and Wall Street have polluted the balance sheets of pension, mutual funds and insurance companies with trillions of dollars of toxic byproducts from their derivatives operations. The markets for physical gold and silver, and their major producers are simply too small to contain the coming derivative blow back into precious metals. Smaller companies will finally catch monster bids as fiduciaries and hedge funds decide that even moose pasture in Northern Canada is a safer risk than US mortgages and Treasury bonds.
But what do I know? I know that Robert Rubin, Secretary of the Treasury for President Clinton, and the architect of the 1990s "strong dollar policy" is becoming concerned that he has too many dollars! From Bloomberg:
Rubin Says He Has Too Many Dollars 13 Years After Departing U.S. Treasury
Robert Rubin, who as U.S. Treasury secretary in the 1990s promoted a stronger dollar, said he has too much of his personal investments in the currency.
A "disproportionate amount" of his assets are in cash and he "should be more allocated away from the dollar," Rubin, 73, said yesterday in a speech at the TradeTech conference in New York. He said he also was "greatly overweighted" in private equity and had investments in hedge funds.
This is an incredible statement. I assure you that during the gold standard, no one had any fears of owning too many dollars.
For your information, Mr. Rubin along with Alan Greenspan, was instrumental in allowing the US banking system to create the OTC derivative market, as an "unregulated" (read secret and untraceable) institution. Thirteen years after he left the US Treasury, he's now concerned that he too may reap what he has sown.
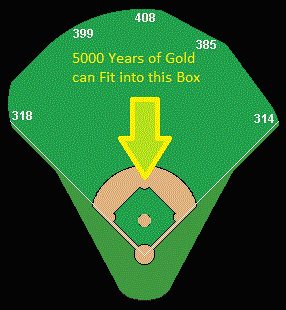
Here is the problem for the "policy makers" (like Robert Rubin); since 1980 they have expanded their money supply by orders of magnitude. How many times could our money supply, in a stack of $1 bills, go to the moon and back? Something like 27 times the last I heard. But all the gold mined on Earth in the past 5000 years can still fit comfortably inside Yankee Stadium's infield, and there is less silver above ground than gold!
So keep an iron hand on the tiller, and keep buying gold, silver as a core position, and mining shares to maximize capital gains, as they are really cheap!
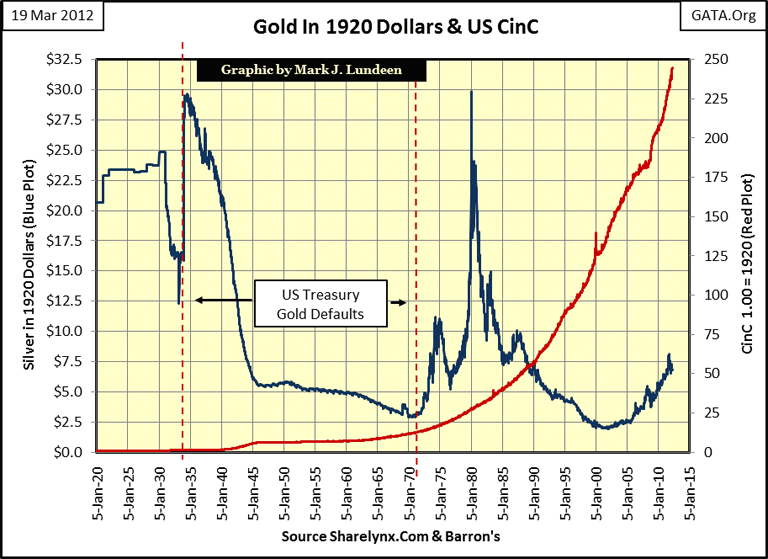
How cheap? Well, really cheap when we look at their prices in 1920 dollars, as I did for the Dow Jones and BGMI in the chart above. In the following charts, we see how the Federal Reserve, the Great Engine of Inflation, has increased US Currency in Circulation by a factor of 244 since 1920. Deflating the price of gold with constant 1920 dollars gives us a current price of gold of only $6.78 (1920 dollars) as of the close of last week. This is far from gold's January 1980 high of $30 (1920 dollars) for an ounce of gold. For gold to once again see $30 in 1920 terms, it would have to increase to $7350 in today's dollars. But this price is a moving target, as the Fed will continue to inflate the supply of paper dollars in circulation until armed guards bar the doors to Doctor Bernanke at the Washington Fed. I don't know if that would make a difference, as the good doctor would most likely go to the nearest park bench and create more dollars with his I-Phone.
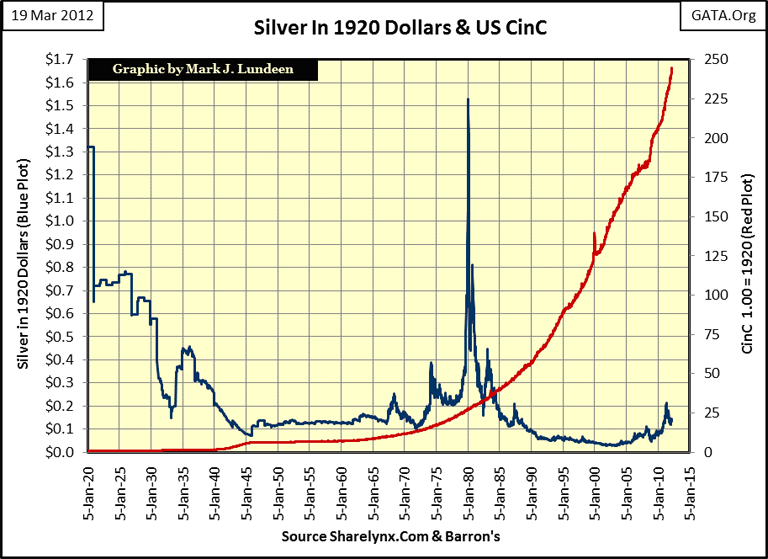
Let's look at silver. At the close of last Friday, silver was going for $0.133 in constant 1920 dollars.
This is all very interesting, but most of you realize that gold and silver are now purchased in Secretary Robert Rubin's "strong dollars"; dollars that even he now wants distance from. Sad but true. But these charts strongly suggest that most of the potential gains in the current bull market in gold, silver, and by proxy, gold and silver mining shares are still in their infancy, with most of the really big gains yet to come. For the third time in the past ninety years, the BGMI is sitting on the launch pad, with all systems go - except for the final monetary crisis. I know it, Mr. "Strong Dollar" fears it, and now you should strongly consider what these charts are telling us.
Mark J. Lundeen
[email protected]
[email protected]


