The Battle For Control Of Gold And Silver Prices


There was some important price action in the Precious Metals Complex this past week as both gold and silver each tested important overhead resistance again. Always keep in mind that time is relative when it comes to the size of big patterns vs smaller patterns. When a multi-year trendline is in place the breaking out and backtesting process can seem like it takes forever before you see some type of resolution to the pattern or trendline which has been the case with gold and silver recently.
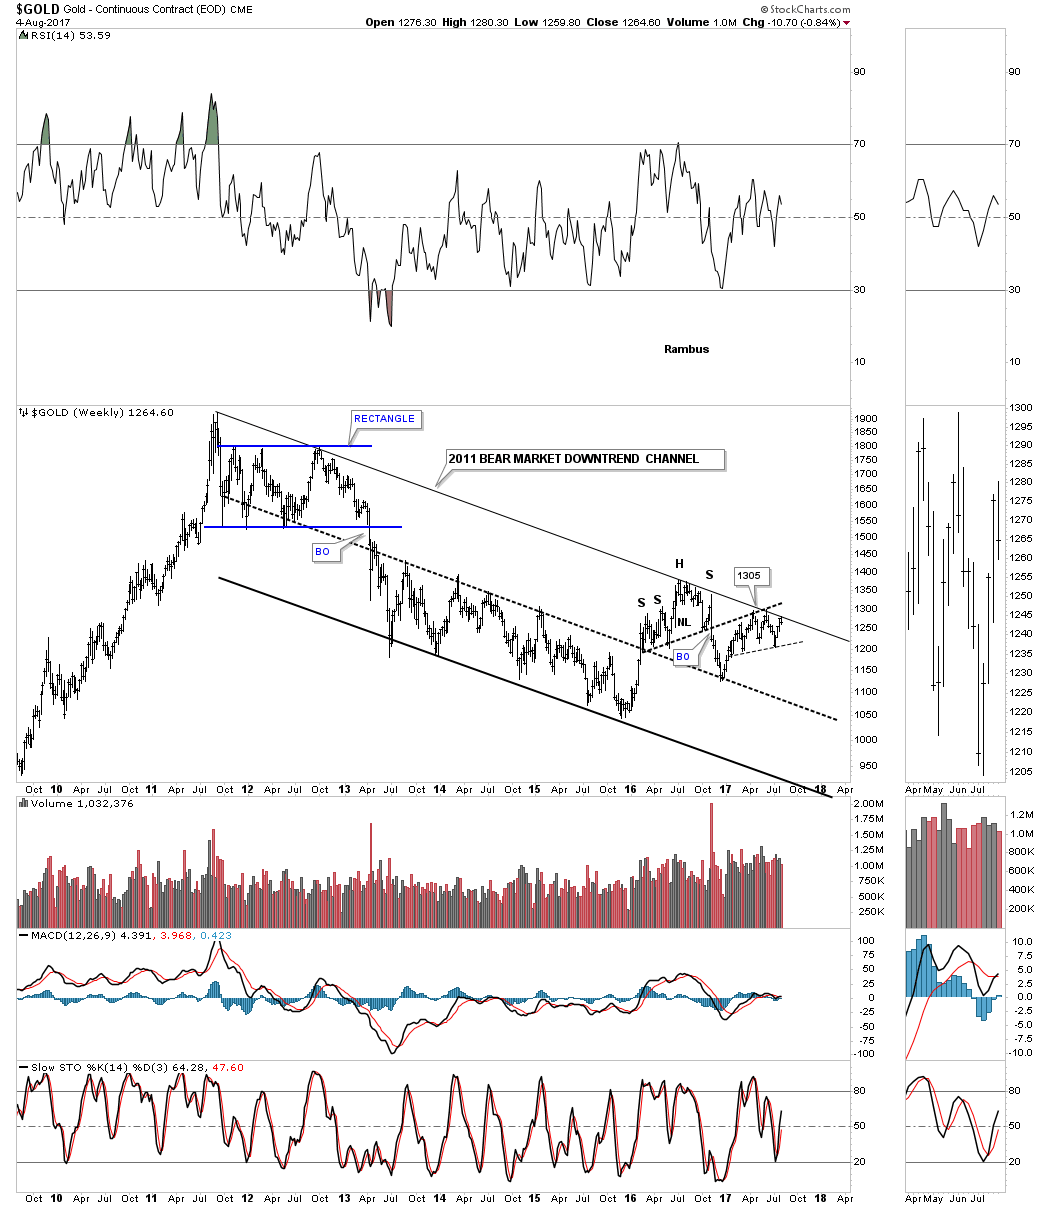
Lets start with the long term weekly chart for gold we’ve been following for a long time now which shows its 2011 bear market downtrend channel. Almost exactly one year ago this month gold touched the top rail of its 2011 bear market downtrend channel at 1305 which held resistance. After a small decline gold once again rallied back up to the top rail of the 2011 bear market downtrend channel and failed once again. After another small decline gold has rallied back up to the top rail of the 2011 bear market downtrend channel which now comes in around the 1280 area.
I can count 9 touches now of the top rail so we know it’s very hot and to be respected. As I’ve mentioned on each of the previous hits to the top rail that it was up to the bulls to show us they were ready to take control away from the bears if they could take out that 6 year downtrend line. As you can see on this weekly chart for gold, now is the time for the bulls to step up to the plate and let the bears know they mean business. They can’t do it with talk, they need to show their strength.
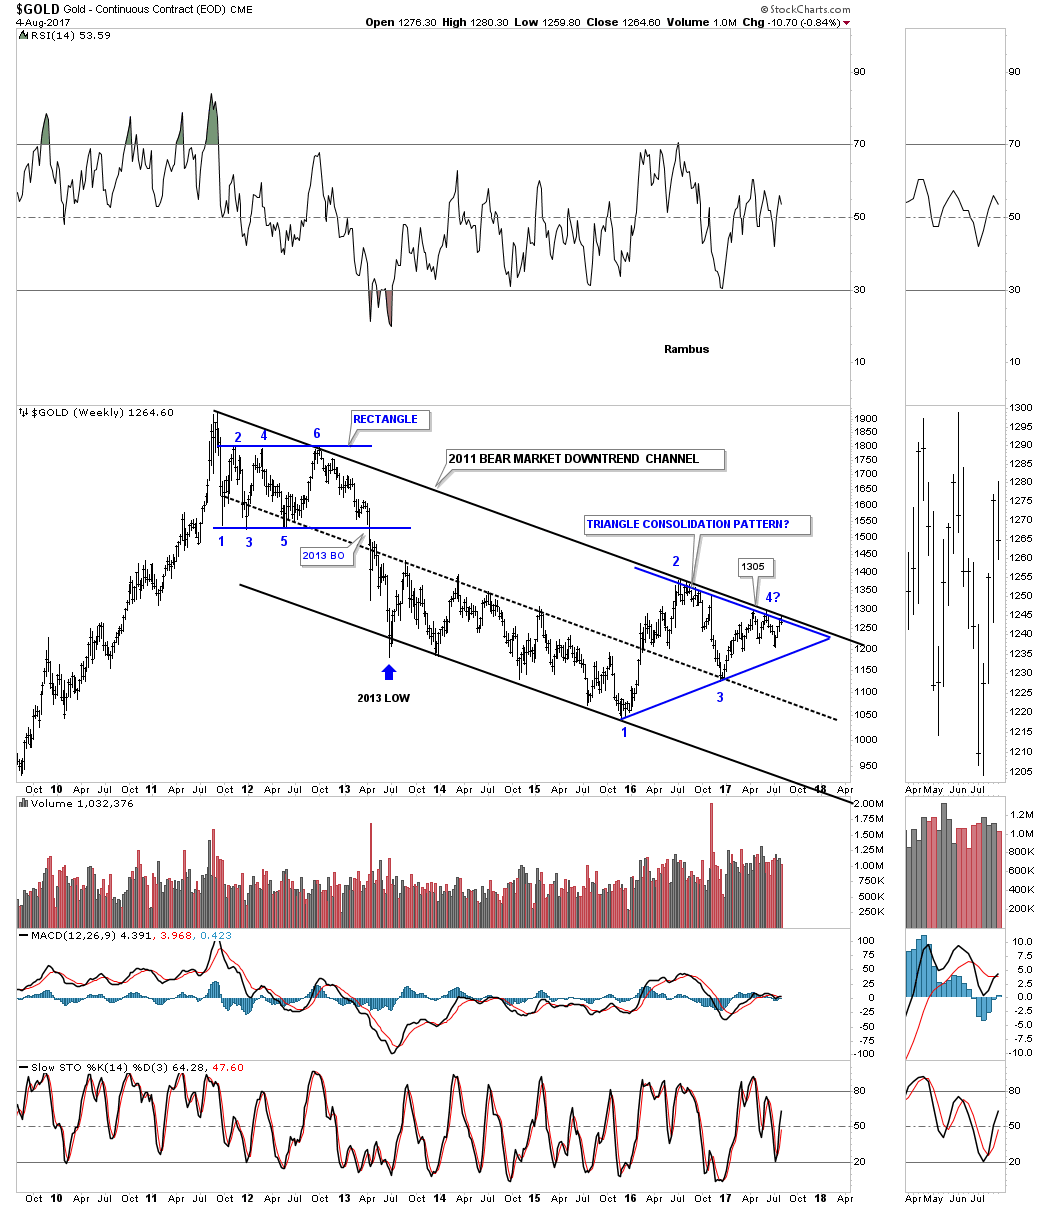
Another weekly view:
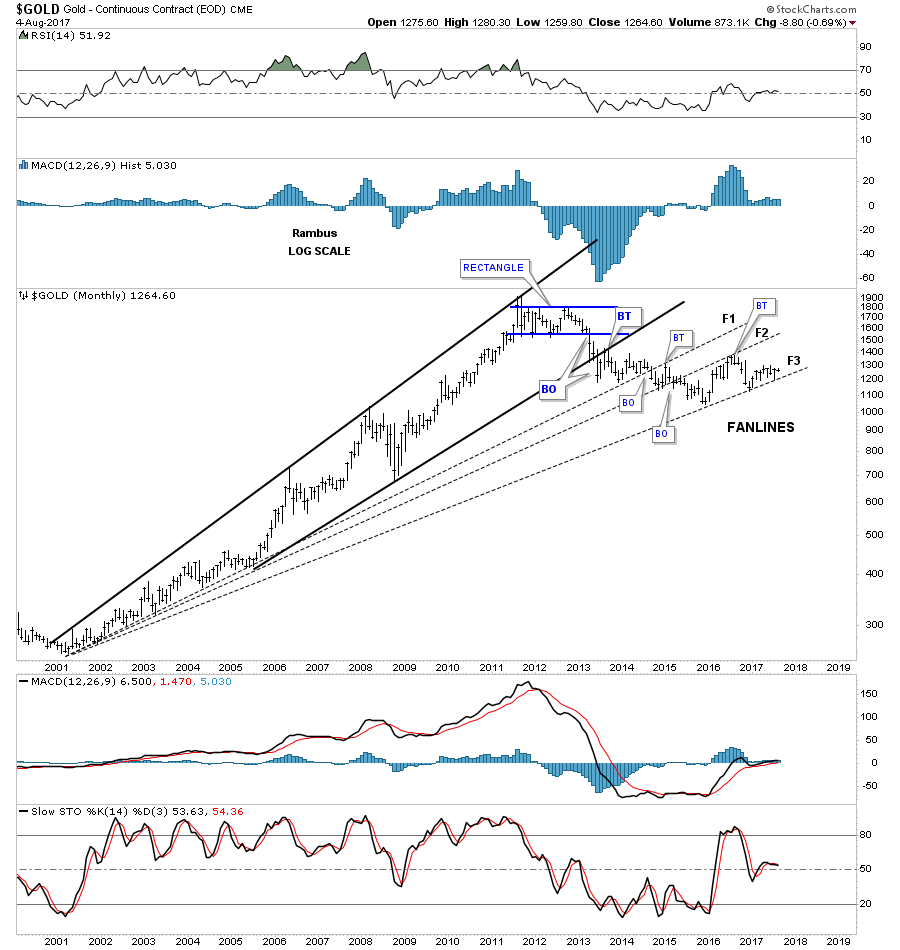
I can’t remember if I’ve ever have shown you this long term monthly chart for gold which shows three fanlines. The rule of thumb for fanlines is, when the 3rd fanline is broken to the downside, in this case for gold, it confirms the downtrend. Another thing you see with fanlines is that when they’re broken to the downside you will generally see a backtest to the underside before the next decline begins.
If the price action can trade below fanline #3 that will be another piece of the puzzle that the bear market is still in progress. It’s not always the case, but we should see a backtest to the underside of fanline #3 before we really see the impulse move down begin in earnest. As this is a long term monthly chart it’s going to take time for all the moving parts to become properly aligned to really gets things moving to the downside if in fact the bear market continues. If gold can take out the top rail of its 2011 bear market downtrend channel then the 3 fanline principal will be negated.
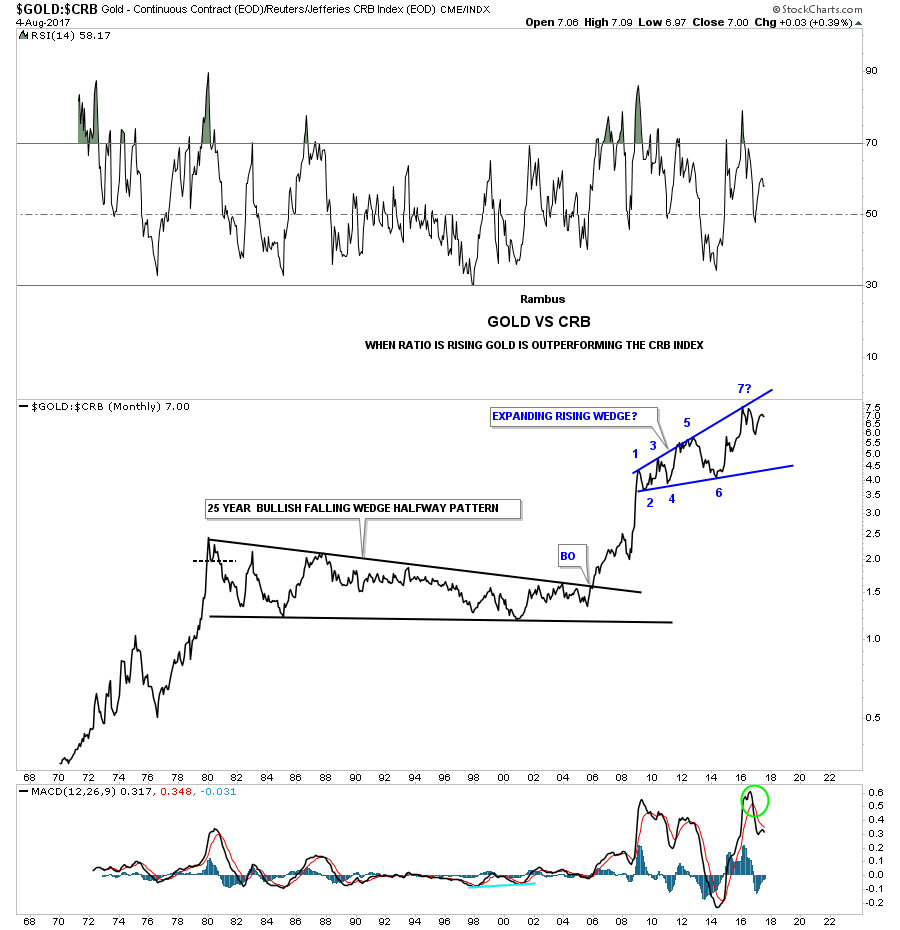
This next chart for gold is another chart I haven’t shown you in a very long time which compares gold to the CRB index. I know there are a lot of doubters out there in regards to very big multi-year consolidation patterns. This ratio charts shows a 25 year bullish falling wedge which I labeled as a halfway pattern to the upside. For the past 7 years or so this ratio has been building out an expanding rising wedge which completed the 6th reversal point in early 2016 that technically makes the pattern a consolidation pattern if the price action can take out the top rail. On the other hand a break below the bottom rail would complete 7 reversal points and the expanding rising wedge would be a reversal pattern. Since this ratio has favored gold for such a long time maybe it’s time to the commodities complex to have a go at it for a while which would show up as a falling ratio.
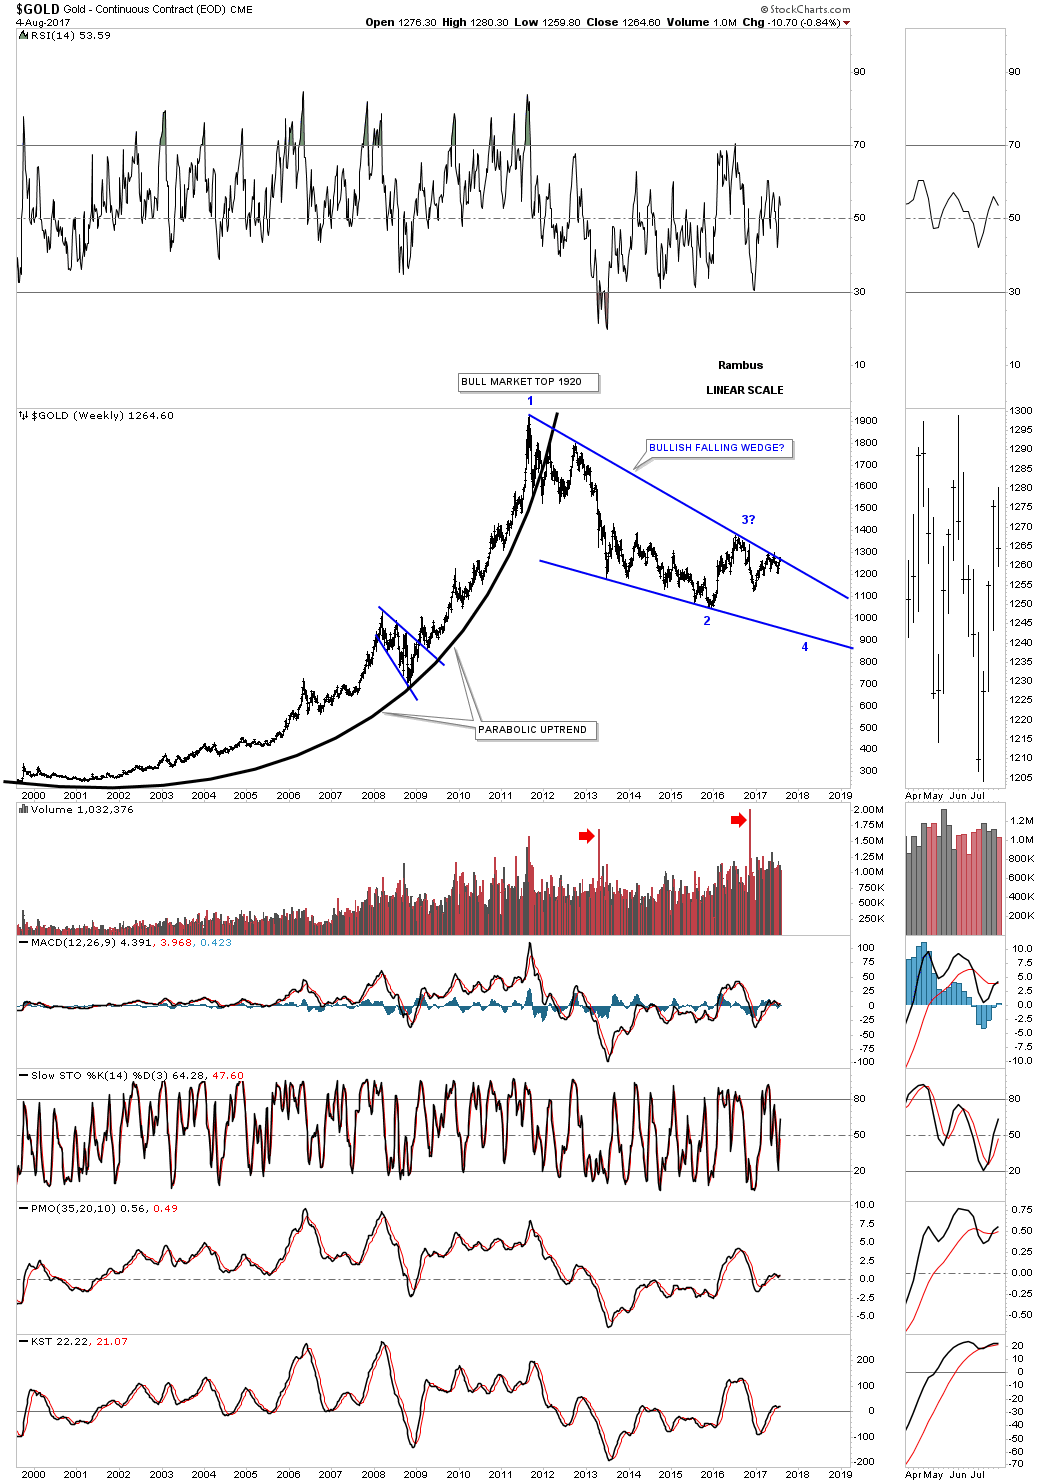
This next long term chart for gold shows a potential bullish setup, but it won’t happen until the 4th reversal point is reached at the bottom rail of a potential bullish rising wedge.
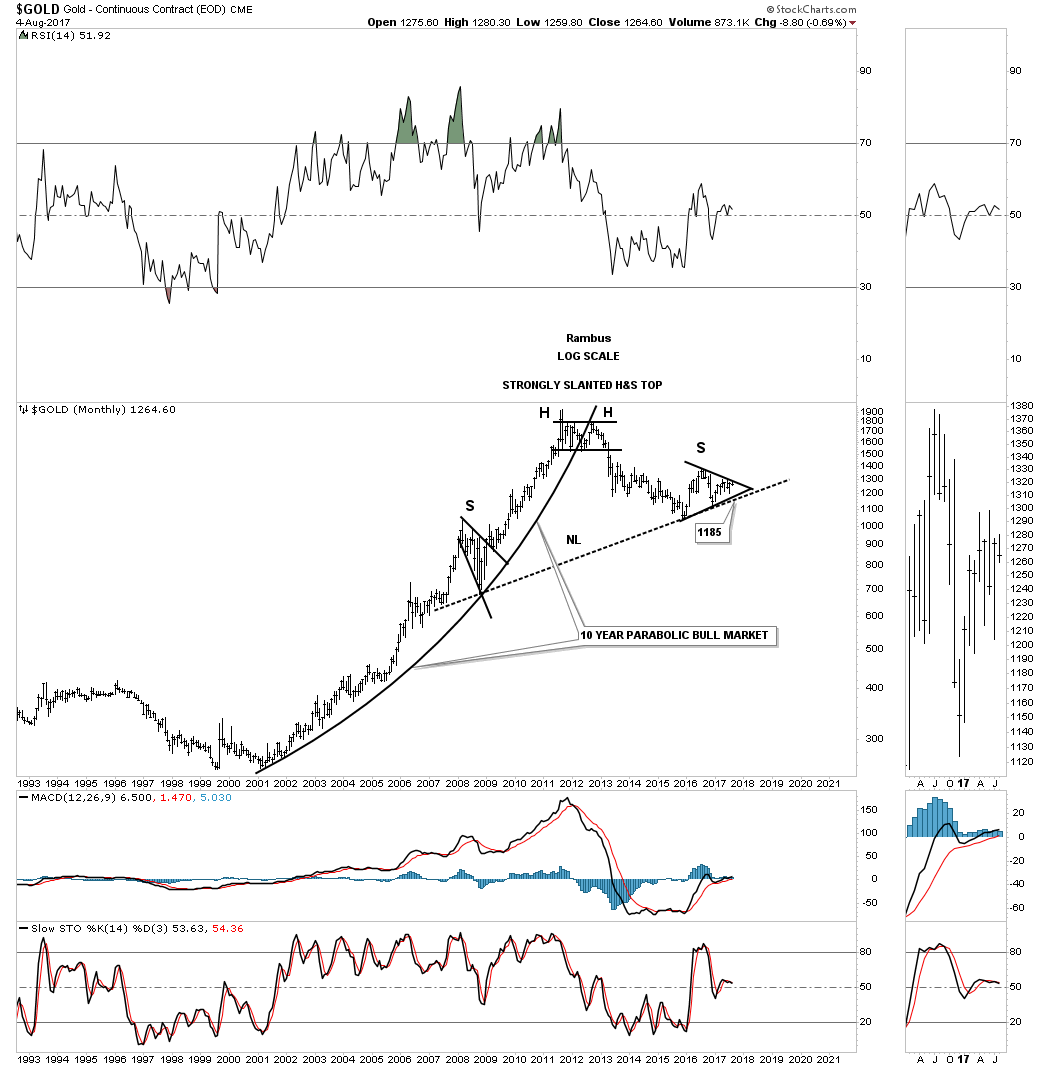
The still potential bearish case for gold. The breakout point is now up to the 1185 area.
Which trendline is going to fail?
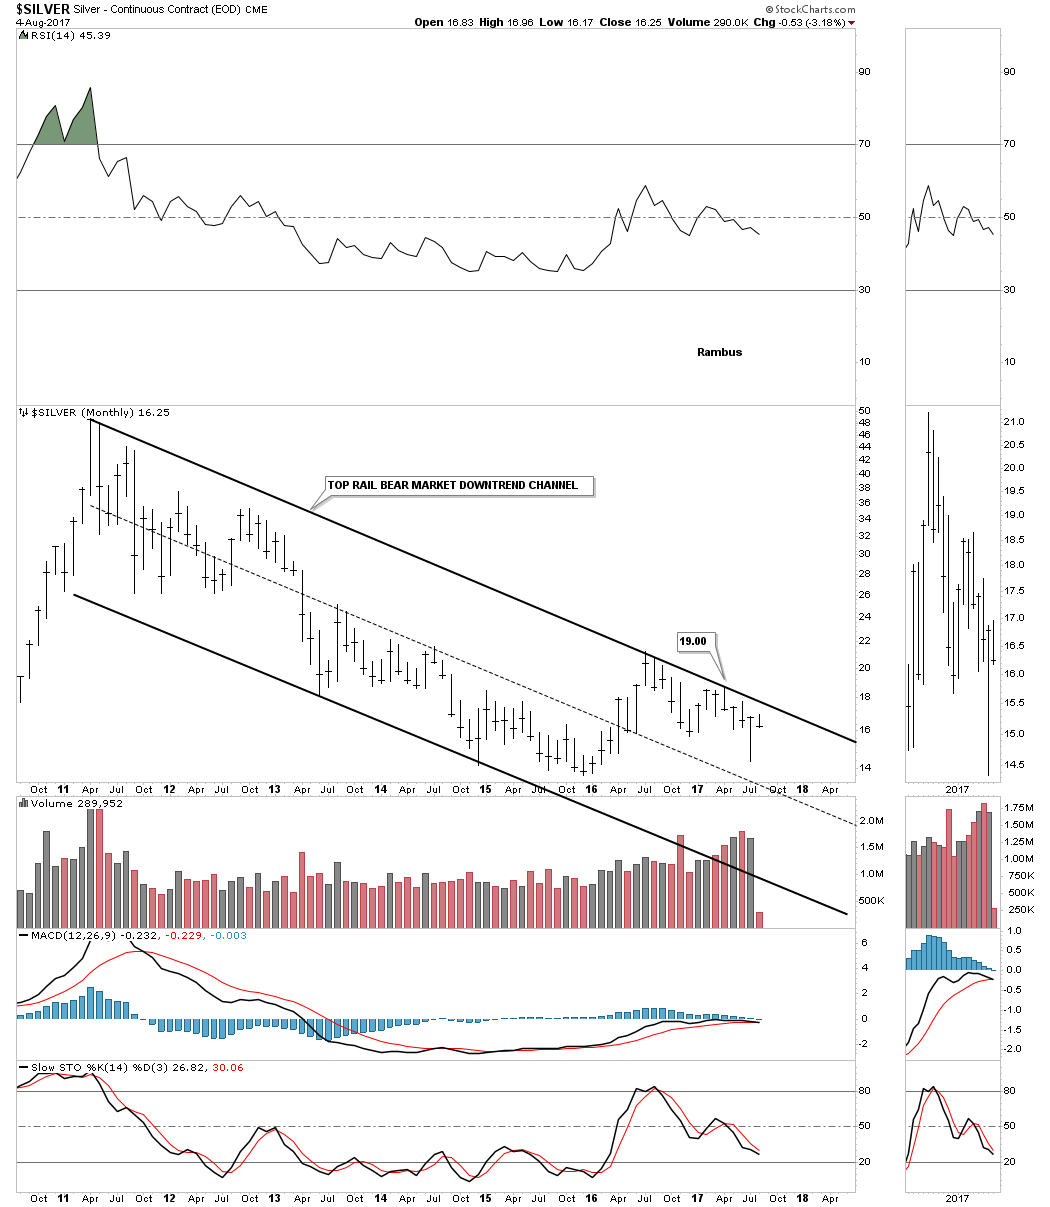
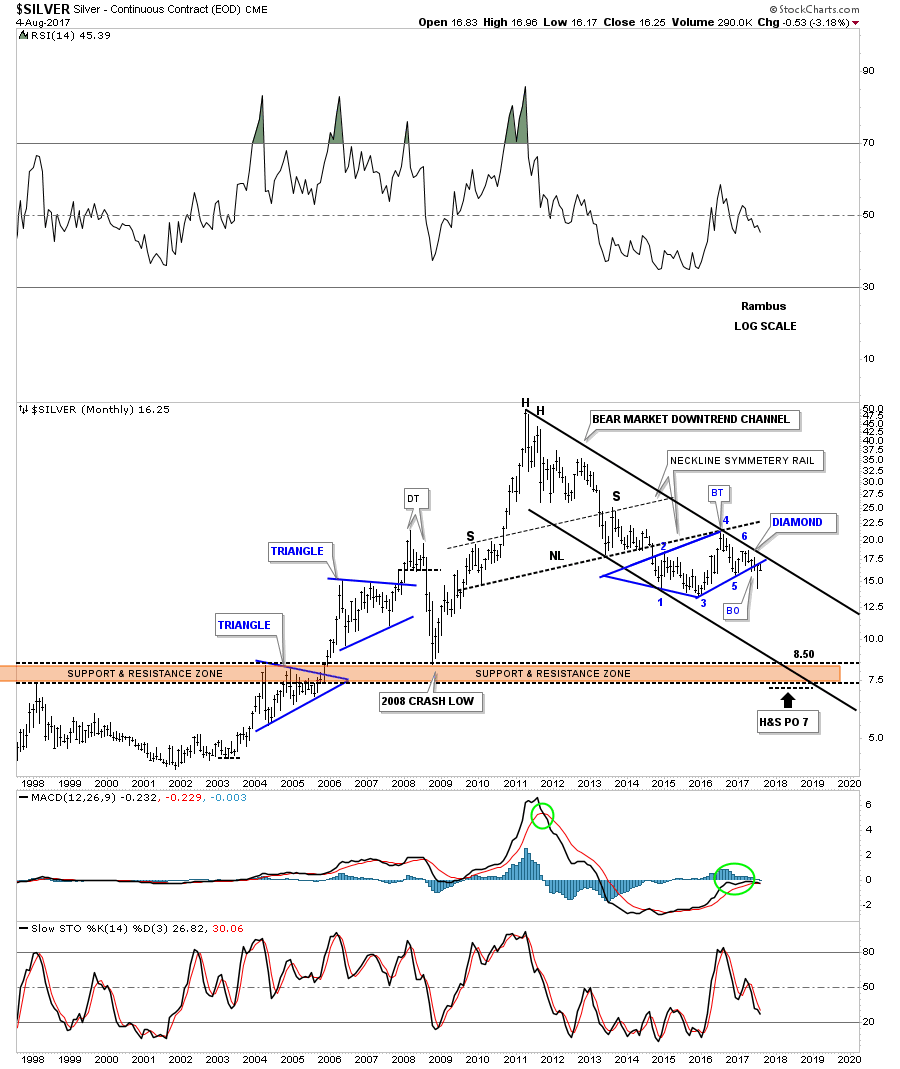
Below is just a simple monthly chart for silver which shows its uncluttered 2011 bear market downtrend channel.
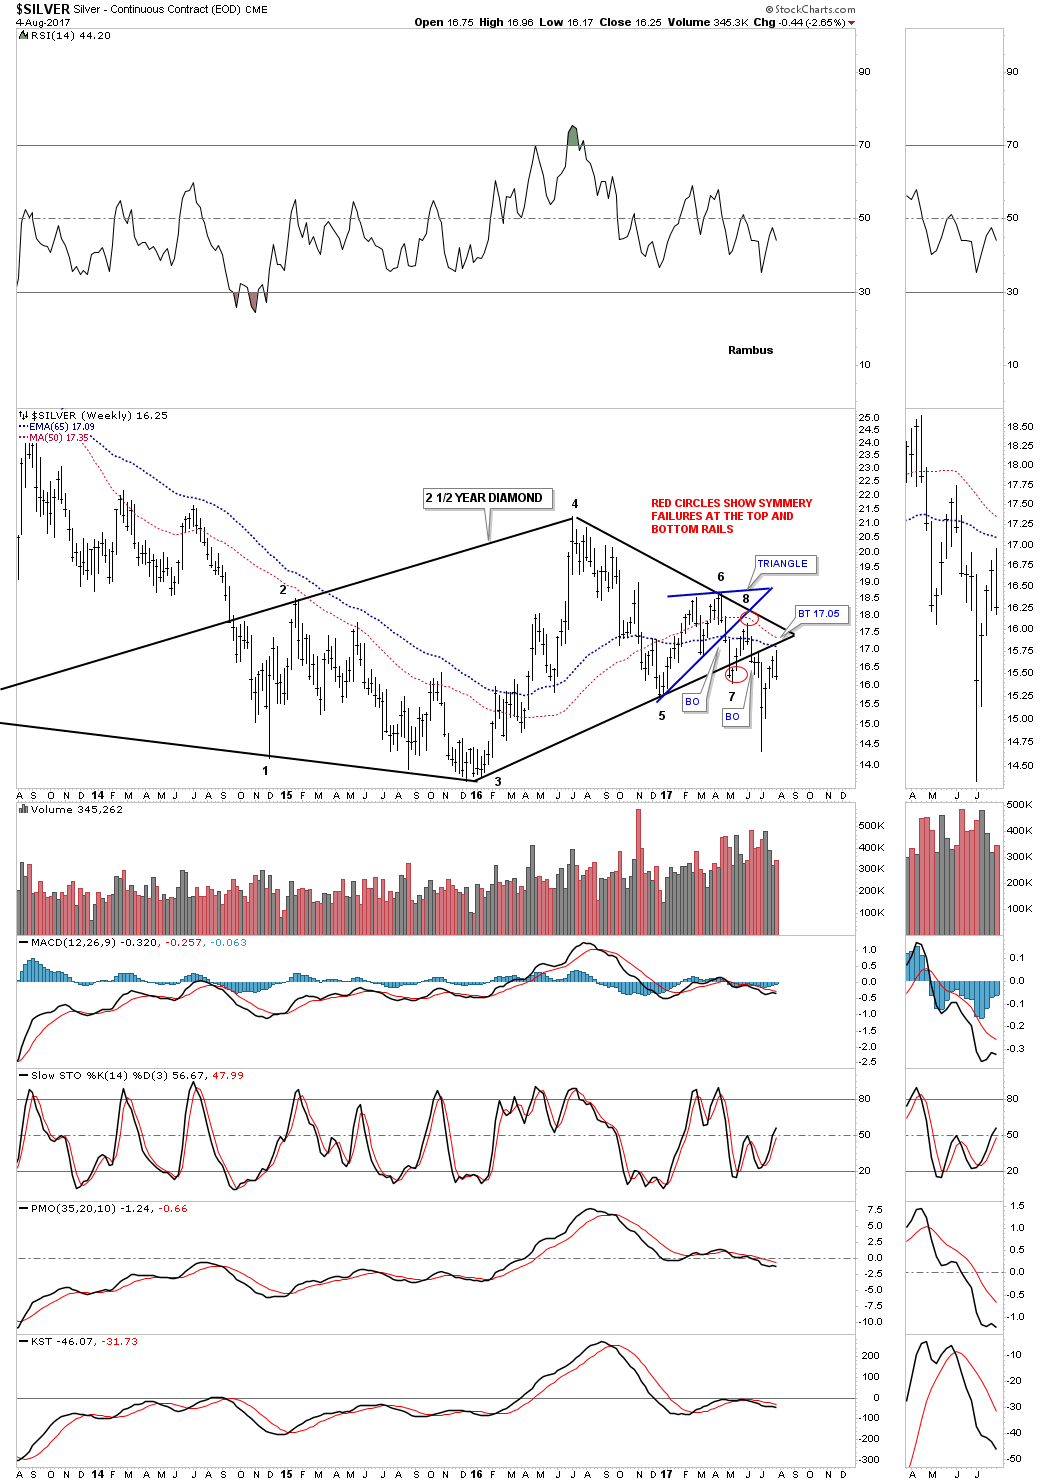
Putting all the pieces of the big picture together this 20 year monthly chart shows a massive H&S top with the blue diamond forming just below the neckline as the backtest. Keep in mind we’ve been following that massive H&S top for several years now. Until something breaks the character of that H&S top, it is there for everyone to see who have an open mind. This is a similar situation we saw back in 2011 when the massive H&S tops formed on the PM complex, which no one wanted to believe what the outcome could be. Silver could rally $5.00 dollar tomorrow and knock this scenario to the ground, but until it does I have to respect what this chart is strongly suggesting.
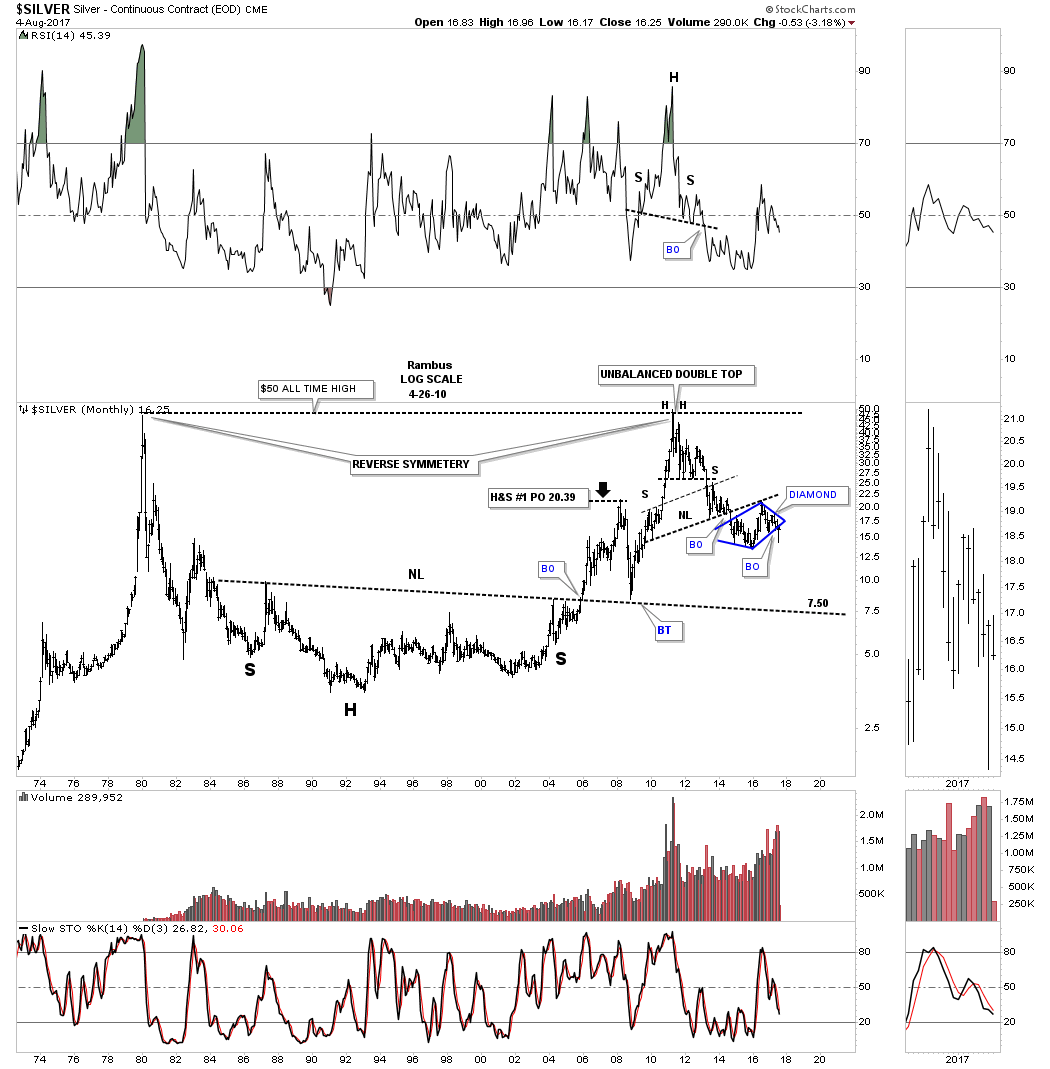
This last chart for silver is a 45 year monthly look we’ve been following for years which shows its massive 20 year H&S bottom which led to the rally that ended in April of 2011. This long term chart also came in handy during the bull market years by showing the breakout above the neckline in late 2005 and the backtest in 2008 when everything was crashing. Some may view the long tail on last month’s bar as a reversal, but until the price action can takeout the apex of the blue diamond the benefit of a doubt goes to the bears for now.
This chart below is actually one of the very first charts I ever posted in public back in the old days when Gold Eagle was the place to be. Man have times changed.
Before we look at a combo chart for the HUI I would like to go back to 2011 when the PM complex was topping out. One of the things that struck me back then was how PM complex topped out which for me was frustrating holding precious metals stocks.
After the crash in 2008 the PM complex had a very big rally into the 2011 top. I can still remember silver going vertical to its 1980 high at 50. What was frustrating was the PM stocks had a mediocre rally as silver basically wen parabolic. I’ve seen this type of behavior during the bull market years where gold and silver would rally and the PM stocks would hardly budge. This also happened the other way as well when gold and silver would hardly move and the PM stocks would have a very strong rally.
I thought at the time that when gold made its move the PM stocks would respond and blast off in a near parabolic fashion like silver. After a small correction in the summer of 2011 it was gold’s turn to rally into its parabolic top which ended in September of 2011 a full 6 months later than silver. Even though the HUI made its all-time high along with gold the rally was pitiful compared to what silver and gold did. That was one of the most frustrating times for me being invested in the PM stocks.
That brings us up to our current situation with the PM complex. As you well know the US dollar has collapsed in a near parabolic move down to the bottom of its 2 1/2 year side ways trading range. What has the PM complex done over that same period of time? Even though I haven’t be long the PM complex since the January 2016 low, if I was long I would have the same feeling I had back in 2011 when gold and silver went nearly parabolic with the PM complex not responding in a likely fashion.
Maybe it will be different this time which we will only know in hindsight. If you’re feeling frustrated as a PM stock investor take note of why you’re feeling this way so when things finally resolve one way or the other you can look back at this period of time to know if your feelings today are right or wrong.
Below is an old combo chart I built out during the 2011 highs in the PM complex. Note how slv, on the bottom chart, topped out a full 6 months ahead of gld and the HUI. Also you can see how gld had a strong rally into its 2011 top while the HUI barley made a higher high above its shoulder when it put in its head. Back then I was showing these three building out a double H&S top.
It’s hard to feel the pain when one looks at a chart, but I can assure you that for me there was some serious pain when SLV topped out without the PM stocks hardly participating with even more pain after gold topped and the PM stocks hardly moving higher. Is there a lesson to be learned from the 2011 experience? As always we’ll know in the fullness of time. All the best…Rambus
********
 Meet Rambus, a seasoned trader and technical analyst renowned for his unbiased and insightful chart work. Through his website, Rambus Chartology, and Substack newsletter, Rambus shares his expertise with a global community of subscribers, providing daily updates, commentaries, and hands-on training in the art and science of chartology. With his calm, humble, and down-to-earth approach, Rambus demystifies complex market trends, helping his followers navigate the challenges of today's volatile markets. Join the Rambus Chartology community today and discover a unique blend of technical analysis, trading expertise, and time-tested protocols. Subscribe now at www.rambus1.com or https://rambuschartology.substack.com/


