Bear Market Bottom: Mr. Bear Has Left The Gold And Silver Sectors For Greener Pastures
 share
share
 share
share
 share
share
 share
share
 share
share
 It appears the great gold bear of 2011-2016 has now ended. Mr Bear has now completed his work of cleaning up all the garbage and malinvestment created by reckless management teams over the past 15 years. Our sought after ultra low of HUI 66 where we were all going to ring the bell and back up the truck is not going to happen in my opinion. The bottom is in! This is my first and only call of a bear market bottom since the bear started in 2011. It’s been brutal, but I believe it’s over. This is my best judgment based on the pieces of the puzzle I see.
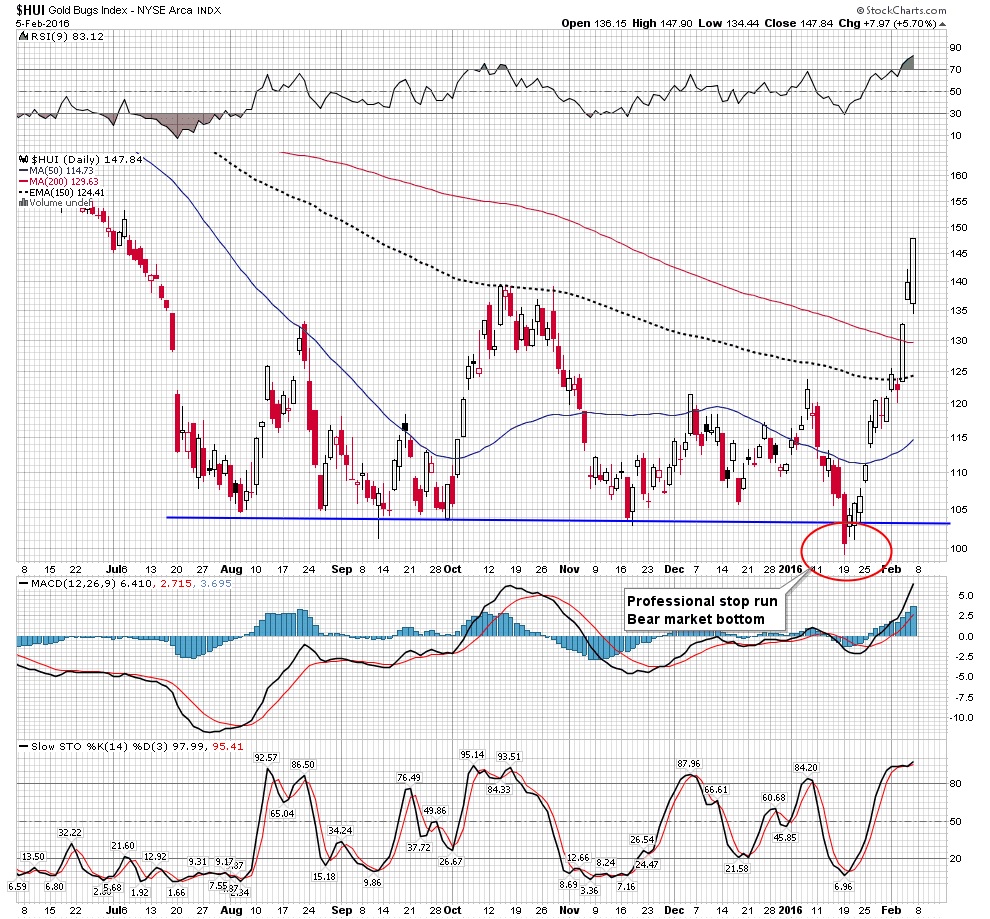
We witnessed under our noses a double bottom occur while the deceptiveness of the market had us looking for yet another perfectly formed H&S pattern set to breakdown and lead to a final devastating full blown capitulation bottom. Instead what we saw was a professional stop run creating a head fake for the retail investor (all of us) which put in the final bottom final bottom
I previously posted the bull genesis charts of 1982 and how thats what this feels like and Rambus has shown the price action indicating but not yet confirming a bull has started and now I would like to add another insightful piece of evidence which is rather compelling that the necessary conditions to the end of the bear have now exhibited themselves.
The Step Sum- The Bulls Capitulation
My friend Mark Lundeen puts out uniquely original work. It is the product of a life time of market study. He has been a life time reader of Barrons and when he was in the Navy back in the late 1970’s as his ship would go to port in exotic locals such as Bangkok his Navy buddies would go ashore and do what navy sailors do. He instead would stay on the ship and catch up on his Barrons. So we are benefiting from a 40 year commitment to studying markets.
As we have covered before the step sum is a measure of the sentiment of market participants. For years now we have waited for this sentiment to finally collapse. The below charts show that we in fact have finally gotten this collapse and fulfilled the condition of a market bottom. In the below chart note how the step sum finally went into free fall from August 15 through November 27th.
The star indicates the beginning of a 23 month decline where sentiment began to align itself with the price decline. This was the beginning of the loss of the dream of the gold bugs. Sentiment no longer opposed the price trend. On August 15 2015 this rush to the exits began to accelerate then on October 14th 2015 the bulls finally began to panic in climatic fashion. They finally gave it up in a final capitulation as measured by the step sum. It can be seen in the chart.
The next chart further demonstrates how severe this climatic sentiment change was. Mark’s 15 count chart uses a filter to block out any continuous up or down sequence of less than 9 days in a row thus showing all runs of up or down days exceeding 10 or more days. This chart is striking as it shows only 6 down day sequences of 10 or more in the past 45 years and the one we just experienced was the longest ever at 13 days in a row.
Below we can see Silvers was even worse scoring at 15 of 15 days down in a row and being the worse of only 3 occurrences in the past 45 years. Powerful meaningful stuff here.
Now I have mentioned before how some of the bottoming actions to look for in a capitulation were comical selling and full loss of liquidity for 3-5 days. We never got that in this bear market. Frankly I am disappointed, but the above data registers as a capitulation of sentiment, maybe that’s as much as we are going to get.
So here we are at a possible bottom. How undervalued is this sector? Answer: its incredibly undervalued. Just take a look at the BGMI/ounce of gold measure. Its the cheapest its been since the early 1920’s
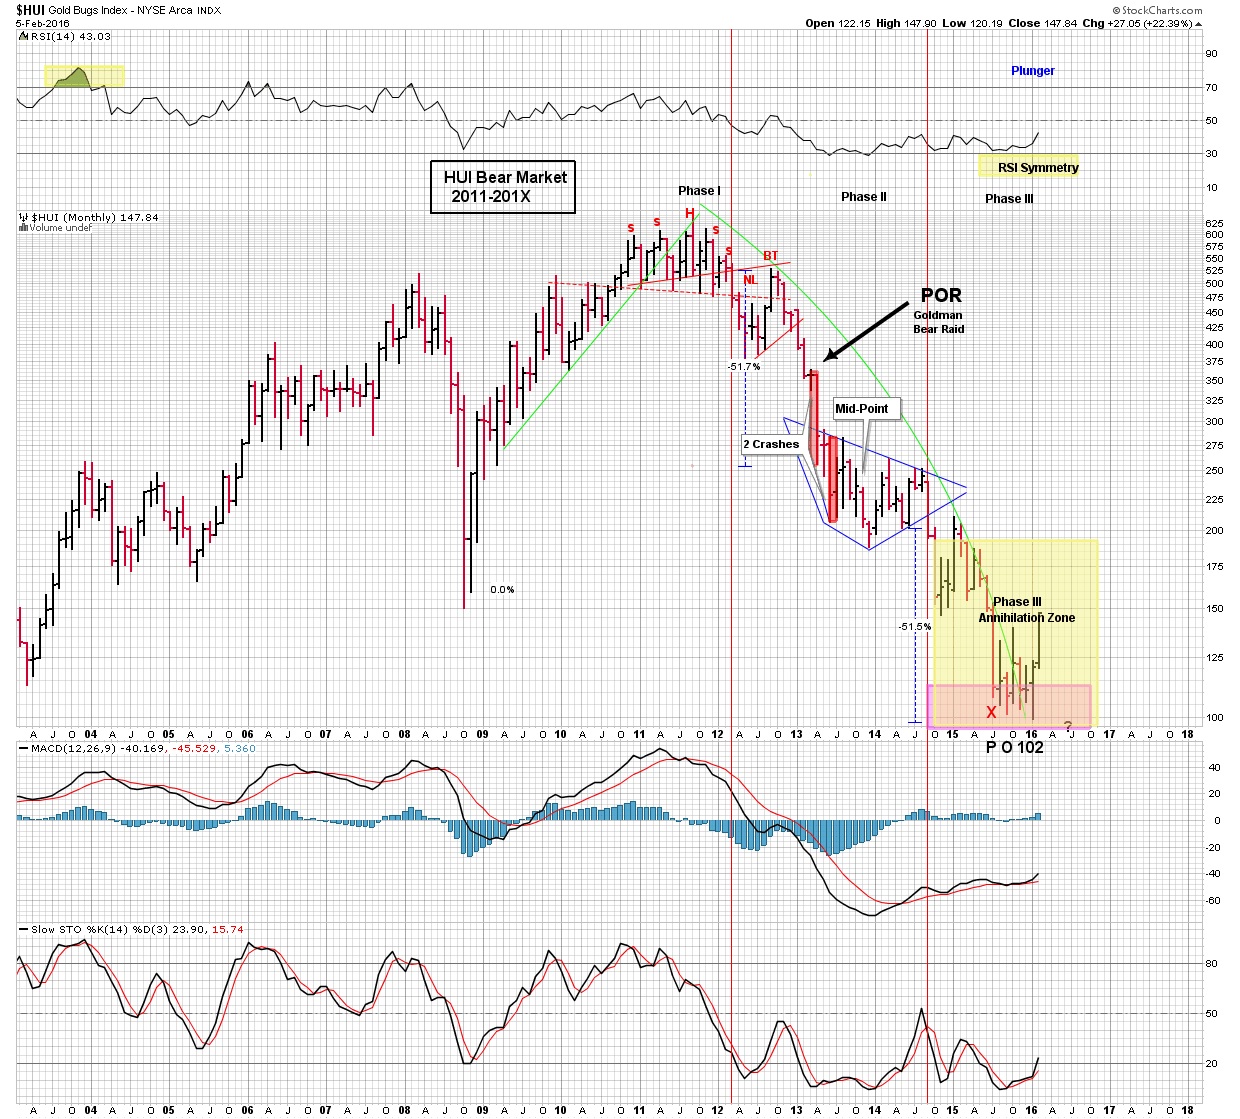
So here is yet another brick in the wall, as Rambus would say pointing towards the end of the bear. My suspicion is we could rally up to HUI 190/200 and work that range over the next 6 months before advancing higher, but quit thinking we are going lower than the January 19th lows. As it turns out my original price objective, seen below & unchanged, of the HUI at 103 made 2.5 years ago nailed it in both time and duration.
If I just hadn’t gotten diverted into a PO of 66 once the price arrived at 100 I could claim bragging rights. But now we look ahead at the upcoming bull market in the PM shares. We can now shift our focus on bull market analysis. Coming soon the 3 psychological phases of a BULL market
********
An Associate writer for RAMBUS
share
share
share
share
share