Beware Of The Deadly GOLD Fever


 With the gold fever that took place on Thursday I thought I’d post my two cents worth as to what it all means, or doesn’t mean. I was initially going to do my normal long, intermediate and short term technical summary of the gold action but after looking and examining the chart I thought differently. There was just too much confusion in the indicators to establish what is happening. If I was a confirmed bull I could find many indicators that confirmed my bullishness. If I was a confirmed bear I could find many indicators to confirm my bearishness. So I thought to just look at the very long term view and make only a few brief comments on gold. More comments on the actions of stocks, however, will follow as usual.
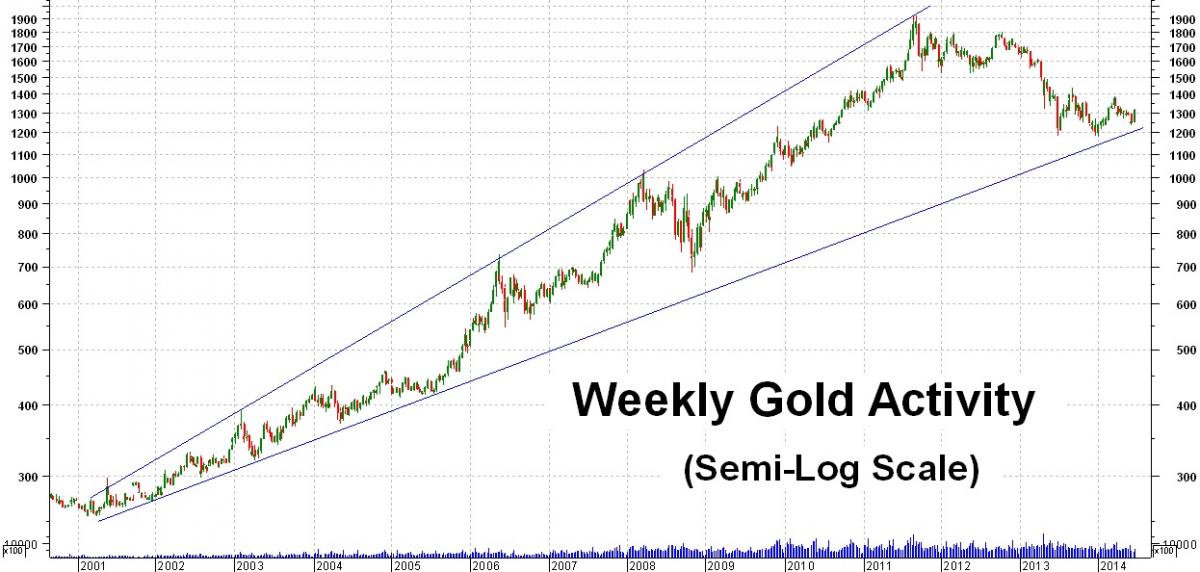
What we have here is a chart of the weekly price activity of gold (in semi-log scale) dating back to the beginning of the modern gold bull market. Just looking at this chart we can make a few brief comments from both the bull and bear side.
From the bull side: The action has been trapped within an expanding megaphone pattern going back to its beginning. We are once more sitting almost on top of the lower, support, trend line. If the megaphone is to continue we should see a new bull move from these levels that will eventually take us back to the upper, resistance, trend line. That would be somewhere in the stratosphere region. Lots and lots of room to move upwards.
From the bear side: Up trending megaphone patterns have a nasty habit of breaking on the down side. Should this be the case we are very close to that occurrence. A move below $1200 would do it. A serious bear market could then continue until at least the $700 level where there is strong support from previous action.
The market action over the past year has given us upper and lower boundary levels to pay attention to. These are around the $1400 level on the upper side and around the $1200 level on the lower side. As long as gold price remains within these boundaries we cannot say with any technical certainty which way it will go. Jesse Livermore, the greatest securities trader/speculator from 100 years ago would caution any speculating inside the boundary and would wait for the upper or lower levels to be broken BEFORE acting.
Just on a personal note the action on Thursday looked more like a one day, knee-jerk reaction to external world events that may or may not mean anything, long term wise.
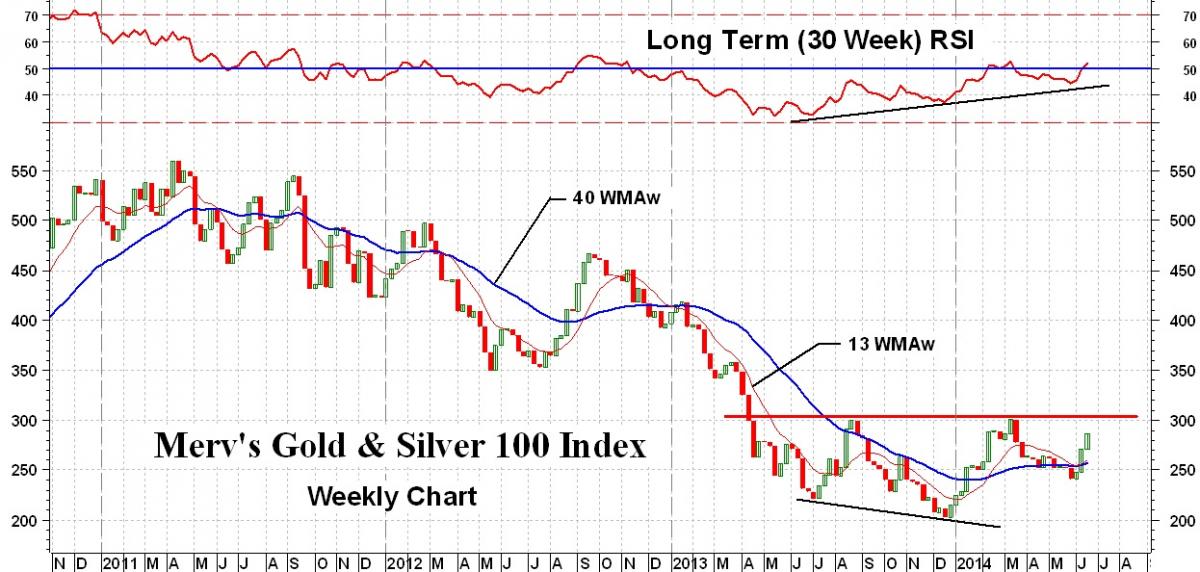
Merv’s Gold & Silver 100 Index
Summer has just arrived so I’m getting lazier than normal. I’ll just go through some quick facts and get to the meat of the analysis.
From the long, intermediate and short term standpoint the 100 largest gold stocks trading on the North American markets appear to be in bull trends, at the Friday close. However, there are two cautionary indicators one should watch from the long term indicators. The momentum indicator, although just nudging into the positive zone, has a habit of moving just over the neutral line and then reversing back below the line into the negative zone. The Index price action itself has moved sideways over the past year and has developed a potential reverse head and shoulder pattern. It would only be a real pattern once it breaks above its neckline at the 300 level. For now, despite the positive moving averages, I would be inclined to wait for an upside break before getting too enthusiastic about the gold stocks, at this point.
Looking at my table of technical information I see where 70% of the stocks are in bull trends with only 20% in bear trends, from the long term perspective. From the intermediate term perspective, 82% are in bull trends and 9.5% are in bear trends. Short term 91% are in bull trends and 4% are in bear trends. So, if you are inclined to jump in you can just close your eyes and throw a dart at a list of stocks and your chances of hitting a winner are very good.
Merv’s Penny Arcade 50 Index
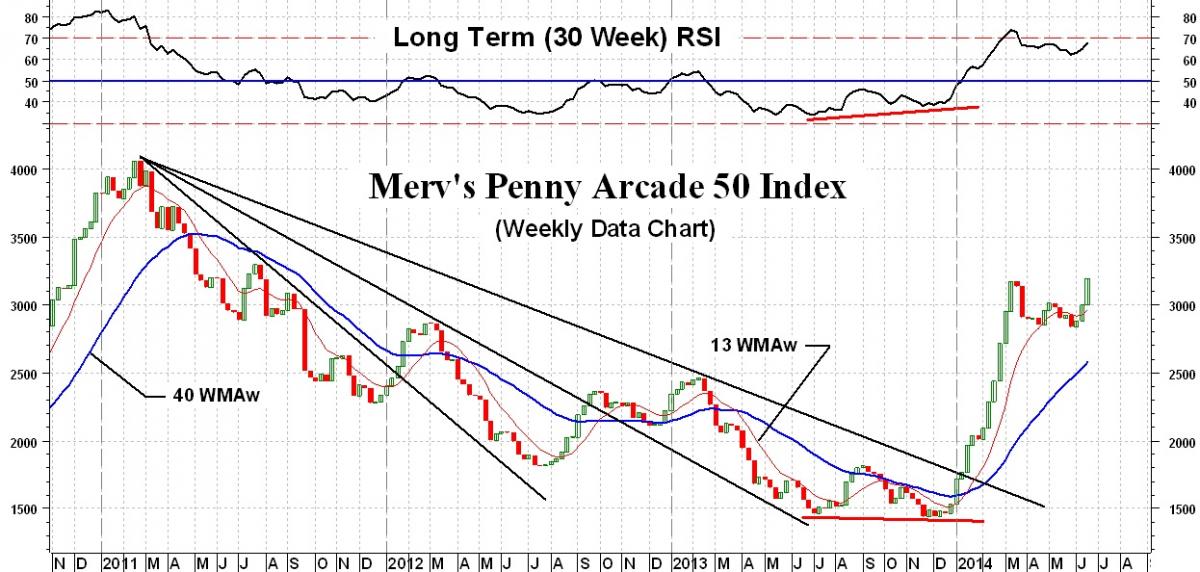
Speculation (or gambling) in the “pennies” continues. Although the Merv’s Gold and Silver 100 Index is still below its recent highs, as are all other gold Indices, the speculative Merv’s Penny Arcade 50 Index is hitting new bull market highs and is now 122% above its recent low set in late 2013. We have had strong bullish signals very early in the trend with the positive divergence in the momentum indicator and the breaking of the third Merv’s Fan Principle trend line. Right now all three time periods are bullish although some signs of caution are present. As we can see the long term momentum indicated a caution right at the top in March and is once more heading in that vicinity.
Looking at my table of technical indicators the 50 “pennies” are in good shape. From the long term 50% are in bullish trends while 36 are still in bear trends. For the intermediate term 61% are bullish and 27% bearish while on the short term 74% are bullish and 16% bearish. As you might assume, some of these “pennies” have already moved 200% or more while others have moved lower. Here, the bull/bear ratios are somewhat less bullish than for the top 100 stocks so if you are inclined to speculate on the pennies you may need two darts.
I’ve often been asked what software and data I use for my charts. I use Metastock software (although I haven’t upgraded the software for many years so it is an older version) and the data comes from Reuters.
I read all the emails but may not always respond, time factor and all that. The email address is [email protected].
 Merv is a retired Aerospace Engineering consultant. He is also a retired market technician with over 40 years of market experience and research. Merv received his certification as a Chartered Market Technician (CMT) in 1992. Developer of many technical techniques and programs which he has been using in his previous Technically Speaking with Wil-Arm and Technically Precious with Merv commentaries posted throughout the globe. Developer of several gold and silver Indices, Merv continues to update his Merv’s Gold & Silver 100 Index and Merv’s Penny Arcade 50 Index and reviews them during his periodic on-going Technically Precious commentaries.
More from Gold-Eagle


