Big Bubble, No Trouble


Introduction
The housing sector has been on fire, and many of my subscribers and readers want my opinion on the sector, because lately, the media have been piling on into the bear camp, forecasting a major collapse in the housing industry, and along with it, stocks within the sector. When the public sentiment is so overwhelmingly bearish amid such positive technical backdrop, it brings the contrarian out of me. Although I do not cover the housing sector in my service, I can easily apply my trading model to the sector, in fact, any sector.
Big Bubble
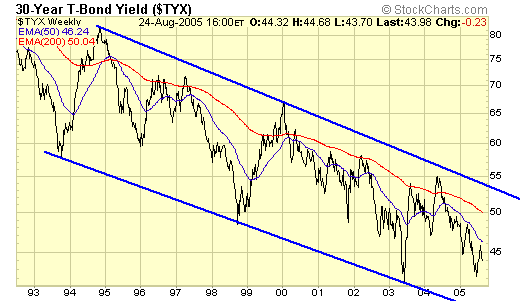
Many experts are calling this the biggest bubble of them all: the credit bubble. Again, I'm not smart enough to offer any opinion on why this and why that, but as far as I'm concerned, long term rates have been in a major down cycle since the early eighties, and as long as the major trend continues, long term rates will remain at generational lows and the housing market is just one of many beneficial recipients. I have used this same chart to suggest to my loyal readers these past few years that, until the major trend in long term rates changes, keep their mortgages on short term variable, and many are very happy about that. Now, lets take a look at some better known housing stocks within the same period…
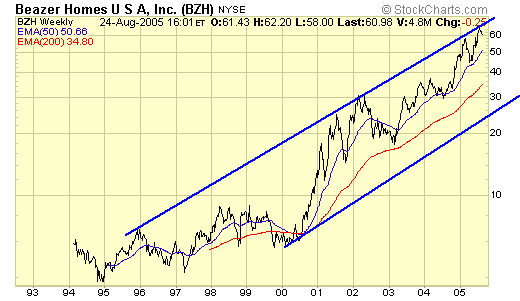
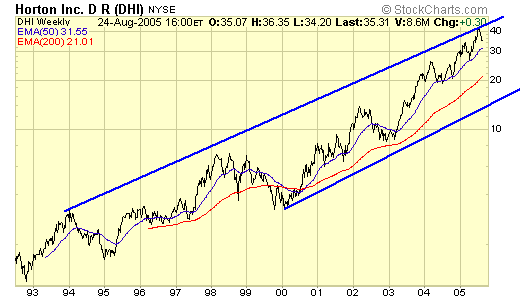
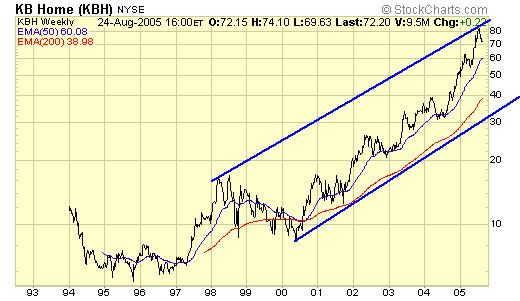
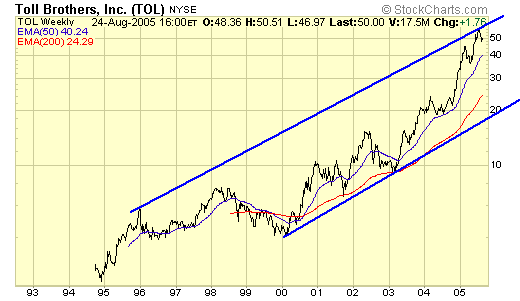
Plain and simple, isn't it? Long term rates in a major downtrend, and housing stocks in a major uptrend. When will it end? Why guess? Ride it as long as you can, and take some profits in between. Using my trading model, my current suggestion is:
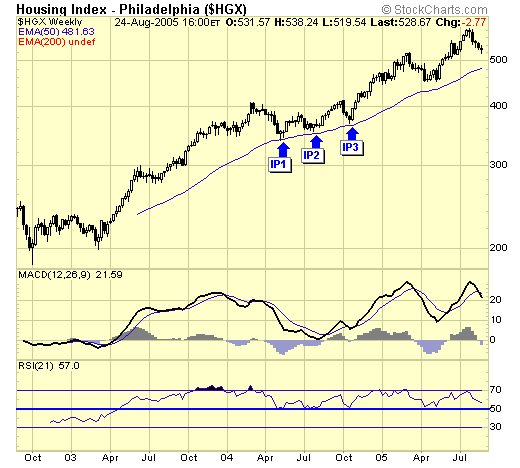
For the longer term traders or investors, $HGX is on an IP (impulsive phase) according to our model, and stocks within this sector during an IP is "buy and hold", until a CP is confirmed, meaning a weekly close below the 50ema.
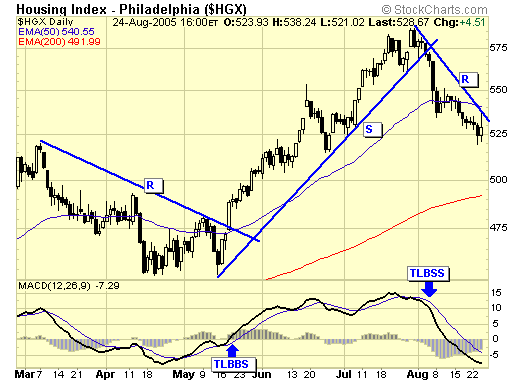
Short term traders are currently on a sell signal (TLBSS) since early August, therefore profits should have been taken and now waiting for the next buy signal which could be either a TLBBS (trendline break buy signal) or BSBS (bullish support buy signal).
Summary
The market place is very efficient, where buyers are matched up with sellers. The real purpose of technical analysis, is to aid us in determining which side we should be on, by simply following the markets, and not getting ahead of it by predicting and forecasting. By following the signals generated by my trading models, investors should be holding their housing stocks and traders should be on the sideline, and if you are like me, being both an investor and a trader, then, you should hold ½ of your portfolio according to the weekly chart and trade the other ½ according to the daily chart. Keep it simple, and follow the markets.
Jack Chan at www.traderscorporation.com
27 August 2005

Jack Chan is the editor of Simply Profits, established in 2006. Chan bought his first mining stock, Hoko Exploration, in 1979, and has been active in the markets for the past 37 years. Technical analysis has helped him filter out the noise and focus on the when, and leave the why to the fundamental analysts. His proprietary trading models have enabled him to identify the NASDAQ top in 2000, the new gold bull market in 2001, the stock market top in 2007, and the US dollar bottom in 2011.


