The BIG Question for Today: Are We or Aren’t We?


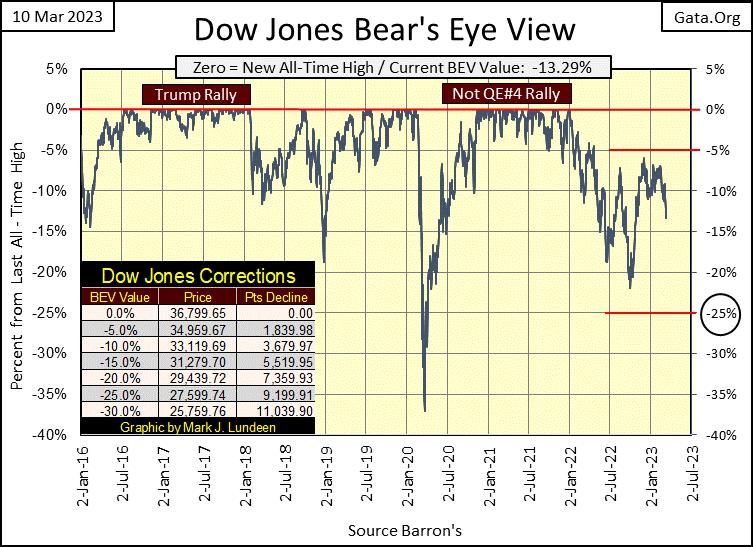
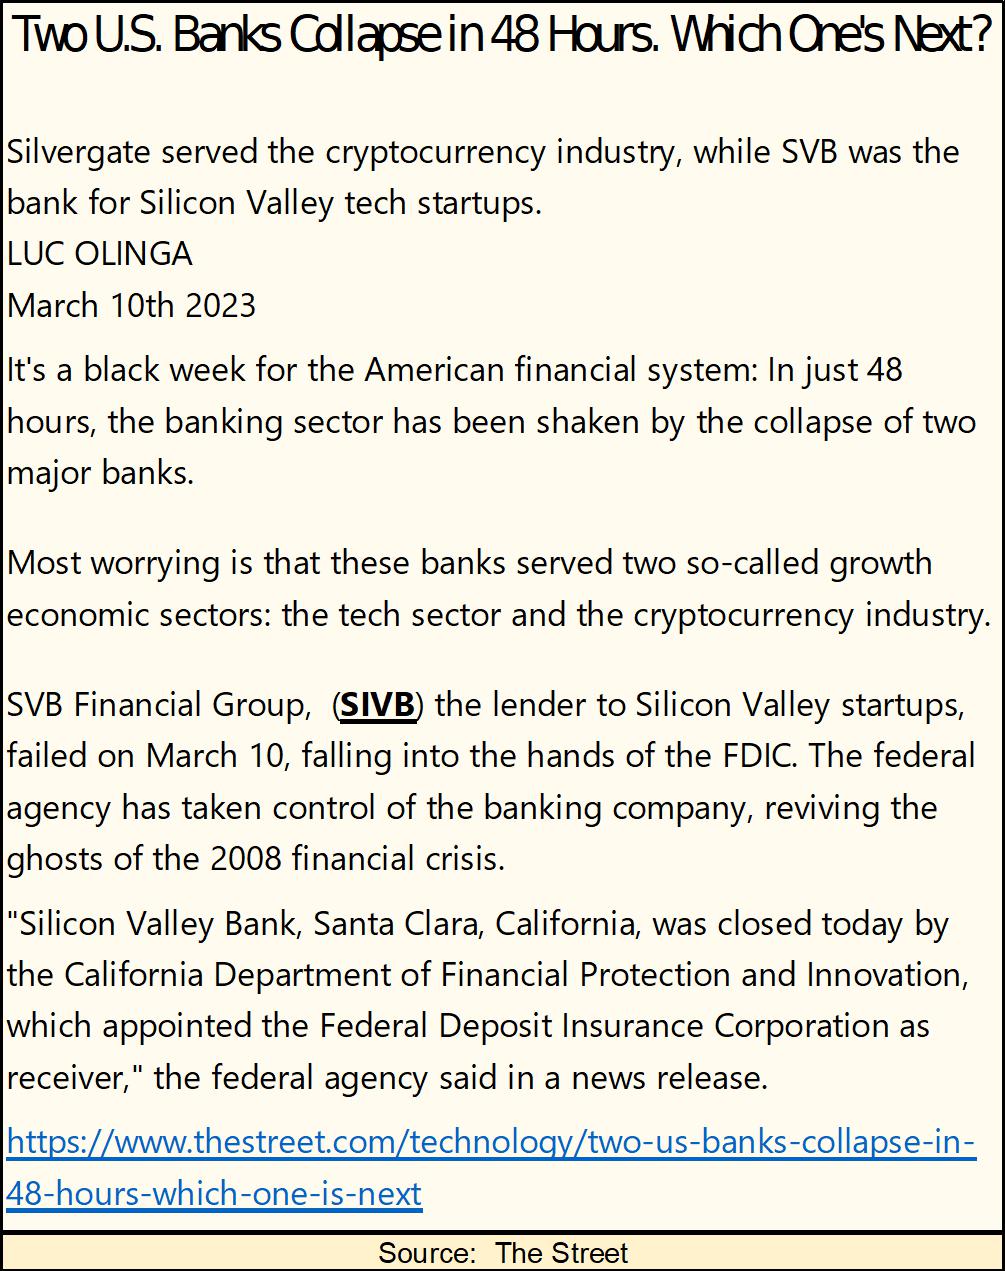
This was a big week for Mr Bear. Several banks in Silicon-Valley had “liquidity problems,” and were closed. Which I take as meaning; for the foreseeable future, in the BEV chart below we’re not going to be looking at the Dow Jones’ BEV -5% line, but its BEV -25% line for clues for what is to come next in the stock market.
Why not the Dow Jones’ BEV -20% line? Because I’m really bearish. Since the Dow Jones last all-time high (04 January 2022), we’ve been there and done that before. That’s why as a big bear, I’m looking at the BEV -25% line in the BEV chart below.
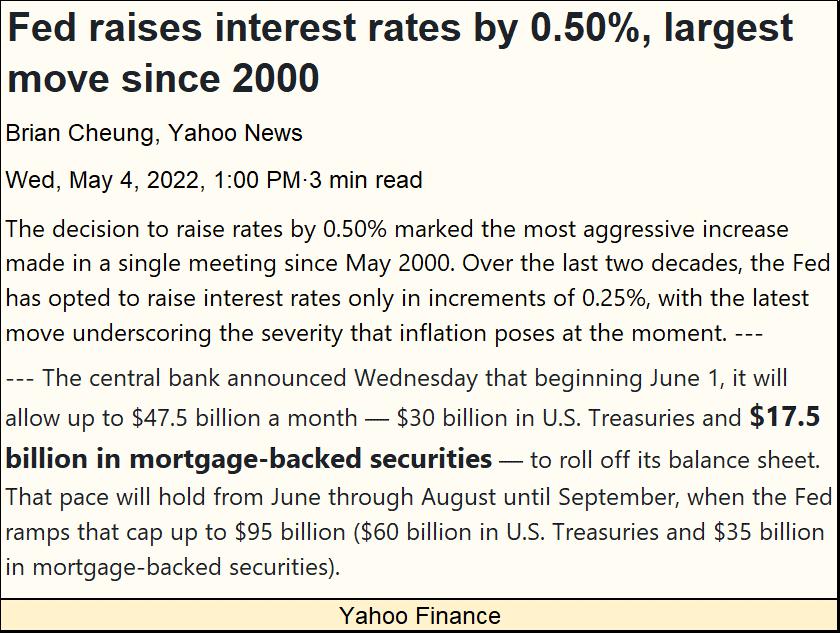
The Dow Jones (#3 table below) was one of the better performers for the week, down only 4.14% from Monday’s close. The NASDAQ Banks really got their monkey spanked this week, down 11.74% from Monday’s close on the following news.
From Monday to Friday’s close, on average these indexes below were down 4.61%. That is a significant, full spectrum market decline.
Not surprising, the XAU was the best performer for the week, down only 2.27%. That and seeing gold being a star performer late in the week, provides evidence that gold, silver and the mining shares are finally becoming counter-cyclical to the financial markets. We may soon discover that bad news for the financial markets, becomes good news for the precious metals, as it was on Friday for gold. If so, that is very good news for us gold bulls.
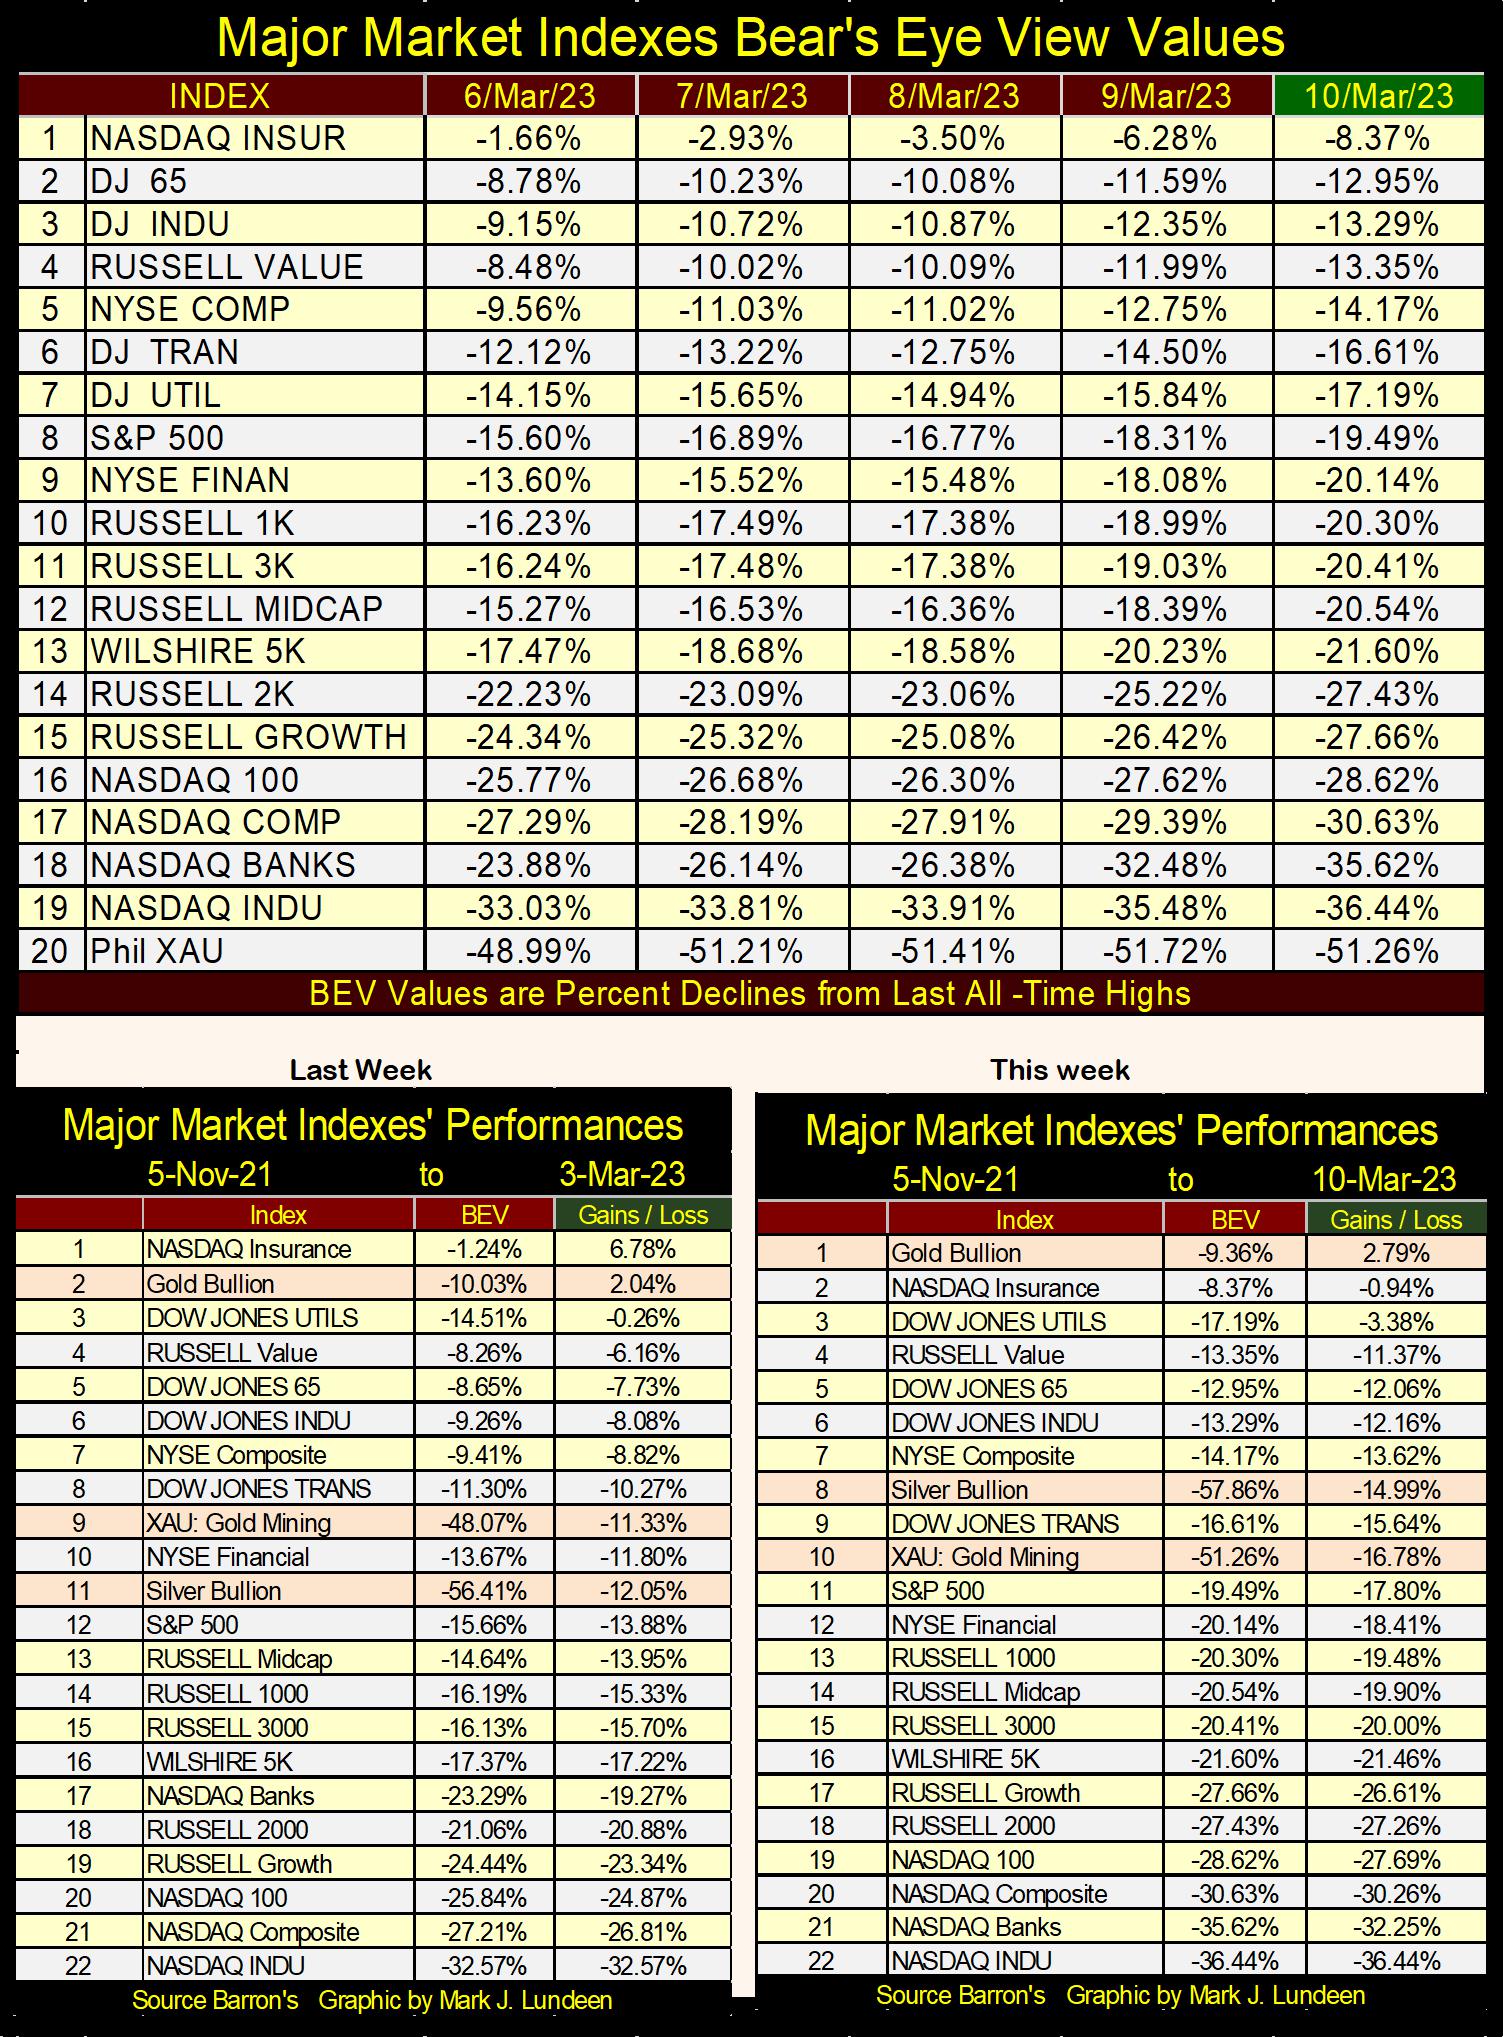
Looking at the performance tables above; gold is now #1 in the table; the only asset that closed the week at higher levels than it was at on 05 November 2021. What’s so special about 05 November 2021? That week closed with all the above indexes either at new all-time highs (15 of 20), or within 5% (in scoring position) of closing at a new all-time high (4 of 20). The XAU was 41.43% below its last all-time high.
In other words, for this data set, 05 November 2021 was a market top. This week’s performance table above shows how the mighty have fallen since then.
It didn’t take long before the NYSE began seeing its 52Wk Low dominate its 52Wk Highs; about five NYSE trading sessions (March 3rd to March 10th), in the NYSE 52Wk H-L Nets table below. It seems a lot of people have their eyes on the Exit Sign at the NYSE, if not headed towards the door just yet.
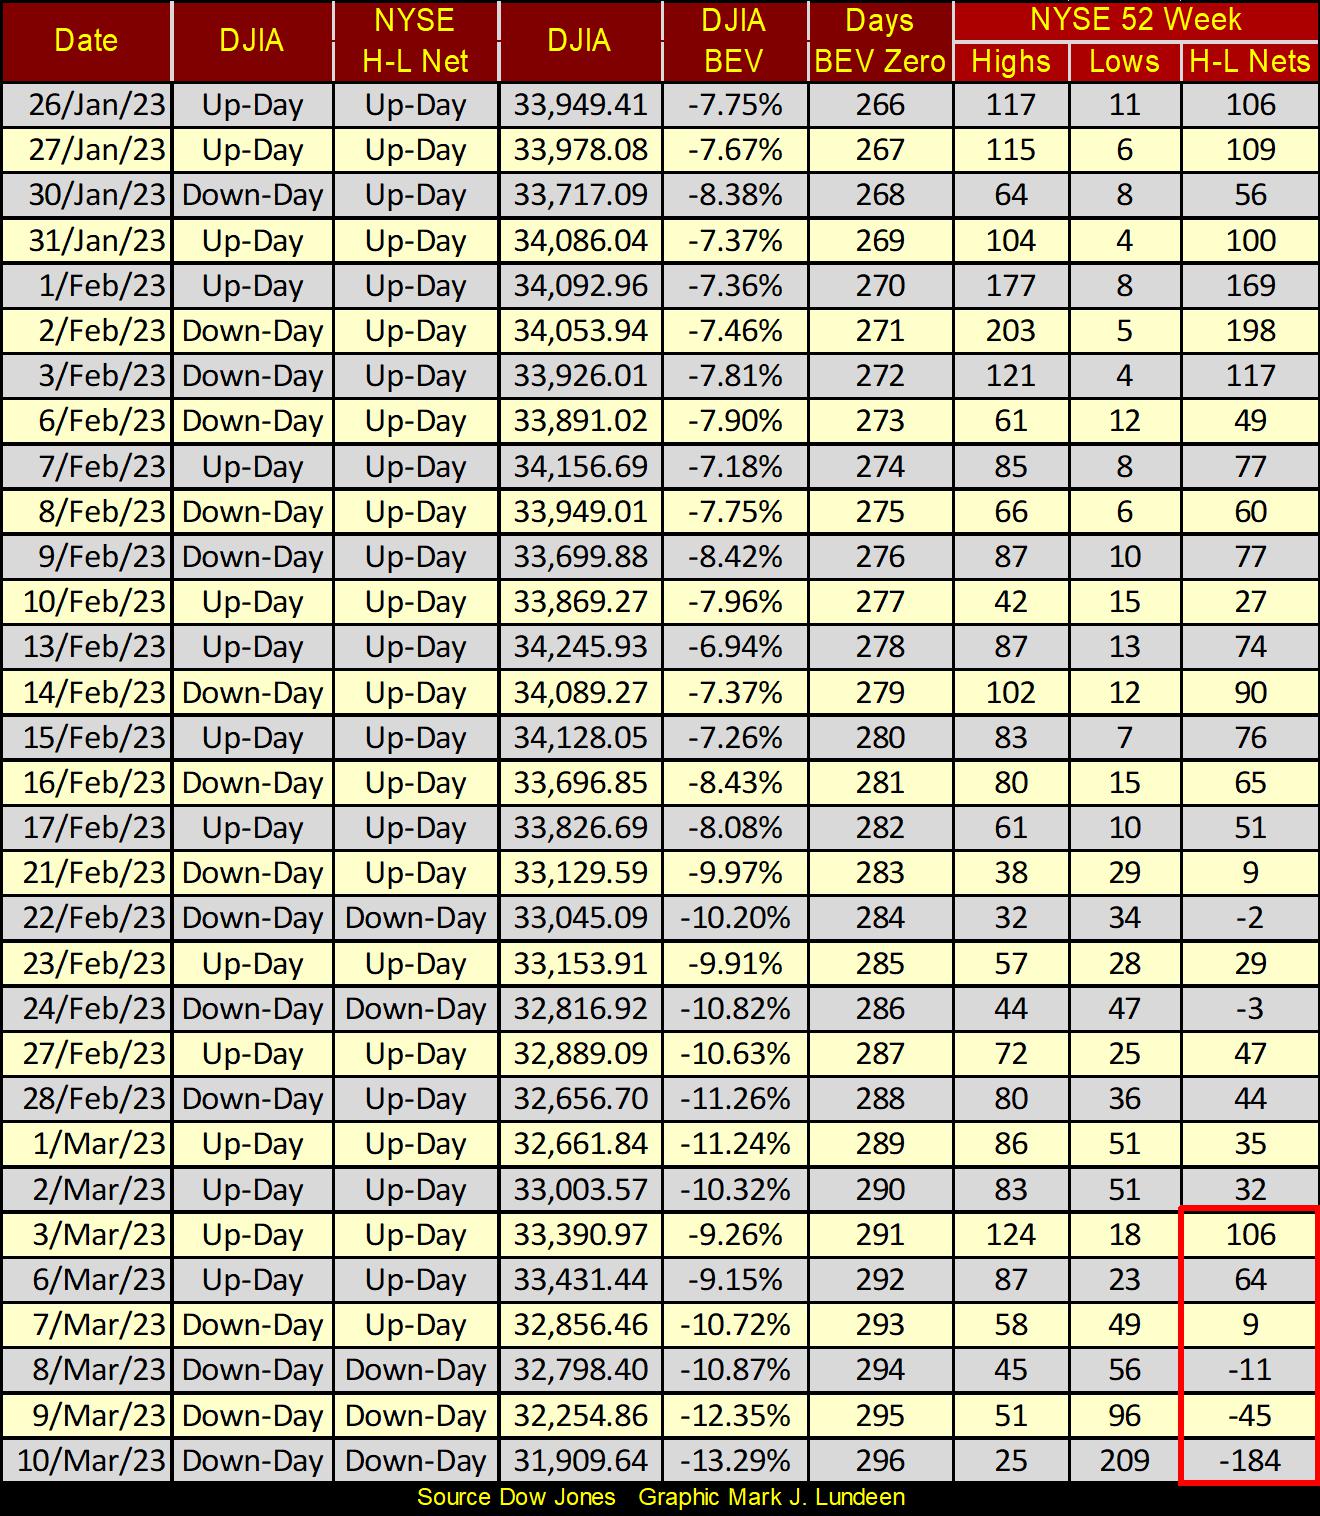
Mr Bear continues being a problem. In his report card below, this week on Thursday we see another NYSE 70% A-D day; a day of extreme market breadth. Then on Friday, though not technically a 70% A-D day, at -69.26% it was damn close to being one. I made a point to list it in the table below, as it was only a handful of daily declines short of being one.
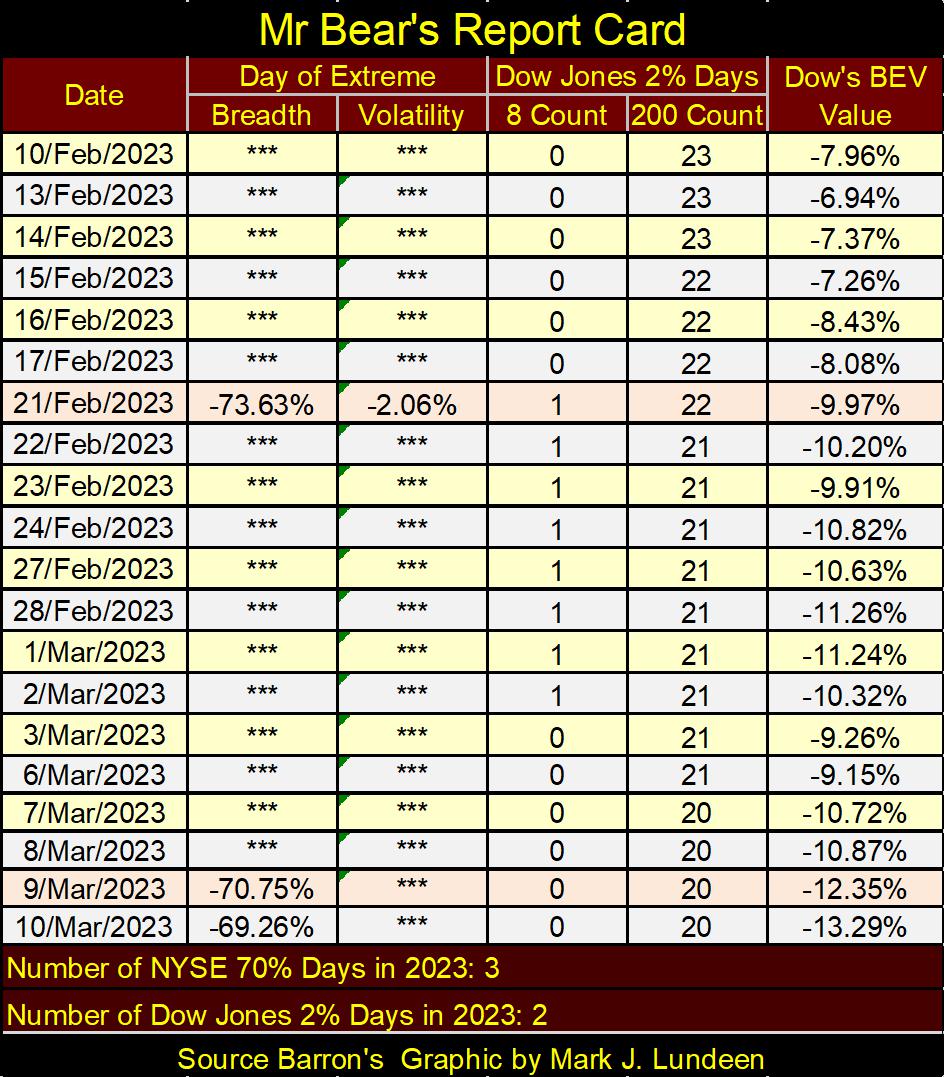
If the stock market continues on its current track – downward, we can be sure of ever more NYSE 70% A-D days and Dow Jones 2% days in Mr Bear’s report card in the weeks and months to come. Keep in mind, during big bear markets, we’ll see lots of positive days, big days of extreme market breadth and daily volatility.
We can count on the mainstream financial media to cheer every time the Dow Jones is up for a day by 2%, or more, or when daily advances at the NYSE overwhelm daily declines. Don’t fall for it; such overwhelming daily advances in price volatility and market breadth are bear market events.
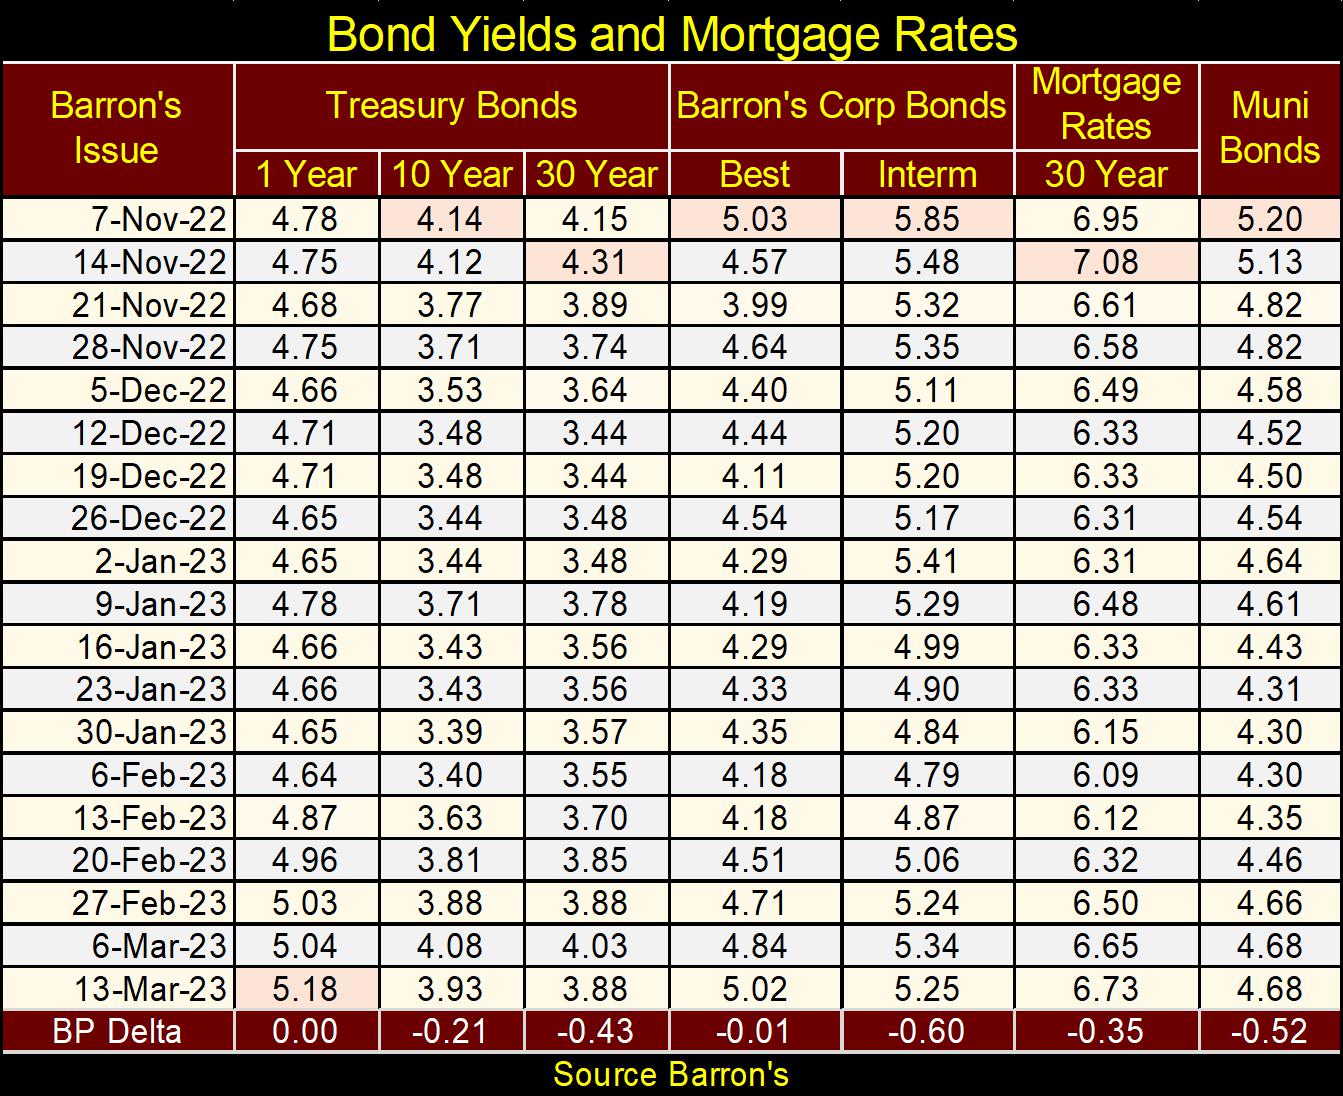
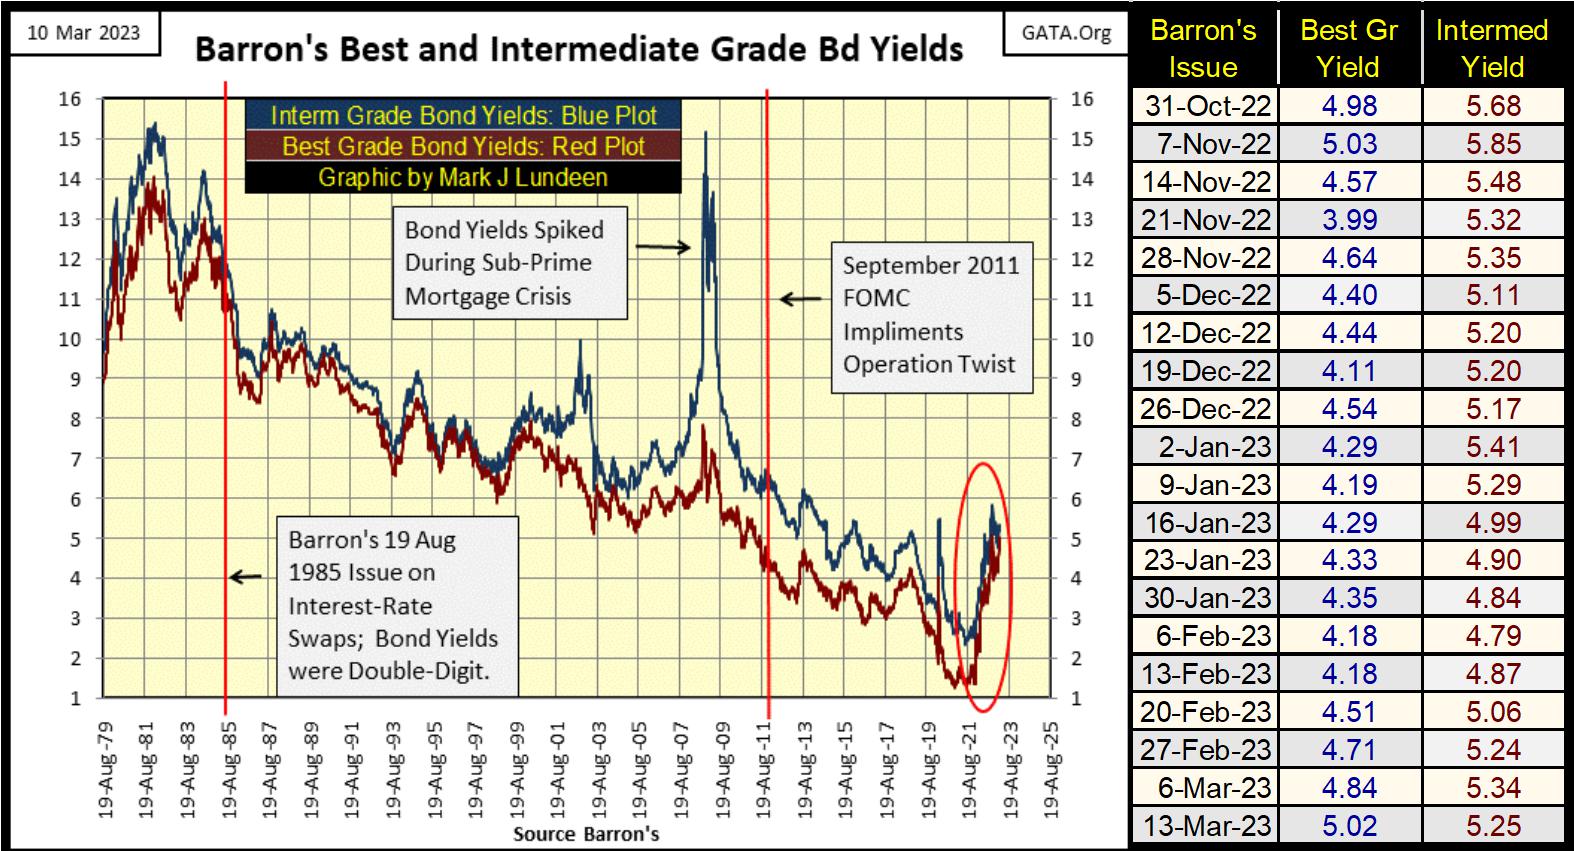
Of the bond yields I follow, some were up for the week, as was the rate for a 30Yr Mortgage. As a long-term market observer, past market crises used to be big positives for the T-bond market, as flight capital would as a matter of reflex flow towards the “safety of US Treasury Debt.”
Although the yields for the 10Yr & 30Yr T-bond fell this week (prices advanced), I don’t believe flight capital flowed this week towards the T-bond market on news of the failure of two of Silicon-Valley’s banks. In the past it would have. But this week, flight capital instead flowed towards gold, which saw its price advance by 2.03% on Friday’s news of the bank failures, while nothing else did.
The problem the T-bond market has, since its top in August 2020, prices for T-bonds have come down significantly, as seen in the blue plot below. Long ago in 2020, when depositors at banks banked their funds, banks (maybe the two that failed this week in Silicon Valley) would use these deposits to purchase T-debt as reserves for the bank.
The entire Federal Reserve Banking System favors the use of T-debt for its banks’ reserves. The politicians in Washington expect nothing less than its banking system to have full faith in the credit of the big spenders at the Federal Government.
Now in March 2023, that has now become a problem. Should depositors withdraw their funds today, the banks can now sell their reserves of T-bonds for only a fraction of what they paid for them with their depositor’s funds from a few years back.
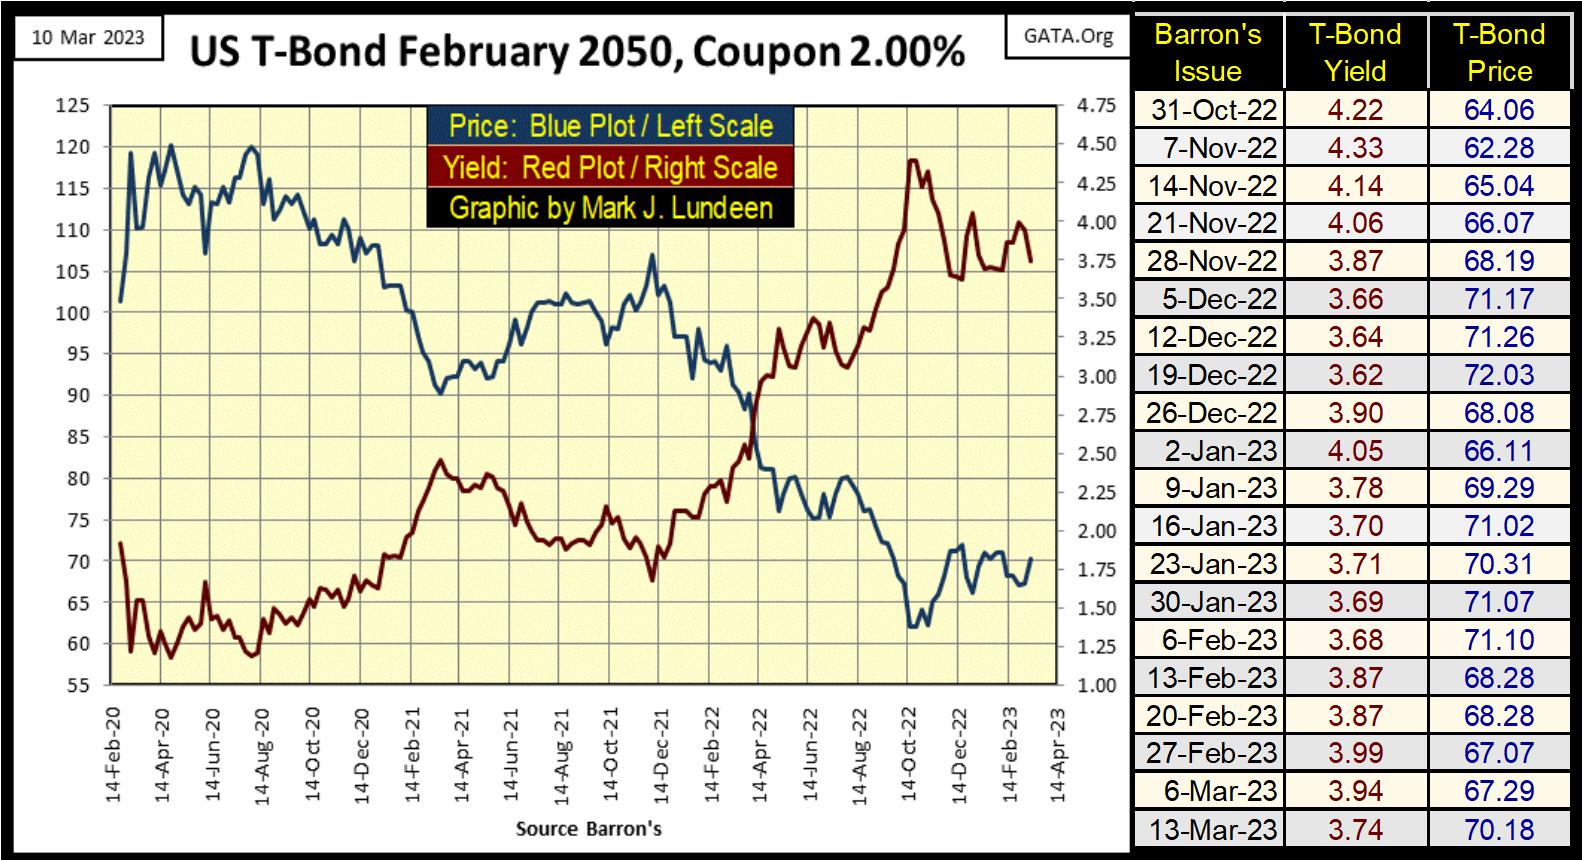
The entire US banking system could now be in the early stages of a “liquidity crisis,” simply because bond yields (Red Plot above) have increased since August 2020.
In August 2020, the banking system had no concerns of bank failures, but now in March 2023 we do? Rising T-bond yields has to be part, a BIG part of the problem the banks now have, as the market valuation of their reserves of T-debt have been greatly reduced.
The same is true for the insurance industry, which also uses T-debt for their reserves. Note the big drop in the NASDAQ Insurance Index in the BEV table above. Down by 6.71% for the week, and the NYSE Financial Index wasn’t far behind; down for the week by 6.54%.
If the market was in the early stages of another financial crisis, seeing these financial indexes outperform the market to the downside is what I’d expect to see.
Take a look at the two yield curves below;
August 2020 (Green Plot)
March 2023 (Red Plot)
The yield curve for March 2023 is also greatly inverted, which will eventually force the economy into a recession. In recessions, people and businesses draw upon their savings held in the banking system to tide them over the hard times. But a dollar deposited in a bank a few years ago, is now worth less than a dollar to the bank today, dollars the bank must now sell off some of their reserves to come up with to refund a deposit.
This is a huge problem, one with no short-term fix that I can see.
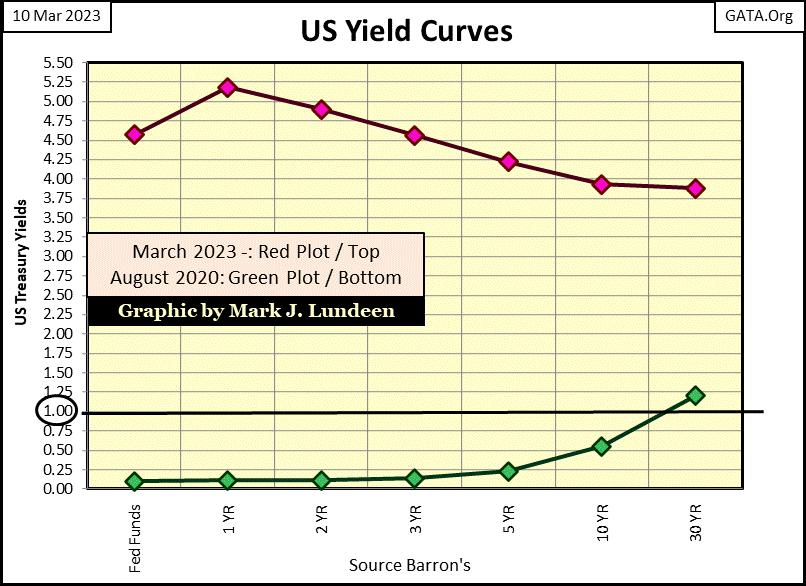
The current crisis in banking is also symptomatic of the overall nincompoopery in “monetary policy” the idiots at the FOMC have managed the economy and financial markets for the past few decades. For decades, since 1981, they’ve strove to drive bond yields down to ever lower values. Until in August 2020 (Green Pot above), one had to buy a 30Yr T-bond to obtain a yield in the T-bond market of something over 1%.
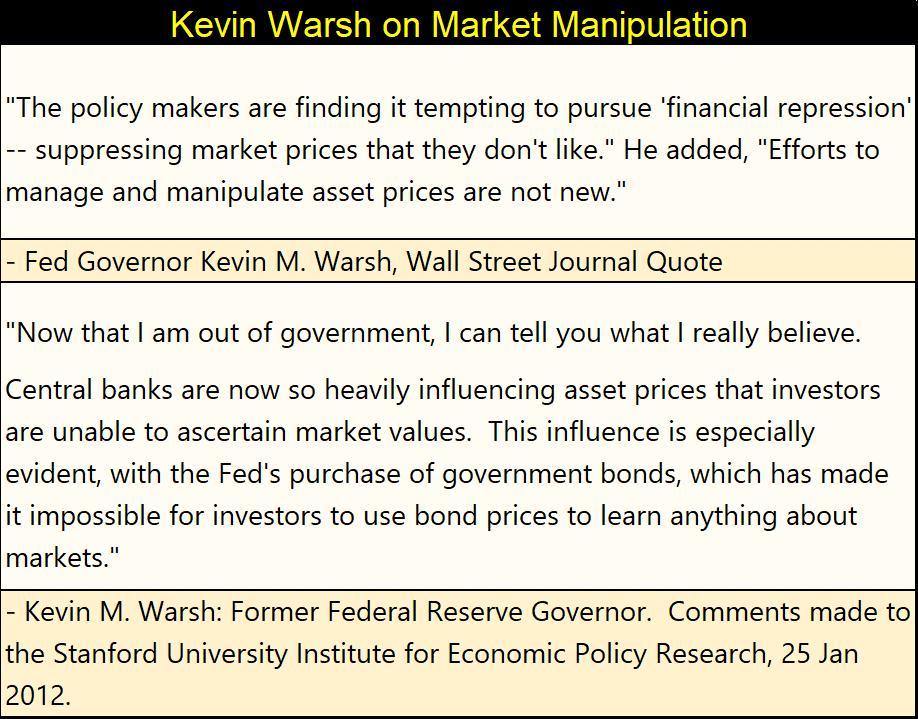
The idiots did the same in the corporate bond market; drive bond yields from double-digits, down to low single-digits, as seen below. Great wealth was created as bond yields fell, but the gains were all manifestations of the idiot’s “monetary policy.” But bond yields are now rising, and the inflationary gains of yesteryear are turning into today’s deflationary losses. Losses someone must take, like the depositors at those two Silicon-Valley banks.
Bond yields are now rising, and that is a big problem the idiots don’t have a solution for. Except maybe a QE #5, a few tens-of-trillions of newly created dollars-of-inflation to purchase bonds in the open market to drive bond yields back down, and bond prices back up.
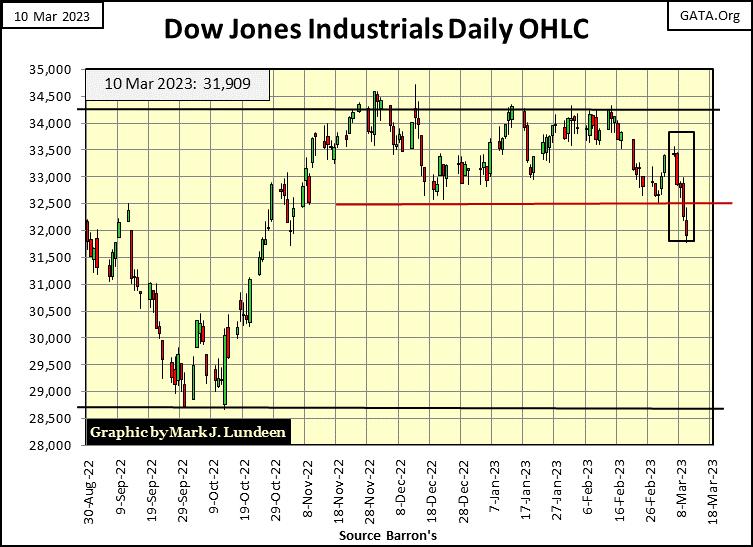
This week, the Dow Jones blasted through its line of support at 32,500, and closed below 32,000. The 32,500 line supported the Dow Jones since last November, but not anymore.
If the idiots at the FOMC can get a lid put over * THEIR * banking crisis, we may see a rebound in the Dow Jones next week. But any more bad news about a bank in the Federal Reserve System closing their doors next week – well look out below! The stock and bond markets remain grossly overvalued. It’s simply amazing how quickly Mr Bear can drive market valuations towards their fair-market values, and then far below them in bear markets.
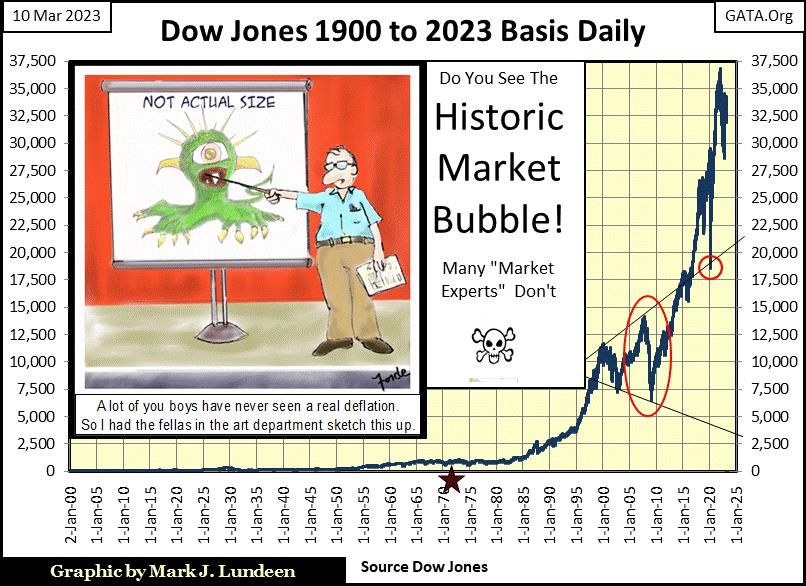
That’s when the smart money buys; when there’s blood in the streets. For the Dow Jones, that could be something below 5000, or so I would think.
Is 5000 on the Dow Jones possible? Looking at how much inflation was “injected” into the Dow Jones since August 1971 (Red Star below), when the US Government abandoned the Bretton Woods $35 gold peg. I think 5000 on the Dow Jones, or even below is very doable when the financial system undergoes Mr Bear’s regiment of deflation in financial asset valuations.
The big question that should be on everyone’s mind is; are we in a bear market? But how can someone know whether we are, or not? I’ve been saying we’re in a bear market for a long time. Since the idiot savants at the FOMC announced in the first half of 2022 they were going to implement a second QT – begin draining “liquidity” from the financial system they “injected” into with their Not QE #4. That plus they were going to raise interest rates, and have now inverted the yield curve.
These two new “monetary policy initiatives” by the idiots
begin a new QT,
begin raising interest rates,
guaranteed a market crash, and I said so at the time in early 2022.
They began raising interest rates in March 2022 with a 0.25% increase, and began their QT in May 2022. So, where is the market crash? Be patient; somethings take time.
Market crash or not, the case for a bear market is improving. Beginning last year, we’ve felt the magma beneath the market shift under our feet; with an increase in days of extreme market volatility (Dow Jones 2% days) and days of extreme market breadth (70% NYSE 52Wk H-L Nets). Since May of 2022, the NYSE has seen twelve 70% 52Wk H-L Net days, with three of them so far in 2023. That is a lot!
Since the Dow Jones’s last all-time high (04 January 2022), the Dow Jones has seen twenty-eight 2% days, with two of those happening in 2023. For over 100 years, an abundance of these extreme market events in breadth and daily volatility defined bear-market environments. As seen in Mr Bear’s Report Card above, they are happening again with our current market, and that is not good for the bulls.
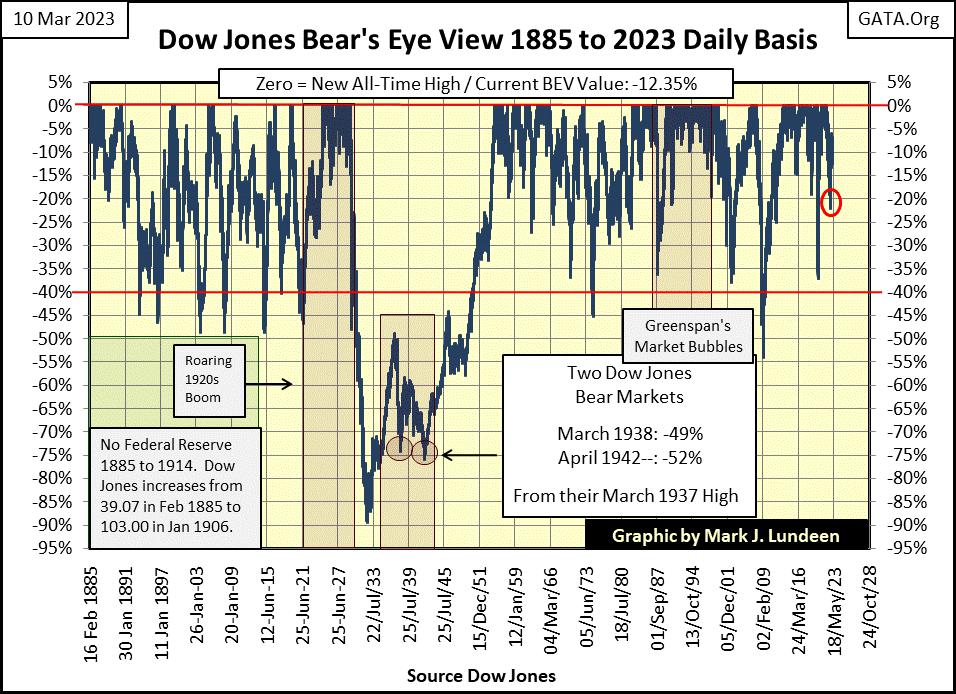
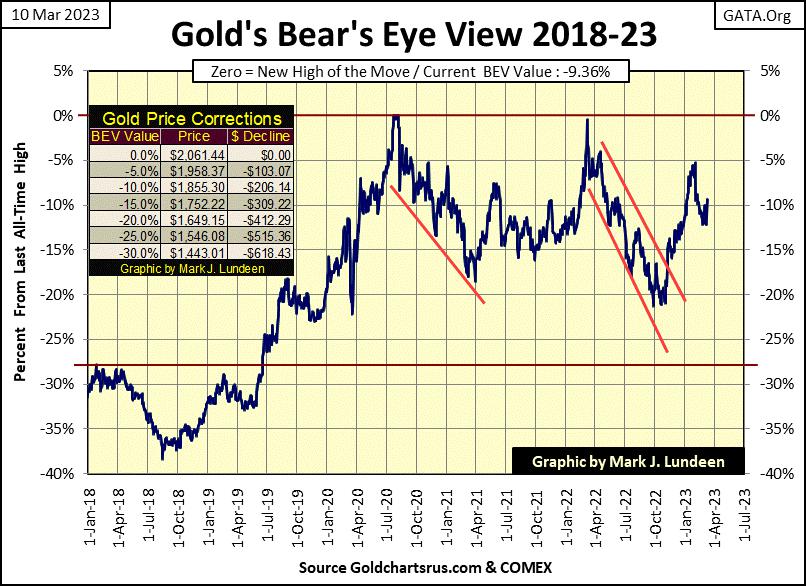
But Mark, you’ve talked about a market crash for a long time now. And for a long time now, we’ve seen no market crash. What’s up with that? Okay, let’s look at the history of market crashes with my Bear’s Eye View (BEV) of the Dow Jones going back to February 1885, a 138-year history of bull and bear markets in the Dow Jones.
In a BEV plot, new all-time highs register as 0.0% (aka BEV Zeros). During bull markets, clusters of 0.0% form, as well as many daily closings in scoring position (BEVs of less than -5%). Bear markets are seen by declines in the BEV plot to below the BEV -40% line.
Our current market decline (below) is highlighted by a Red Circle. So far, our peak market decline has been a BEV of only -21.34%, seen on September 30th of last year. If I’m correct, that we have a big market decline pending, before our current market decline has bottomed, we’ll see yet one more big bear market in the BEV chart below; one more market decline below the BEV -40% line. Exactly when I don’t have a clue; just that it will.
In the table below, I’ve noted nine of the major-bear markets the Dow Jones has seen since 1885 in the BEV chart above, but not every piercing of the BEV -40% line is included. When WWI began, the NYSE was shut down for several months. When it began trading again, the configuration of the Dow Jones was greatly changed – that 40% bear market is not in my list below.
There are a couple others who didn’t make the list for one reason or another. Before the Federal Reserve was legislated into reality by Congress in 1913, 40% market declines in the Dow Jones were common events. Of these I’ve chosen two; the big bear market of the 1890s, the other for the panic of 1907, the bear market historians claim motivated the creation of the Federal Reserve. Still, the list is good enough for what I’m doing with it – noting Dow Jones bear markets going back to the 19th century.
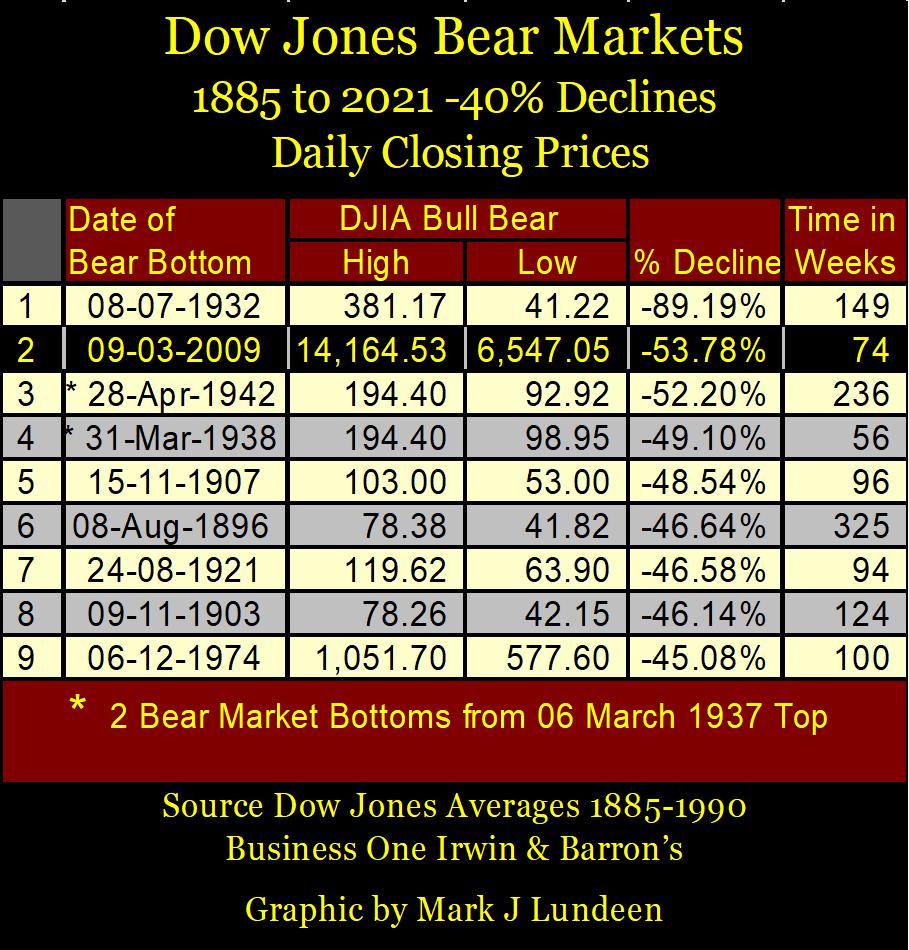
The table above only notes how long (in weeks) these bear markets lasted; from a bull market’s last all-time high, to where they bottomed somewhere below the BEV -40% line. However, each of the above bear markets first broke below their BEV -30% line on their way down to their ultimate bottom. How long did a 30% market decline take in these big bear markets?
That is an interesting question, for me anyways, as I’m expecting our current Dow Jones bear-market decline of only -21.34%, to become another big Dow Jones 40% bear market decline. So, this pending piercing of the BEV -30% line will be an important milestone on our way down to this bear market’s ultimate bottom, as it was in all of the bear markets noted above.
How long did it take these bear markets in the table below, to first break below their BEV -30% lines, from their last all-time high; the previous bull market’s Terminal Zero (TZ)?
The amount of time (in terms of NYSE trading sessions) varied greatly. The big bear market in the 1890’s took 926 NYSE trading session following its TZ before the Dow Jones deflated by 30%. Then the March 2020 flash crash, though not a 40% bear market, was a full-fledged selling panic in the stock market. It took only 22 NYSE trading sessions to deflate the Dow Jones by 30%. Note; it took the Great Depression Crash, another full-fledged selling panic, 46 NYSE trading sessions to deflate the Dow Jones by 30%.
More than twice as many as did the March 2020 flash crash, which should tell us something about the potential for disaster in March 2020, a disaster short circuited by the idiots’ Not QE #4. I think this is an important point to keep in mind for March 2023; the idiots may have short circuited a market disaster three years ago, but the potential for a market disaster is still here.
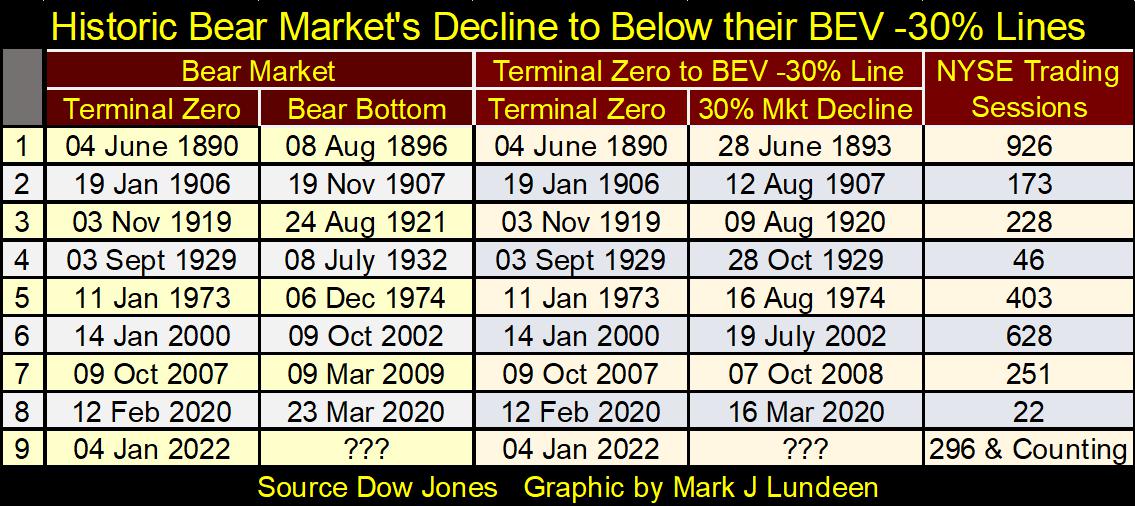
As of the close of this week, we’ve seen 296 NYSE trading sessions since the Dow Jones’ last all-time high (04 January 2022), and we’ve yet to see the Dow Jones deflate by 30%. As you can see above, historically speaking, that isn’t unusual. So, it’s dangerous believing the worst of this market decline is over, just because it’s been over fourteen months since the Dow Jones last saw an all-time high.
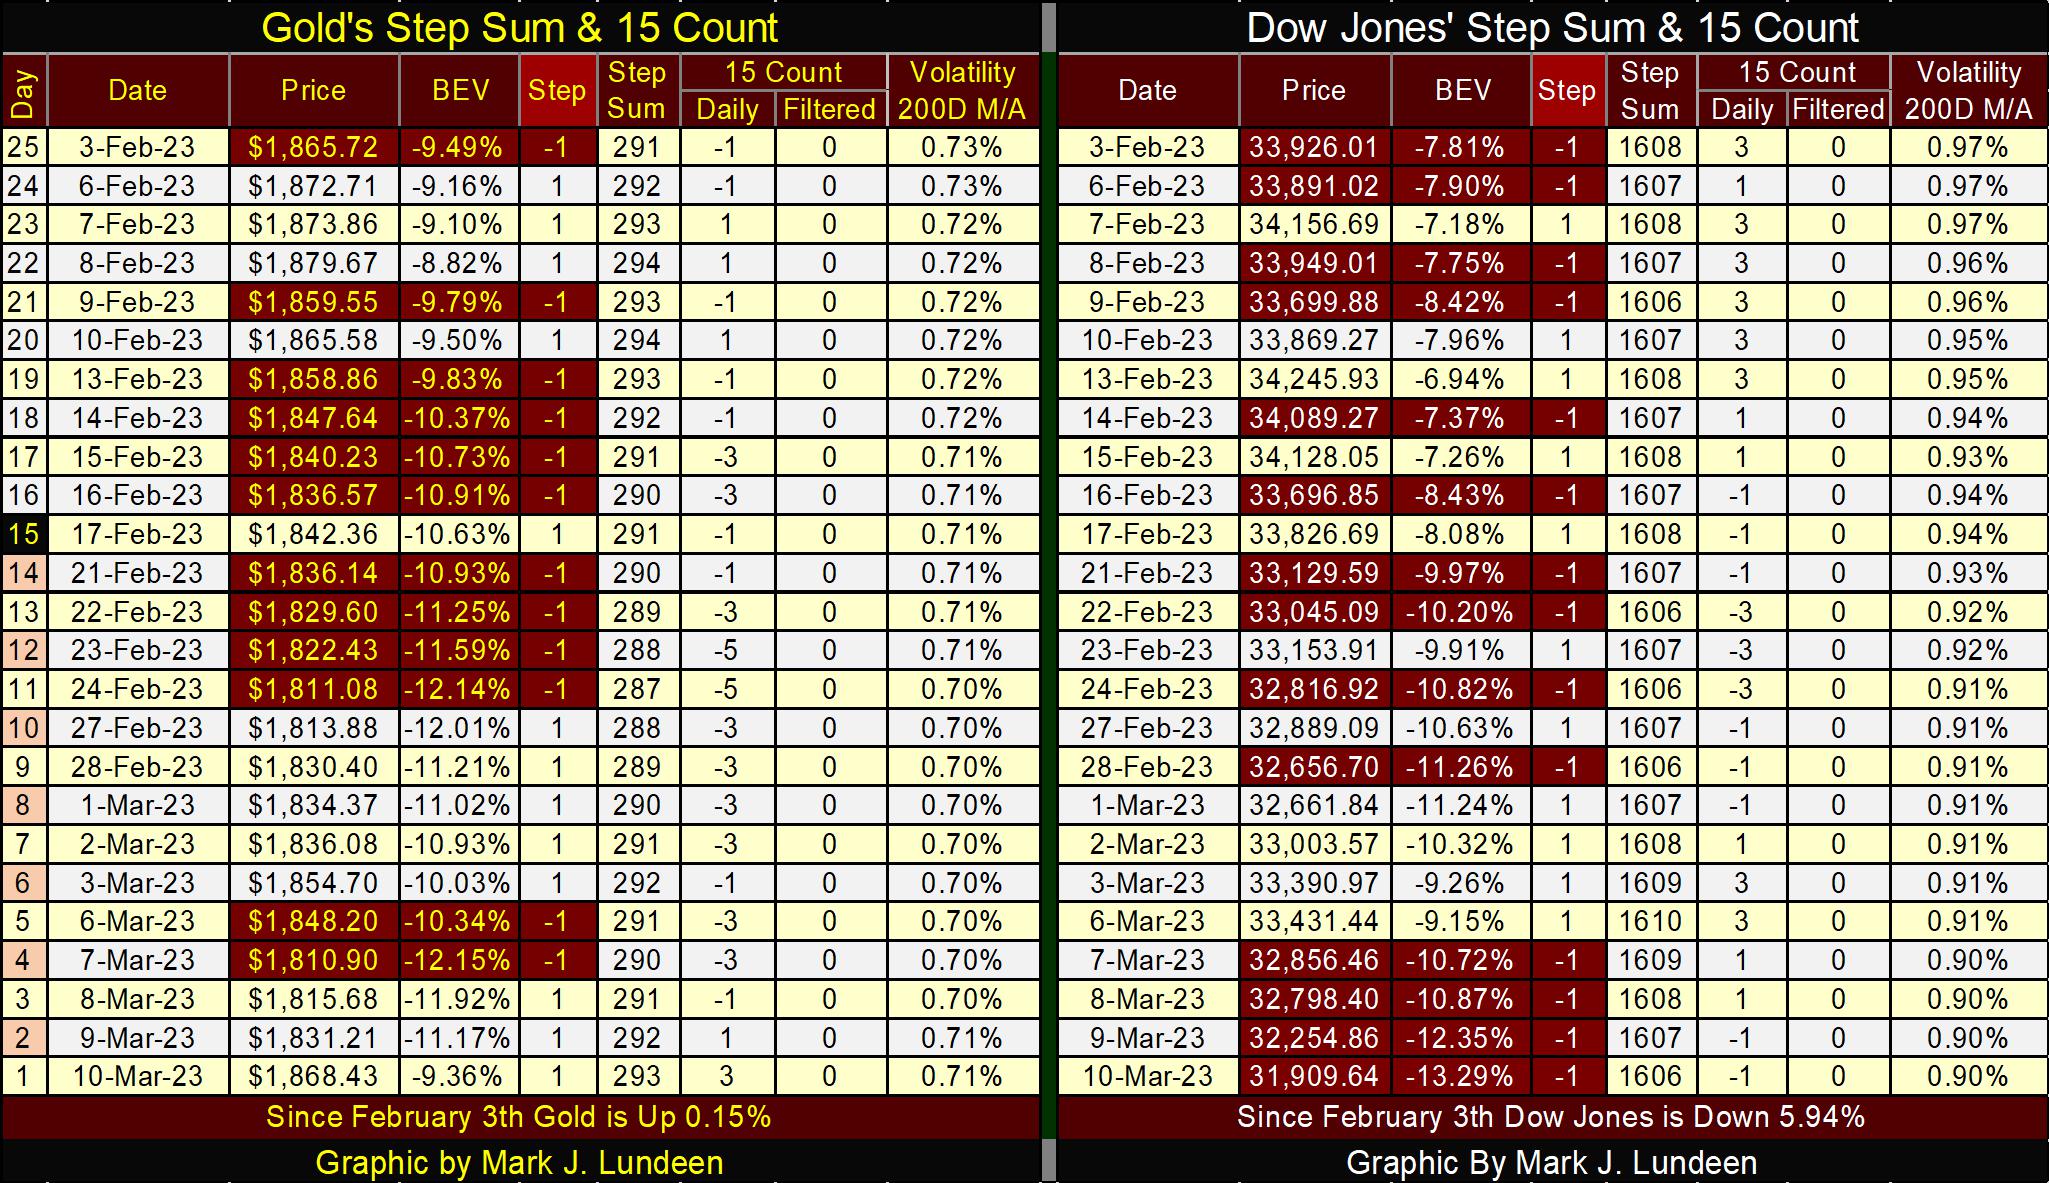
Gold had a solid week, closing above its BEV -10% line in the chart below. But has gold finally broken free from the machinations of the COMEX goons, evil creatures who sell phantom gold by the tons in the futures exchange? I think we’ll soon know. If so, we’ll soon see gold making new all-time highs, and silver trading over $30 an ounce. That must be good for the gold and silver miners.
Just eyeballing the step sum tables below; gold saw an end to a sell off in late February, and so far in March has seen buyers come into the market. The Dow Jones looks terrible in comparison. Daily volatility’s 200D M/A for the Dow Jones continues going down, closing the week at 0.90%.
It’s odd seeing volatility for the Dow Jones go down with its valuation. But if we are in bear market, that will soon change as Dow Jones days of extreme volatility; days where the Dow Jones moves +/-2% or more from a previous day’s closing price become common daily occurrences.
It seems a pity to end this week’s commentary, as so many things are happening. But I’ve said enough.
I’ll say one more thing; I can’t wait until I see Sunday’s pre-market trading tonight. It’s times like this were we just might see the Dow Jones down a few hundred points in early trading, and gold and silver trading higher than we thought possible. But then, maybe that isn’t going to happen Sunday night. Like me, my readers will just have to see what is to come.
Mark J. Lundeen
*********


